I. INTRODUCTION
Pure Cu is easily oxidized at high temperatures, Reference Zhu, Mimura, Hong and Isshik1 affecting the applications of its good electrical and thermal conductivity. An effective way to improve the oxidation resistance is the alloying of pure metal, such as addition of antioxidation alloying element Cr in Cu, forming oxide layer Cr2O3 with good thermal stability and compactness, which is coated on the surface of Cu to play a protective role. Reference Fu and Niu2,Reference Niu, Gesmundo, Viani and Douglass3 However, previous studies have shown that a continuous, protective, and slow-growing Cr2O3 oxide film can be formed on the surface of alloy to inhibit the oxidation, only when the addition content of Cr in Cu exceed a certain threshold. Reference Wagner4,Reference Gesmundo and Niu5 Furthermore, the uniform dispersion of fine Cr particles in Cu is more conducive to the formation of Cr2O3 film. Such a distribution produces a larger particle surface area. Thus, Cr can be supplemented through continuous dissolution and be rapidly transferred onto the alloy surface, creating the conditions for the formation of Cr2O3 film. Reference Cao, Niu and Wu6 Therefore, the addition amount of Cr in Cu and its dispersion are the key to antioxidation. When bulk Cu alloy is prepared using the traditional method, antioxidant fine Cr particles cannot be uniformly dispersed. For instance, the Cu–25Cr alloy and the Cu–20Ni–30Cr alloy were prepared by powder metallurgy process and melt-spinning process, respectively. The size of Cr particles in these two alloys is on the scale of several tens of micrometers. Reference Fu and Niu2,Reference Zhang, Niu and Wu7 The magnetron sputtering process in the literature Reference Fu and Niu2 can only be used to prepare a film, but is not suitable for the preparation of antioxidant bulk alloys.
According to the cluster structure model of stable solid solutions, Reference Chen, Wang, Wang, Qiang and Dong8–Reference Dong, Chen, Wang, Qiang, Wang, Lei, Calvo-Dahlborg and Dubois10 a face-centered cubic Cu can be understood as two parts including basic clusters and linking atoms: a Cu atom as the center is surrounded by the 12 Cu atoms as its first neighbor into a cubic octahedral basic cluster, which is connected by 1, 3, or 5 Cu atoms, based on the cluster formula of (Cu–Cu12)–Cu1,3 or 5. If linking atoms are replaced by other elements or clusters, alloying will be achieved. For example, the linking atoms of (Cu–Cu12)–Cu5 are replaced by [M1Ni12] clusters to form (Cu–Cu12)–[M1/13Ni12/13]5 structure. In this structure, M shall be the insoluble metal element which exhibits a relatively positive enthalpy of mixing with Cu, as well as a relatively negative enthalpy of mixing with Ni. The solute M would tend to be neighbored with 12 Ni atoms (the nearest neighbor coordination polyhedron in the face centered cubic structure is cuboctahedron with coordination number 12, formulated as [M–Ni12]) for their negative enthalpy of mixing. This idealized short-range-order structure is characterized by M-centered cuboctahedral clusters [M–Ni12] distributed in the Cu lattice in a homogeneous manner. In this way, the solubility of the element M in the system is determined by the content of the connecting element Ni. Furthermore, to obtain maximum stability of the above-described structure, the atomic ratio of M/Ni shall be 1/12. Reference Zhang, Wang, Wang and Dong11 This cluster design theory has been successfully used to prepare the Cu–Ni–Fe alloy with good corrosion resistance, as well as the Cu–Ni–Mo, Reference Li, Liu, Zhang, Chu, Wang and Dong12 Cu–Ni–Nb Reference Li, Zhao, Li, Liu, Bao, Chu and Dong13 and Cu–Ni–Sn Reference Li, Wang, Zhao, Bao, Chu and Dong14 alloy films with high stability and low resistivity. In this paper, we deal with a similar system Cu–Ni–Cr, where antioxidative Cr element plays the same role as M. To achieve a stable solid solution, the atomic proportion of Cr with respect to Ni should ideally satisfy Cr/Ni = 1/12. Further changes in Cr/Ni ratio to be greater than 1/12 will promote the precipitation of Cr. The alloy composition formula may be expressed as Cu–Cu12–[Cr x/(12+x)Ni12/(12+x)]5 (x = 1, 2, 4, 6 or 8). Thus, the solid solution and precipitation situation of antioxidative elements will be controlled. Furthermore, the solid solution of Ni and Cu is infinite, and the negative enthalpy of mixing between Cr and Ni shall be −7 kJ/mol, Reference Takeuchi and Inoue15 so the dispersion of Cr in Cu may be implemented with the help of Ni, which has been verified in the study of Cu–Ni–Sn alloy film. Reference Li, Wang, Zhao, Bao, Chu and Dong14 In summary, based on the cluster theory, this paper designed Cu–Ni–Cr alloys, explored the use of Ni of Cr into Cu for uniform diffusion and the adjustment of the solid solution and the precipitation state of Cr, and then studied the effects of the distribution state and oxidized growth morphology of antioxidative elements on the oxidation resistance of the alloys.
II. EXPERIMENTAL PROCEDURE
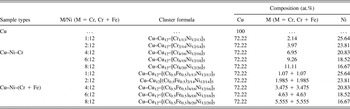
The Cu, Ni, and Fe with the purity of 99.99 wt% (4N) and the Cr with the purity of 99.9 wt% (3N) were melt into an alloy ingot (a two-step process: melt Ni and Cr into an intermediate alloy, and then melt the intermediate alloy and Cu into the Cu–Ni–Cr alloy ingot) using a nonconsumable arc melting furnace (according to the composition shown in Table I). Finally, the alloy rods were obtained using copper mold suction casting. The F47900 muffle furnace produced by Barnstead Thermolyne (Chula Vista, California) was adopted. The isothermal oxidation experiment was conducted in the atmosphere at 850 °C for 31 h. The SUPRA55 scanning electron microscope (SEM) produced by German Zeiss (Oberkochen, Baden-Wurttemberg, Germany) was adopted for the micro-morphology and energy spectrum analysis of sample.
The composition of Cu–Cu12–[M x/(12+x)Ni12/(12+x)]5 (M = Cr, Cr + Fe) system alloys and pure Cu.

This paper is designed to confirm the relationship between the distribution and morphology of Cr and the oxidation resistance of alloys. So based on Cu–Cu12–[Cr x/(12+x)Ni12/(12+x)]5 (x = 1, 2, 4, 6 or 8) series alloys, the premise is that the partition ratio of alloying elements remains the same. The Fe element was used for the substitution of 1/2 of Cr element to obtain Cu–Cu12–[(Cr0.5Fe0.5) x/(12+x)Ni12/(12+x)]5 (x = 1, 2, 4, 6 or 8) series alloys, which were simultaneously used as a reference sample for antioxidant studies to further validate the oxidation resistance relationship between element Cr and alloy. The reason why Fe was selected is that it is closer to Cr in the periodic table of elements and it has similar metallic properties. In addition, the experiment was provided with pure Cu as a reference sample, and all the sample components involved in this paper are listed in Table I.
III. RESULTS AND DISCUSSION
A. Oxidation kinetics curves
After isothermal oxidation at 850 °C for 31 h, most of the Cu–Cu12–[Cr x/(12+x)Ni12/(12+x)]5 samples were coated with a strong and dense gray-black oxide, especially the oxide scales of sample (Cu–Cu12)–[Cr6/18Ni12/18]5 were rarely best-preserved in the oxidation process. The oxide scales of pure Cu and sample (Cu–Cu12)–[Cr8/20Ni12/20]5 continuously flaked over large areas in the course of the oxidation; also, a serious crack in the oxide residues on the sample occurred, making the remaining volume smaller than other samples.
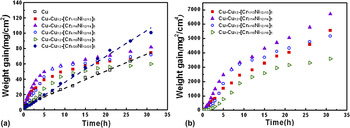
Figure 1(a) shows the curve of relationship between oxidation time and weight gain per unit area for pure Cu and Cu–Cu12–[Cr x/(12+x)Ni12/(12+x)]5 alloys, the pure Cu and sample (Cu–Cu12)–[Cr8/20Ni12/20]5 showed a linear relationship, at the oxidation rates of 6.2 and 9.4 × 10⁻⁴ g/(cm2·s1), respectively. This linear relationship suggests that the oxide layer generated without protective or adhesive due to fall off seriously, and the oxidation rate is directly determined by the chemical reaction between the materials and oxygen. Therefore, it indicated that the pure Cu and sample (Cu–Cu12)–[Cr8/20Ni12/20]5 showed worst oxidation resistance.
Oxidation kinetics of Cu and Cu–Ni–Cr alloys oxidized at 850 °C in the air for 31 h: (a) normal plots and (b) parabolic plots.

Most of Cu–Cu12–[Cr x/(12+x)Ni12/(12+x)]5 samples showed a curvilinear relationship. From the point of view of weight gain per unit area, the oxidation weight gains and oxidation rates for this part of the samples during the preoxidation were higher than those of pure Cu. But the changes in weight gain per unit area became smaller and smaller over time. Especially the weight gain per unit area of sample (Cu–Cu12)–[Cr6/18Ni12/18]5 was less than that of pure Cu at the end of the oxidation. When the metal oxide layer generated with protective, the oxidation rate is mainly determined by the diffusion of metal ions and oxygen in the oxide layer. The oxidation kinetics of the majority of metals and alloys should satisfy with parabolic rule. Researchers generally considered the oxidation time and weight gain per unit area of Cu and its alloys upon oxidation should satisfy this rule, Reference Haugsrud and Lee16 i.e., (Δw)2 = k p t, where Δw is the weight gain per unit area, k p is the parabolic rate constant, and t is the oxidation time. Accordingly, parabolic law was used for the oxidation time and weight gain unit area of the four samples with the curve of relationship in Fig. 1(a) [as shown in Fig. 1(b)], in which the curves were approximated by two parabolic curves. During the first 5–7.5 h of oxidation, the oxidation weight gain of each sample was more intense, indicating that the protective effect of the oxide film on the alloy was not very clear at the initial stage of oxidation, whereas when Cr/Ni ratio increased from 1/12 to 6/12 in the latter part of the process of oxidation, the parabolic constants were 4.0, 4.3, 2.6 and 2.1 × 10⁻⁸ g2/(cm4·s1). So the minimum parabolic constant value was achieved at the Cr/Ni ratio of 6/12.
In the Cu–Ni–Cr alloys, it is common that oxidation kinetics curves deviate from the parabolic law to be composed by multiparabola. For example, it was reported in the literature Reference Zhang, Niu and Wu7 that the k p of Cu–20Ni–30Cr alloy at the beginning of oxidation (oxidation in 0.1 MPa pure oxygen at 800 °C for 1440 min) was 1.7 × 10⁻⁸ g2/(cm4·s1), and the k p at 16–70 min was 3.26 × 10⁻⁹ g2/(cm4·s1), which was followed by the continuous decrease in parabolic rate constant with time. It should be noted that the parabolic rate constant cited in the above literature was less than that in Fig. 1(b), mainly because of quite high antioxidative elements Cr content and low Cu content.
B. SEM analysis
1. Precipitation state (Cu–Cu12)–[Cr6/18Ni12/18]5
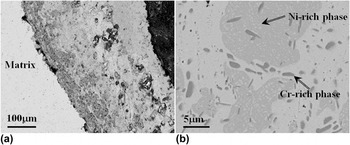
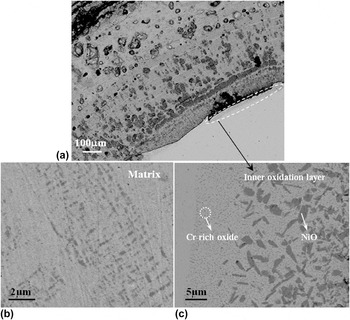
The backscattered electron image of the cross section of (Cu–Cu12)–[Cr6/18Ni12/18]5 is shown in Fig. 2(a). It can be seen from the figure that the alloy matrix shows the state of precipitation, there are relatively dense dark layered oxides at the oxide scale near the matrix. The dark oxides became less at the location closer to outside. Internal oxidation was not found on the top of the matrix, suggesting that element O failed to enter the alloy, because oxide scale played a better blocking effect.
Backscattered electron images of the cross section (a) and core portion (b) of (Cu–Cu12)–[Cr6/18Ni12/18]5.

Based on component design, the Cr content at this time was much greater than the best ratio of [Cr1Ni12] cluster, which led to the precipitation of Cr. Figure 2(b) shows the backscattered electron image of core portion of (Cu–Cu12)–[Ni12/18Cr6/18]5 (martix), from which a large number of micrometer precipitates can be seen. By spectroscopy, the smaller dark precipitated phase was identified as Cr-rich phase (Cu25%Ni4%Cr71%) and the larger light-colored cluster-shaped hollow precipitated phase was identified as Ni-rich phase (Cu22%Ni48%Cr30%), and the matrix composition was close to Cu84%Ni14%Cr2% after precipitation.
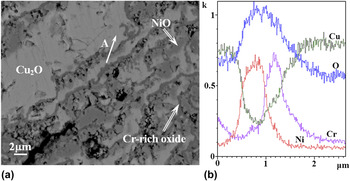
Figure 3(a) shows the back-scattered image of bottom layer (near the matrix) of outer oxide scale of (Cu–Cu12)–[Cr6/18Ni12/18]5, which is characterized by the distribution of layered oxide at Cu2O matrix. The energy spectrum analysis showed that the Cu2O in this area was in oxygen-deficient state, and it composed of Cu71.2%Ni1.0%Cr0.7%O27.1%, with the dark consecutive Cr-rich oxide layer (Cu33.6%Ni1.8%Cr20.5%O44.1%, the Cu content was higher due to the thinness of the layer, the energy spectrum analysis was affected by the surrounding Cu2O), and the light-colored island-shaped precipitate that was close to NiO (Cu15.6%Ni38.7%Cr1.1%O44.6%). The results of the energy spectrum line scanning for the area A shown in Fig. 3(b), verified that Cr and Ni were separately oxidized. According to the overall condition of the oxide scale shown in Fig. 2(a), Cr and Ni oxides exhibited gradient distribution, that is to say, the oxide of precipitated phase became less outwardly, until the top of oxide scale changed into a single CuO phase. This indicated that in the oxidation process, the diffusion rate of Cu was the highest compared with Ni and Cr; in the constant outward diffusion and oxidation process of Cu, Ni, and Cr were gradually enriched at the bottom to form their own oxide layers. Due to the shielding effect of the continuous multi-layer Cr-rich oxide, O could not enter the alloy matrix, but could be further oxidized through the outward diffusion of Cu, gradually decreasing postoxidation rate.
Backscattered electron image of bottom layer (near the matrix) of outer oxide scale (a) of (Cu–Cu12)–[Cr6/18Ni12/18]5. The results of the energy spectrum line scanning for the area A (b).

Therefore, Cr-rich phase was precipitated from sample (Cu–Cu12)–[Cr6/18Ni12/18]5 in the form of uniformly dispersed small particles. In this composition, a multi-layer Cr-rich oxide layer was formed at the bottom of the scale, blocking internal oxidation. It is worth mentioning that, Cr content herein added was greatly reduced. For the antioxidant Cu–Ni–Cr alloys reported in the literature, Reference Cao, Shen, Liu and Xue17–Reference Cao and Niu20 only when the Cr addition amount achieved 20–40 at%, can continuous Cr2O3 oxide film be formed. But such a large amount of Cr element added would inevitably adversely affect the electrical and thermal performance of Cu.
2. Precipitation state (Cu–Cu12)–[Cr2/14Ni12/14]5
The oxidation weight gain of (Cu–Cu12)–[Cr2/14Ni12/14]5 is the most evident among scale-preserved samples. Figure 4(a) shows the back-scattered electron image of a sectional view of the sample. Compared with (Cu–Cu12)–[Cr6/18Ni12/18]5 sample, the difference lies in the greater outer scale thickness, and the clear internal oxidation layer on the top of the sample matrix. The oxide precipitates failed to form a continuous layer, which had direct relationship with the less relative content of Cr (3.97 at%) in alloy.
Backscattered electron images of the cross section (a), matrix (b) and outer oxide scale at the bottom (c) of sample (Cu–Cu12)–[Cr2/14Ni12/14]5.

The Cr/Ni ratio of 2/12 was slightly greater than the best ratio of [Cr1Ni12] cluster, so the dispersion-phase precipitation still existed in the matrix [as shown in Fig. 4(b)], but the precipitation amount was much less than that at the Cr/Ni ratio of 6/12, and the size was small, about 0.5 μm. The energy spectrum analysis shows that the precipitate is only Cu46.6%Ni38.3%Cr15.1%, i.e., the precipitation is not dispersed Cr-rich phase at the Cr/Ni ratio of 2/12.
Figure 4(c) shows the inner oxide layer of sample (Cu–Cu12)–[Cr2/14Ni12/14]5, composed by diffused Cr-rich oxide and NiO, with a total thickness of about 40 μm. The reason for which was formed is that the outer scale of the sample in the oxidation process fails to effectively block diffusion of oxygen, and it enters the matrix. Cu in the alloy is continuously diffused outwards and oxidized, resulting in the enrichment of Ni and Cr alloying elements at the edges. Since Ni and Cr are more active than Cu, so that O is the first to react with Ni and Cr elements to produce the corresponding oxides. Therefore, the dispersion of fine particles (nanometer) of Cr-rich oxide phase fully proved that Cr was homogeneously dispersed in the alloy with the help of Ni, but apparently, this dispersion condition was related to the Ni/Cr ratio.
The experimental results reported in some literature can also confirmed the above-mentioned point. As reported in the literature, Reference Fu and Niu2 the average particle size of the Cr-rich phase in matrix for the Cu–25Cr alloy prepared by powder metallurgy process is 50–100 μm, and the Cr-rich phase for the Cu–20Cr alloy prepared by mechanical alloying process is 1 μm, and that of the Cr-rich phase for the Cu–20Cr alloy prepared by magnetron sputtering process is less than 1 μm. Obviously, the Cu–Cr binary alloys prepared by the common metallurgical method would not achieve the uniform distribution of Cr in Cu matrix, without the help of Ni. In the existing literature, for the Cu–Ni–Cr alloy that can form a continuous antioxidation protective film, the total addition amounts of Ni and Cr are very great. Such as Cu–30Ni–30Cr, Reference Cao, Shen, Liu and Xue17 Cu–30Ni–40Cr, Reference Cao, Shen, Liu and Xue17 Cu–45Ni–30Cr, Reference Cao, Gesmundo and Al-Omary19 etc., which have been out of the scope of Cu alloy in the strict sense. Therefore, the above-mentioned alloys can form a continuous antioxidation protective layer only by adding a large number of alloying elements alone, without taking into account the atomic proportion of Cr with respect to Ni. Although the magnetron sputtering process can achieve better dispersion of alloying elements, this process is not feasible for the preparation of the bulk alloy. Moreover, while element Cr is diffusion, the reduction in Cu grain size, the corresponding increase in crystal boundary and the formation of more diffusion channels may result in an adverse effect on the resistivity of the Cu alloy and other properties.
3. Solid solution state (Cu–Cu12)–[Cr1/13Ni12/13]5
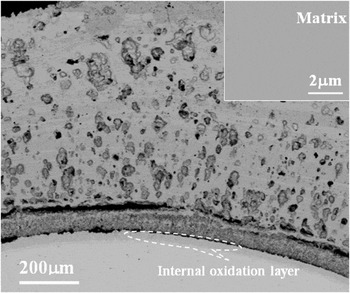
As shown in Fig. 5, because of the existence of internal oxide layer, sample (Cu–Cu12)–[Cr1/13Ni12/13]5 is not significantly different from the sample with the Cr/Ni ratio of 2/12 in the morphology of oxide scale in sectional backscattered electron image. The matrix of the sample under the backscatter imaging conditions is of completely solid solution state, without generating Ni–Cr precipitates (as shown in the thumbnail at the upper right corner of Fig. 5), which is fully consistent with the idea of composition design. The relative content of Cr (2.14 at%) is further reduced, and the oxidation resistance should be gradually decreased, but in fact the oxidation weight gain of the sample is less than that of sample (Cu–Cu12)–[Cr2/14Ni12/14]5, which is related to the addition of alloy elements at the ratio of stable solid solution cluster. Stable solid solution reduces the chemical reactivity of Cu–Ni–Cr alloy, which is consistent with the research results of Cu–Ni–M system films. Reference Li, Liu, Zhang, Chu, Wang and Dong12–Reference Li, Wang, Zhao, Bao, Chu and Dong14
Backscattered electron images of the cross section and matrix (at the top-right corner) of sample (Cu–Cu12)–[Ni12/13Cr1/13]5.

Therefore, under the premise of fixed Cu content, the only change in the Cr/Ni ratio of Cu–Cu12–[Cr x/(12+x)Ni12/(12+x)]5 alloys can achieve the control of the solid solution and precipitation of alloying elements. When the Cr/Ni ratio is 1/12, the alloy is of completely solid solution, without precipitation. When Cr/Ni ratio is greater than 1/12, the alloying elements precipitate in different forms. According to SEM analysis, the greater the Cr/Ni ratio, the more the Cr content is. The dispersed Cr-rich oxides gradually and continuously form a protective oxide film. However, for Cr/Ni ratio, more does not necessarily mean better. When the ratio increases to 8/12, the stress of oxide scale increases, resulting in the extremely serious flaking of oxide scale, the loss of protective effect, and sharp rise in the oxidation weight gain of the sample.
C. Oxidation of Cu–Ni–(Cr + Fe) system alloys
To further verify the relationship between the oxidation resistance of Cu–Ni–Cr system alloys and element Cr, without changing the addition ratio of alloying elements and the total addition amount, Cu–Ni–(Cr + Fe) system alloys were prepared with the substitution of Fe for 1/2 Cr element, and the oxidation behaviors of the alloys under the same oxidation conditions were studied.
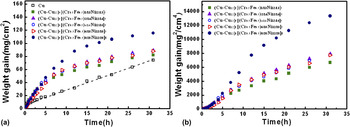
Figure 6(a) shows a curve of relationship between oxidation time and weight gain per unit area for pure Cu and Cu–Ni–(Cr + Fe) system alloys. Within the same oxidation time, the average weight gains per unit area of all Cu–Ni–(Cr + Fe) system alloys were greater than that of pure Cu. Figure 6(b) shows the curve of relationship between the squares of oxidation time and weight gain per unit area. The curves of sample Cu–Ni–(Cr + Fe) were composed by the two parabolic curves, of which the parabolic constants were significantly greater than those of other alloy samples at the (Cr + Fe)/Ni ratio of 8/12. And at the (Cr + Fe)/Ni ratio of 1/12 to 6/12, the weight gain after 5 h showed significant parabolic law, and the parabolic constants were: 5.2, 6.0, 5.8, and 5.5 × 10⁻⁸ g2(cm4·s1), respectively. This shows that the parabolic rate constants of Cu–Ni–(Cr + Fe) system alloys are the same as Cu–Ni–Cr system alloys in order of magnitude, but the values of Cu–Ni–(Cr + Fe) system alloys were greater. Obviously, after the substitution of Fe for 1/2 Cr, the oxidation resistance of the alloy deteriorated.
Oxidation kinetics of Cu and Cu–Ni–(Cr + Fe) system alloys oxidized at 850 °C in the air for 31 h: (a) normal plots and (b) parabolic plots.

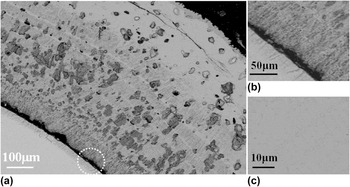
The alloy Cu–Cu12–[(Cr0.5Fe0.5)6/18Ni12/18]5 with minimum parabolic rate constant was selected for SEM analysis. Figure 7(a) shows the sectional backscattered electron image. The oxide scale is fully covered in the surface of the alloy, the structure of the oxide scale is similar to that of Cu–Ni–Cr system alloy, and the alloy oxide exhibits a gradient distribution from the inside out. What calls for special attention is the circled portion, which is amplified as shown in Fig. 7(b). The alloy oxides in the oxide scale and the inner oxide layer are of a discontinuous state, and exhibit a columnar structure revealing the orientation of growth perpendicular to the matrix. Therefore, due to the diffusion channel between two adjacent oxides, the entry of O cannot be effectively blocked, resulting in ongoing internal oxidation. Figure 7(c) shows the matrix backscattered electron image of alloy sample. Seen from the state of precipitation, Ni still can play the role of uniformly diffusing the alloy elements in the quaternary system. Compared with the ternary Cu–Ni–Cr system alloys, in the case of the same content of alloying elements, the amount of precipitates does not change, but due to the orientation of growth, Cu–Ni–(Cr + Fe) system alloys cannot form a continuous protective layer. Therefore, the orientation of growth of protective oxide is also one of the main factors that determine the oxidation resistance of the alloy.
Backscattered electron images of the cross section (a), oxide scale at the bottom (b) and matrix (c) of sample Cu–Cu12–[(Cr0.5Fe0.5)6/18Ni12/18]5.

IV. CONCLUSIONS
The cluster structure model of stable solid solutions can be used for the composition designing of antioxidant Cu alloys. In this paper, the Cu–Cu12–[Cr x/(12+x)Ni12/(12+x)]5 (x = 1, 2, 4, 6 or 8) alloys were designed using this model. With the help of element Ni, insoluble antioxidant Cr elements were uniformly distributed in Cu matrix. By varying the Cr/Ni ratio, the solid solution and precipitation of alloys were effectively controlled. The size of Cr-rich precipitates was less than several micrometers.
The Cr/Ni ratio and growth morphology of the oxide precipitates can significantly affect the oxidation resistance. In Cu–Ni–Cr system, when the Cr/Ni ratio was 6/12, scilicet Cr content diffused in the alloy was 9.26 at%, a continuous protective Cr-rich oxide layer can be formed, effectively preventing internal oxidation. Corresponding to the Cu–Ni–(Cr + Fe) alloy with the same alloy content, oxide precipitates exhibited a columnar structure revealing the orientation of growth perpendicular to the matrix, and a lot of O diffusion channels were formed, resulting in a sharp decline in its oxidation resistance.
ACKNOWLEDGMENTS
This project was supported by the National Natural Science Foundation of China (Grant No. 51271045) and the Natural Science Foundation of Jiangsu Province, China (Grant No. BK20131138).