Implications
In Rendena and Aosta Red Pied dual-purpose breeds, the number of linear type traits recorded by classifiers and managed by the breeder associations is very huge. This can lead to difficulties in analysing data for genetic improvement. Factor analysis allows simplifying calculations by using reduced variables but without excluding information given by traits. Results from the present study could be useful for breeder associations to better define the global genetic indexes and manage data. Breeding goals for dual-purpose breeds are in continuous development, and several new techniques, as factor analysis, could improve and simplify the procedures for genetic evaluations.
Introduction
In the past, morphological evaluation was one of the pillars of cattle selection, because it enabled an immediate evaluation of the animal conformation and a relatively simple classification (Forabosco et al., Reference Forabosco and Mantovani2005). Over the years, the economic and genetic relevance of type traits in dairy cows has become secondary compared to the productive traits. However, morphology is still important in many specialized dairy and beef breeds, and the global index used for selection in many breeds often includes morphological traits. In addition, morphological evaluation represents an important moment during which the farmers and breeding organizations connect. Today, morphology is obtained in a well-organized scoring system of many traits using a linear scale. The use of morphological traits in selection programmes requires the knowledge of both their genetic parameters and their relationship with the main productive traits. The traditional approach of analysing the relationship between type traits and production data was based on the use of a multiple regression method. This approach, however, has limitations because there are often a large number of traits that are interrelated. Indeed, some traits referring to the same part of the body are characterized by a high genetic correlation (Foster, Reference Foster1985), reflecting the expression of the same genes. For example, VanRaden et al. (Reference VanRaden, Jensen, Lawlor and Funk1990) and Mazza et al. (Reference Mazza, Sartori and Mantovani2014), found high genetic correlations between rear udder height and rear udder width, ranging from 0.85 to 0.95, in some cattle breeds. High genetic correlations were also found among non-udder traits; for example, Klei et al. (Reference Klei, Pollak and Quaas1988) and Misztal et al. (Reference Misztal1992) identified high genetic correlations between body depth and strength (from 0.85 to 0.93) in Holstein cows. Furthermore, using a large number of traits containing common information in multiple regressions can also lead to biased estimates of their relationship with productive traits due to collinearity (Sieber et al., Reference Sieber, Freeman and Hinz1987; Macciotta et al., Reference Mantovani, Cerchiaro and Contiero2012). To avoid redundant information in section indexes, only a limited number of type traits with a known biological relationship with production and/or herd life should be used in the indirect estimation. A general statistical approach which properly accounts for dependencies among variables is the factor analysis (Linder and Berchtold, Reference Linder and Berchtold1982). This procedure removes redundant information from correlated variables and represents the original variables with a smaller set of derived variables called ‘factors’ (Vukasinovic et al., Reference Vukasinovic, Moll and Künzi1997). Basically, factor analysis can be regarded as an analytical linear model that is much less restrictive than a traditional linear model with one or a few dependent variables (Enevoldsen et al., Reference Enevoldsen, Hindhede and Kristensen1996). Ali et al. (1998) presented four reasons for which applying factor analysis to type trait data is considered to be an important innovation: (1) summarizing information from the observed type traits into a few unobserved and relatively uncorrelated derived factors; (2) partitioning each trait response into a covariant and a specific part the variance of each component can be estimated; (3) grouping type traits such that correlated traits could be isolated in the same factor and each factor will include traits with common biological and/or physiological characters; (4) the magnitude of each loading in the factor pattern reflects the importance of each type trait within the derived factor. Previously, factor analysis was applied in scientific disciplines during most of the 20th century, like in socio-biology (Crawford and DeFries, Reference Crawford and Anderson1978; Crawford and Anderson, Reference Crawford and DeFries1989) and it has been also used in animal sciences to find indicators of management and production levels for dairy cattle herds (Enevoldsen et al., Reference Enevoldsen, Hindhede and Kristensen1996), to evaluate relationships between longevity and type traits (Vukasinovic et al., Reference Vukasinovic, Moll and Künzi1997), to model the shape of the lactation curve (Macciotta et al., Reference Macciotta, Cecchinato, Mele and Bittante2004), and to study the structure of relationships between milk yield, milk composition and milk coagulation properties (Macciotta et al., Reference Mantovani, Cerchiaro and Contiero2012). Applications in animal and veterinary science, however, are scant and in most of cases outdated, but these and other examples confirm the usefulness of the analytical approach (Sieber et al., Reference Sieber, Freeman and Hinz1988). However, only few studies dealing with factor analysis applied to linear type traits in dual purpose breeds are available in the literature. In such breeds, the study of the relationship between different type traits reflecting both milk and meat characteristics could be of further interest for appropriately addressing the selection for both these traits. Therefore, the aim of the present study was to consider the use of the factor analysis as a method of investigating the relationships between type traits in two Italian local dual purpose populations characterized by a similar morphological evaluation chart and an identical scoring system. Both the Rendena and the Aosta Red Pied breeds have been previously investigated for the genetics of the individual linear type traits and analytically described (Mazza et al., Reference Mazza, Guzzo, Sartori, Berry and Mantovani2013, Reference Mazza, Sartori and Mantovani2014 and Reference Mazza, Sartori and Mantovani2015). Being part of a wider project aimed at implementing a global selection index in these dual purpose breeds, this study also set out to investigate the use of factor scores as a tool for obtaining breeding values to be implemented in animal breeding. For this reason, the genetic parameters of factor scores obtained were also estimated.
Material and methods
Subjects of the study and morphological evaluation
The Rendena (REN) and the Aosta Red Pied (ARP) cattle are indigenous Italian dual purpose breeds (milk and meat production) that belong to the ‘European federation of cattle breeds of the Alpine system’, an organization whose main purpose is the preservation and the promotion of the breeds raised in the Alps (FERBA, 2014). Both breeds are widespread in Northern Italy (the REN in the Eastern Alps and in the Veneto Region and the ARP in the Western Alps,) representing small medium size cattle with good fertility and longevity. Their main characteristic is their rusticity, that is, their ability to live and reproduce in harsh climates and environments with low quality forages, such the Alpine pasture where cows graze during the summer season (Forabosco and Mantovani, Reference Forabosco, Rossetti, Sarti, Panella, Bittante, Mantovani and Filippini2011). The two breeds are linked by a comparable milk production (3700 kg/lactation per cow in ARP and 5200 kg/lactation per cow in REN) and similar milk characteristics (about 3.5% of fat and 3.3% of protein in both breeds). The two breeds have also a similar chart used for linear type evaluation, accounting for 20 and 22 linear type traits, for REN and ARP, respectively, and the same four composite traits, that is, body size, muscularity, body shape and udder (see for description Mazza et al., Reference Mazza, Sartori and Mantovani2014 and Reference Mazza, Sartori and Mantovani2015). The main differences between the two charts (Mazza et al., Reference Mazza, Sartori and Mantovani2014 and Reference Mazza, Sartori and Mantovani2015) are the addition of rump length and teat placement side view in ARP compared to REN, and a different expression of one trait within the group of body size (thorax width in ABP is exchanged with thorax length in REN) and in the group of muscularity traits (front muscularity in ABP is replaced by the shoulder fore view score in REN). Last of all, the thinness score in the two breeds has opposite biological extremes, that is, the minimum is fine in ABP and heavy in REN, and vice versa for the maximum score (Mazza et al., Reference Mazza, Sartori and Mantovani2014 and Reference Mazza, Sartori and Mantovani2015). All traits for both breeds were scored using a 1 to 5-point scale system by specialized classifiers within annual rounds of evaluations (approximately from February to May) that are aimed at scoring all primiparous cows after calving (usually falling between October and December due to the strong seasonality).
Data editing and statistical analysis
After editing, the final datasets available for this study consisted of type classification records on 11 933 first parity Rendena cows evaluated between 1994 and 2014, and on 36 168 primiparous Aosta Red Pied cows evaluated from 1997 to 2014. Classifications of conformation traits considered in this study were the 20 (REN) and 22 (ARP) individual linear type traits collected once in the life of each cow by two National Associations of Breeders (A.N.A.RE., National Association of Rendena Breeders; and A.N.A.Bo.Ra.Va., National Association of Valdostana Breeders). These data sets were obtained from an editing process in which cows with incomplete measurements or with missing information on the age at parity, on the stage of lactation at morphological evaluation or those belonging to a herd-year-classifier (HYC) contemporary group with less than two animals were excluded. The choice of maintaining at least two observations within each HYC was due to the great amount of environmental cells with two or three records, that is, about 33% in REN and about 51% in ARP, and verified through a preliminary checking aimed at analysing the consistency of results by increasing the threshold to three or four records per HYC. Remaining observations included in the study belonged to daughters of 730 sires (15.4 average daughters/sire) for REN and to daughters of 2168 sires (15.5 average daughters/sire) for ARP. An amount of 6.5% of cows had unknown sire. All available pedigree information (18 610 animals from 1309 sires for REN; 63 015 animals from 4951 sires for ARP) was used to set up the relationship matrix among animals in the genetic analysis. Before running statistical analysis, all data variables belonging to the two breeds were checked for normality, and both Kolmogorov–Smirnov and Anderson–Darling tests (SAS Institute Inc., 2009) indicated a normal distribution for all the 42 linear type traits analysed (data not shown). Factor analysis was then computed separately for the two breeds using the raw data (Chu and Shi, Reference Chu and Shi2002 FACTOR Procedure; SAS Institute Inc., 2009). The varimax rotation as described by Kaiser (Reference Kaiser1958) was carried out to obtain latent factors that accounted only for the traits with large absolute value of loadings (Ali et al., Reference Ali, Koots and Burnside1998, Macciotta et al., Reference Macciotta, Cecchinato, Mele and Bittante2004 and Reference Mantovani, Cerchiaro and Contiero2012). The varimax rotation method was chosen in order to obtain orthogonal loading coefficients that maximize the variance of the loadings, that is, to maximize independencies among factors (Kaiser, Reference Kaiser1958). The factor scores from standardized type traits were then calculated for each animal using the factor pattern coefficients kept from the eigenvalues criterion (Cattell, Reference Cattell1978) and using the specific option of SAS (SAS Institute Inc., 2009). Factor scores are normally distributed standardized variables (SAS Institute Inc., 2009). Only components with eigenvalues ⩾1 were kept for the analysis (i.e. Kaiser criterion; Russel, Reference Russel2002) and interpreted from the biological point of view by looking at the loading coefficients of the individual linear type traits (i.e. the correlation with the factor). Generalizing Russel (Reference Russel2002), the classic factor analysis equation specifies that a measure being factored can be represented by the following equation accounting n factors:
 $$x_{m} {\rm =}w_{{m{\rm 1}}} F_{{\rm 1}} {\plus}w_{{m{\rm 2}}} F_{{\rm 2}} {\plus}...w_{{mn}} F_{n} {\plus}w_{{mn}} U_{n} {\plus}e_{m} $$
where x m is the m-th measure, F n the n-th common factors that underlies the m-th measure being analysed, and the U n the n-th factors that are unique to each m-th measure. Furthermore, the w mn represents the n-th factor loading coefficients or loadings of each m-th measure on the respective factors (i.e. correlation between the n-th common factors), whereas the e m reflects the random measurement errors in each m-th measure. Note that each measured trait has its own unique factor, reflecting systematic variance in the item that is not shared with the other measures being analysed. On the basis of this equation, the variance in the measure being factored can be separated into three parts. The first part of the variance in the measure reflects the influence of the common factors, the second part reflects the influence of the factor unique to the measure, and the third the random error variance (Russel, Reference Russel2002).
Finally, genetic and residual variance components were estimated for both the 42 linear type traits and for each factor score, separately using a series of univariate animal linear model analysis in the REMLf90 program (Misztal, Reference Misztal, Lawlor, Short and VanRaden2008) and applying the EM-REML algorithm. The same model was previously used for analysing the only linear type traits on the same breeds (Mazza et al., Reference Mazza, Sartori and Mantovani2014 and Reference Mazza, Sartori and Mantovani2015). Therefore, the model considered for the REML single-trait analysis was as follows:
 $$y_{{ijkl}} ={\rm HYC}_{i} {\plus}{\rm AFC}_{j} {\plus}{\rm DIM}_{k} {\plus}a_{l} {\plus}e_{{ijkl}} $$
where y ijkl is the type trait or factor score for cow l-th, HYC i is the fixed effect of i-th HYC of evaluation (with i=1,…. 1718 for REN; and i=1, 8068 for ARP), AFC j is the fixed effect of j-th age at first calving (with j=1, …, 9 for REN; and j=1, …, 5 for ARP), DIM k is the fixed effect of k-th class of days in milk (with k=1, …, 8 for REN; and k=1, …, 7 for ARP), a l is the random additive effect of l-th cow, and e ijkl is the random residual term.
In the matrix notation, the model can be expressed as:
 $${\bf y=X\bbeta {\plus}Za{\plus}e}$$
where y is an N×1 vector, β is the vector of systematic effects of order p, a the vector of animal additive effects with order q, and e the vector of residual effects. Furthermore, X and Z are the corresponding incidence matrices with the appropriate dimensions.
The resulting assumptions about the structures of (co)variances were:
 $$V\left| {\matrix{ a \cr e \cr } } \right|{\rm }={\rm }\left| {\matrix{ {{\bf A}\sigma _{a}^{{\rm 2}} } & {\rm 0} \cr 0 & {{\bf I}\sigma _{e}^{{\rm 2}} } \cr } } \right|$$
where
 $\sigma _{a}^{2} $
is the direct additive genetic variance, and
 $\sigma _{e}^{2} $
the residual variance, A the numerator relationship matrix and I an identity matrix. The standard errors of the heritability estimates were calculated following the formula proposed by Falconer (Reference Falconer1989). A rank correlation analysis (SAS Institute Inc., 2009) was carried out considering estimated breeding values (EBVs) derived from a best linear unbiased prediction (BLUP) univariate analysis on factor scores and the EBVs from the BLUP univariate analysis obtained for the individual linear type traits (20 for REN and 22 for ARP). Each BLUP run was carried out by accounting for the appropriate estimates of (co)variances previously obtained via REML analysis. EBVs belonging to each factor score were correlated with EBVs obtained for all individual traits. Rank correlation analyses were carried out within breed by considering the animals with records, which had EBVs with similar accuracies.
Results
Factor analysis
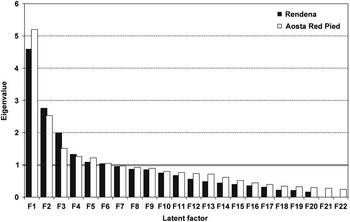
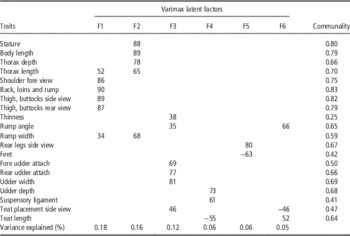
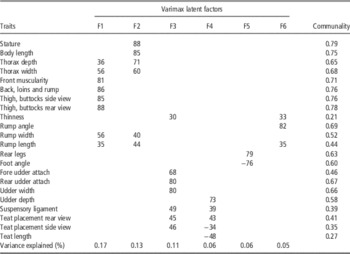
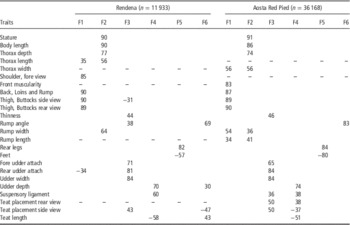
Varimax rotated factor patterns coefficients (multiplied by 100 and rounded) and communalities are reported in Table 1 (REN) and in Table 2 (ARP). Only loading coefficients⩾|30| are reported for each factor obtained. Six latent common factors with eigenvalue ⩾1 were extracted for each breed (eigenvalues from 4.59 to 1.04 for the Rendena breed, and from 5.20 to 1.05 for the Aosta Red Pied; Figure 1). Due to the properties of the varimax rotation method, the interpretation of each of the extracted factors is easier, because of each factor represents only a small number of variables. The six latent factors explained 63% and 58% of the total variance, respectively for the REN and the ARP, among the type traits considered in each breed. In both breeds Factor 1 (F1), the one accounting for the bigger proportion of variance (18% for REN and 17% for ARP, respectively), and with the greatest eigenvalue (Figure 1) is meanly related to the cow’s muscularity traits, including shoulder fore view (loading coefficient of 0.86 for REN; Table 1) and front muscularity (loading coefficient of 0.81 for ARP; Table 2), back, loins and rump and thigh, buttocks side and rear view. Other type traits not related to muscularity and mainly associated to body or rump size are also included in F1, but with much lower magnitude (i.e. lower loading coefficient) as compared to muscularity traits, that is, thorax length (0.52) and rump width (0.34) in Rendena breed, and thorax depth (0.36), thorax width (0.56), rump width (0.56) and rump length (0.35) in Aosta Red Pied breed. Factor 2 (F2) clearly describes the size of the cows in both breeds, including the four individual body size type traits (stature, body length, thorax depth and thorax length or thorax width depending on the breed considered), that are included in F2 with a loading coefficient >60% in both breeds (Tables 1 and 2). This factor presents 16% and 13% of the total variance explained for the Rendena and Aosta Red Pied breeds, respectively. Again, the rump size traits enter in this factor in both breeds, although only in the REN the loading coefficient was >60% (Table 1). On the other hand, rump size traits are highly correlated: from 0.69 to 0.96 in the REN breed, and from 0.68 to 0.93 in the ARP breed (data not shown).
Distribution of eigenvalues obtained for each latent factor after varimax rotation for the 20 (Rendena breed, black bars) and 22 (Aosta Red Pied breed; white bars) linear type traits analysed in the study.

Latent factors, loading of individual type traits (loading coefficients⩾|30|) and communality after varimax rotation of 20 linear type traits for the Rendena breed

Latent factors, loading of individual type traits (loading coefficients⩾|30|) and communality after varimax rotation of 22 linear type traits for the Aosta Red Pied breed

The third and the fourth factors (F3 and F4) both accounted for traits belonging to the mammary system in both analysed breeds; More specifically, on the basis of the loading coefficient into the F3 (12% and 11% of the total variance explained for REN and ARP, respectively), the traits mostly accounted for are those related to the udder size, such as fore and rear udder attachments and udder width (loading coefficient ⩾0.68 considering the two breeds); on the other hand, F4 (6% of the total variance explained in both REN and ARP), includes mainly udder conformation traits, as can be noted by the high positive loading coefficients of the udder depth (0.73 in both breeds) and suspensory ligament (0.61 in REN and 0.39 in ARP), and negative loading coefficients for teat length (−0.55 for REN; −0.48 for ARP). In this factor, a positive value of loading coefficients for teat placement rear view (0.43) and a negative loading coefficient for teat placement side view (−0.34) were observed in the Aosta Red Pied breed. In spite of the low amount of the total variance explained (6% in REN and ABP), Factor 5 (F5) is related to feet and rear legs individual type traits (Tables 1 and 2), with high and positive loading coefficients for rear legs (0.80 and 0.79 for REN and ARP, respectively) and negative loading coefficients for feet (−0.63 for REN; −0.76 for ARP). The last latent factor (F6), which explained about 5% of the total variance, shows different loading coefficients in the two breeds; for the Rendena population, it involves rump angle and two individual udder conformation traits, such as teat placement side view (with a negative loading coefficients of −0.46) and teat length (0.52). Regarding the Aosta Red Pied breed, Factor 6 includes three individual traits only related to the body shape of cows, such as thinness (0.33), rump angle (0.82) and rump length (0.35). In both analysed breeds, thinness is the individual trait with the lowest communality (i.e. 0.25 and 0.21 in REN and ABP, respectively). In ABP, also teat length was characterized by a low communality with factors, indicating an almost complete independence from factors and the other individual traits. The remaining subsequent factors with eigenvalue <1 (Figure 1) were not further considered because of they did not account a sufficient amount of variance to clearly describe group of traits.
Variance components and factor scores heritability
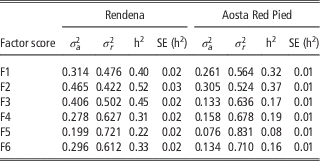
Variance components for the six different factor scores are shown in Table 3. Heritability estimates for the Rendena breed presented a mean value of 0.37 with standard errors of 0.02, whereas for the Aosta Red Pied breed the mean value of heritability was 0.21 with standard errors of 0.01 for all considered factor scores. In particular, the lowest heritability estimates were for F5 (feet and legs factor score) in both breeds (0.22 for REN and 0.08 for ARP, respectively). However, in both breeds the highest values of heritability observed were for F2, a factor score accounting for the body size individual type traits (0.52 for REN and 0.37 for ARP, respectively). Factor 1 (i.e. muscularity factor score) presented medium heritability values (i.e. 0.40 for REN and 0.32 for ARP, respectively), whereas the factor score accounting for mammary size traits (F3) and the one considering udder conformation traits (F4) showed higher heritability values in the Rendena population than in the Aosta Red Pied (0.45 v. 0.17 F3; and 0.31 v. 0.19 F4, respectively).
Estimated variance components, heritability values and standard errors for 6 factor scores obtained in Rendena (n=11 933) and Aosta Red Pied cows (n=36 168) and analysed as factor

 $\sigma _{a}^{2} $
=additive genetic variance;
 $\sigma _{r}^{2} $
=residual variance; h2=heritability; SE (h2)=standard error of h2.
Correlations between type EBV’s and factor scores’ EBV
Rank correlation analysis (only values⩾|30| reported) between individual type EBVs and factor scores’ EBV are reported in Table 4. As expected, the correlation coefficients showed patterns very similar to the loading coefficients of individual traits on each factor accounted for. Indeed, EBVs obtained for F1 are highly and positive correlated with the EBVs of the four individual muscularity traits (0.84<r<0.90 for REN; and 0.82<r<0.89 for ARP, respectively). In addition, rank correlations between EBVs of F2 and EBVs of body size-related traits were high and positive (from 0.56 to 0.90 for REN, and from 0.54 to 0.90 for ARP, respectively), reflecting results previously reported for the loading coefficients between individual traits and the second latent factor. The same findings can be observed also for the other factor scores taken into account in the present study. For example, rank correlation values between individual trait EBVs and F3 EBV presented greater coefficients for the same individual type traits loaded in the latent F3 scores (mean value of about 0.78 for both breeds). This pattern was observed also for F4 and F5. Finally, the correlation analysis between individual type EBVs and F6 EBV indicated the difficulty of identifying the latent factor with any precision due to the transient link with a consistent group of individual traits reflecting a single animal feature.
Rank correlation coefficients (only values⩾|30|) between EBVs estimated for individual type traits and EBVs obtained from 6 factor scores (from F1 to F6) in both breeds considering animals with records (11 933 first parity Rendena, and on 36 168 first parity Aosta Red Pied cows)

Discussion
Several studies indicate that the number of traits can be represented by fewer factors without a reduction in accuracy when describing the cow’s conformation (Sieber et al., Reference Sieber, Freeman and Hinz1987; Ali et al., Reference Ali, Koots and Burnside1998; Forabosco et al., Reference Forabosco and Mantovani2005). The primary interest of the present study lies in the algebraic sign and magnitude of the loading coefficients and in the percentage of the total variance explained by each factor. A trait with a large loading coefficient contributes more to the factor than a trait with a small one (Sieber et al., Reference Sieber, Freeman and Hinz1987). Once the loading coefficients are determined, with a varimax rotation in this case, one should try to make an interpretation of the factors by trying to confer a biological sense to the latent factor (Brown et al., Reference Brown, Brown and Butts1973). The varimax rotation criterion was first introduced by Kaiser (Reference Kaiser1958) and it is known as such because it maximizes the sum of variances of the squared loadings (squared correlations between variables and factor). With a procedure like this that allows a clear separation between factors, a simpler interpretation of the factors can be undertaken (Russel, Reference Russel2002). Despite not being considered the best method, the orthogonal rotation is the most widely used method, as reviewed by Russel (Reference Russel2002). A factor score is calculated by multiplying the standardized value of a trait times the trait’s factor pattern coefficients and adding these products (Sieber et al., Reference Sieber, Freeman and Hinz1987). Ideally, in the factor scores, the coefficient of correlation between each ‘real’ and the obtained factor is maximized (McDonald and Burr, Reference McDonald and Burr1967). Therefore, the factors can be interpreted and described according to the largest values (loading coefficients>|30|) of the traits. Regarding the Rendena breed, the first six latent factors, those presenting eigenvalues ⩾1, accounted for 63% of the total variance among the 20 type traits, whereas the first six latent factors in the Aosta Red Pied breed accounted for 58% of the total variance among the 22 type traits. Sieber et al. (Reference Sieber, Freeman and Hinz1988) found that factors with eigenvalues >1 explained 73.6% of the total variance in type score of Holstein dairy cows. A similar value was found for the first five latent factors in a study on Canadian Holstein (Ali et al., Reference Ali, Koots and Burnside1998).
The same value of total variance explained by factors in the Rendena breed was also found in a previous study on factor analysis conducted by Mantovani et al. (Reference Macciotta, Vicario, Dimauro and Cappio-Borlino2005), but with a smaller data set. Higher values of explained variance have been reported in a study comparing three Italian beef cattle breeds, that is Chianina (91% of total variance explained), Marchigiana (86% of total variance explained), and Romagnola breed (93% of total variance explained; Forabosco et al., Reference Forabosco and Mantovani2005). Regarding the single factors obtained in this study in both breeds, the first factors that explain the majority of the total variance included highly correlated type traits, as reported in previous studies (i.e. from 93% to 95% among individual muscularity traits in REN and ARP, respectively; Mazza et al., Reference Mazza, Sartori and Mantovani2014 and Reference Mazza, Sartori and Mantovani2015). Indeed, cows with large values for F1, that resulted highly and positive correlated with muscularity individual traits in both breeds, can be pictured with developed shoulder, back, loins and rump and large buttocks. On the other hand, high values for F2, related to individual body size traits, represent tall and large animals, traits for which high genetic correlations were observed in a previous study carried out on the same breeds (Mazza et al., Reference Mazza, Sartori and Mantovani2014 and Reference Mazza, Sartori and Mantovani2015). F3 and F4 were identified in this study as udder traits related factors, giving a definition of the size and the quality of the mammary system, respectively, in both breeds. In other words, high values for F3 lead to tight, tall and broad udder, whereas high values of F4 refer to cows with shallow and strong udders (positive loading coefficient), but also with close and short teats (negative loading coefficient). A negative loading coefficient for teat length and the related factor was also reported by Mantovani et al. (Reference Macciotta, Vicario, Dimauro and Cappio-Borlino2005) in the Rendena breed (i.e. −0.70). Factor 5 gives a similar view of REN and ARP cows, presenting high and positive loading coefficients with rear legs and negative with feet traits, leading to sickle legs and low foot angle, which have a biological sense in spite of the opposite direction of scores (i.e. increasing score for sickle as compared to straight legs, and decreasing score for low as compared to steep foot angle; Mazza et al., Reference Mazza, Sartori and Mantovani2014 and Reference Mazza, Sartori and Mantovani2015). Finally, the last factor (F6), showing medium to low loading coefficients with individual body shape traits, did not give a clear picture of our dual purpose cows on the basis of different individual traits loaded, particularly in ARP. As in the study of Mantovani et al. (Reference Macciotta, Vicario, Dimauro and Cappio-Borlino2005), the rank correlation analysis between individual type EBVs and factor scores’ EBV shows very similar patterns to the loading coefficients of individual traits on latent factors. For example, ranks for EBVs obtained for F1 indicated a high correlation with the individual muscularity traits (0.84<r<0.90 for REN; 0.82<r<0.89 for ARP, respectively). In addition, also EBVs for mammary size and udder conformation factors (i.e. F3 and F4) showed high correlations with EBVs of fore and rear udder attach and udder width (0.70<r<0.83 for REN; 0.65<r<0.84 for ARP, respectively), and with EBVs of udder depth (0.70 and 0.72 in REN and ARP, respectively), suspensory ligament (0.59 and 0.35 in REN and ARP, respectively) and teat length (−0.57 and −0.48 in REN and ARP, respectively). The generally high rank correlations between factor scores’ EBVs and the corresponding EBVs for individual type traits with which the factor is associated, indicate the possible use of factor score as a derived variable to be implemented for animal breeding purposes. However, a careful choice of factors should be considered, because of any further analysis based on the new extracted variable could be attenuated by the random error in the factor score (Russel, Reference Russel2002), Heritability estimates of the six factor scores showed that in both breeds the most heritable factor was linked to the individual body shape traits (F2), whereas the lowest the result the factor related to feet and legs traits (F5).
These results reflect findings on heritability estimates of the individual linear type traits obtained on the same breeds in two previous studies (Mazza et al., Reference Mazza, Sartori and Mantovani2014 and Reference Mazza, Sartori and Mantovani2015). Furthermore, almost the same heritability values of F1 (40% and 37% for REN and ARP, respectively) were found for the individual muscularity traits, with mean values of 30% (REN) and 24% (ARP), showing that factors well reflect the individual muscularity traits with which they are correlated. The same consideration can be carried out for F3 and F4 (udder size and conformation related factors). Mazza et al. (Reference Mazza, Sartori and Mantovani2015) reported heritability values of fore and rear udder attach and udder width in the Aosta Red Pied breed of 16%, 19% and 14% respectively (mean value of 16%), and heritability values of 9% for udder depth, 7% for suspensory ligament and 20% for teat length. Heritability estimates for factors in ARP reflect these previous results with values of 17% for F3 and 19% for F4. Furthermore, in the Rendena breed heritability estimates of factor scores are almost the same, but slightly higher than those reported for the individual type traits: 45% for F3 (mean value of 35% for individual udder size traits; Mazza et al., Reference Mazza, Sartori and Mantovani2014) and 31% for F4 (mean value of 26% for the individual udder conformation traits; Mazza et al., Reference Mazza, Sartori and Mantovani2014).
One of the main criticisms about the use of the factor analytic technique has been its vagueness, despite of its ability to remove redundant information among a set of correlated variables (Crawford and DeFries, Reference Crawford and Anderson1978; Chu and Shi, Reference Chu and Shi2002). Consequently, considering that genetic correlation in a selected population is mainly due to the pleiotropic effects of genes, that is, the involvement of the same genes in the expression of two or more traits, the factor score could become a useful method of removing redundancies among traits of interest for animal selection (Crawford and DeFries, Reference Crawford and Anderson1978). This is particularly interesting when a biological significance could be attributable to single factors on the basis of the loading coefficients of the single factorized traits (Macciotta et al., Reference Macciotta, Cecchinato, Mele and Bittante2004 and Reference Mantovani, Cerchiaro and Contiero2012).
Compared to the individual linear type traits, some latent factors obtained in this study focusing on dual purpose breeds seemed able to represent specific regions of the body of animals. Such a picture allows a relatively good representation of the latent factors, and of the use of the factor scores as an independent phenotype to be implemented in animal breeding programs for the analysed breeds.
The multivariate factor approach is a more effective alternative than the removal of highly correlated traits from genetic analysis, because it allows to retain all the information provided from different traits (included within the same factor), and produces a set of scores with the same biological meaning than the original traits, but uncorrelated each other (Morrison, Reference Morrison1976; Vukasinovic et al., Reference Vukasinovic, Moll and Künzi1997). The analysis provides indeed a set of orthogonal and therefore uncorrelated factors that become just weakly correlated after the rotation, that is generally performed to get factors a biological meaning (Sieber et al., Reference Sieber, Freeman and Hinz1987; Macciotta et al., Reference Mantovani, Cerchiaro and Contiero2012). The genetic correlations among rotated factors are typically lower than the ones existing among measured traits, and this suggests a more efficient implementation of factor scores than phenotypes in aggregate selection indexes for breeding purposes. The knowledge of the loadings for the phenotypic traits that each factor underlies allows a proper interpretation of the expected trait variation over time, because the expected response to selection is proportional to the magnitude and the sign of the loading. In animal breeding practice, factor scores may be generated also from subsets of traits (after preliminary exploratory factor analysis) when the interest for selection is due to some traits and not to other. In such a way, factor scores become the sum of all traits of interest for selection purpose (Crawford and DeFries, Reference Crawford and Anderson1978).
Furthermore, factor analysis may be used to explore genetic networks regulating complex biological systems, because it considers the common phenotypic variation among traits, and that allows purifying the genetic signal underlying traits governed by sets of common genes (Crawford and DeFries, Reference Crawford and Anderson1978; Wang et al., Reference Wang, Kammerer, Anderson, Lu and Feingold2009).
A number of recent study has applied factor analysis in estimating relationships among a number of different traits used for breeding purposes (e.g. milk composition and coagulation properties, lactation curve; Macciotta et al., Reference Macciotta, Cecchinato, Mele and Bittante2004 and Reference Mantovani, Cerchiaro and Contiero2012). Often these traits require different models, are difficult to estimate, and the reduction in factors is a effective strategy to simplify the genetic analysis (Macciotta et al., Reference Mantovani, Cerchiaro and Contiero2012).
This study indicates that for both Rendena and Aosta Red Pied dual purpose breeds the number of type traits can be easily represented by few factors without reducing levels of accuracy in describing animals’ conformation. Results from these analyses suggest a good and efficient possibility of using the latent factors in genetic evaluation, avoiding the analysis of a large number of highly correlated traits.
Acknowledgements
The authors are grateful to the Italian Breeders Association of Rendena cattle (A.N.A.Re.), Trento, Italy, and to the Italian Breeders Association of Aosta cattle (A.N.A.Bo.Ra.Va.), Aosta, Italy for providing data and for their support in this study. A special thank goes to the anonymous reviewer for the useful comments addressed at improving the manuscript.