


Introduction
Over the past several decades, there has been an increased interest in research approaches that prioritize collaboration between researchers and the individuals and communities affected by the research. These approaches, broadly referred to as community-engaged research (CEnR), encompass a continuum of methodologies that vary in the degree of community involvement, decision-making power, and research goals [Reference Wallerstein and Duran1,Reference Israel, Schulz, Parker and Becker2]. Contemporary definitions of CEnR emphasize communities as coequal partners in the research process, whose perspectives, expertise, and leadership are essential to advancing scientific inquiry, promoting health equity, and ensuring the relevance, dissemination, and sustainability of research findings [Reference Gibbons and Pérez-Stable3,Reference Wilkins, Miller, Richmond and Carrasquillo4].
Throughout this manuscript, we use the term community-focused research as an umbrella term because it reflects the language used in the Interdisciplinary Research Leaders (IRL) program and captures the broad range of approaches represented across funded projects. We recognize that terminology in the field has evolved considerably. Contemporary frameworks emphasize a continuum of community engagement ranging from consultation to shared leadership and community ownership, with Community-Based Participatory Research (CBPR) representing one of the most collaborative forms of CEnR [Reference Wilkins, Miller, Richmond and Carrasquillo4,Reference Key, Furr-Holden and Lewis5]. Accordingly, our use of community-focused research is descriptive rather than prescriptive and is intended to encompass projects spanning different positions along this continuum.
Within this continuum, CBPR emphasizes co-leadership across all phases of research, from problem identification to dissemination and social action. At the same time, CEnR includes strategies engaging community members in specific roles or stages of the research process, which remains primarily researcher-driven [Reference Israel, Schulz, Parker and Becker2]. Thus, CBPR can be classified as a subset of CEnR, situated within a broader spectrum of community engaged approaches.
Across this continuum, core principles of community-focused research include integrating community expertise and strengths into the research process. As community-focused research has developed into its own set of subdisciplines, these principles have guided the development of specific methods for community engagement, participatory processes, and power sharing. These participatory or engagement methods provide a broader framework under which a study’s data collection and analysis are conducted. Although substantial work has described methods that can be used to achieve engagement and power sharing in community-focused research, little is known about what data collection methods are used in this type of research.
For purposes of this paper, we have taken “data” to include both quantitative numeric information and qualitative findings, including stories. The types of data used or collected in community-focused research may reflect a commitment to community-focused research principles. For example, if existing data sources do not capture issues of priority to communities, primary data collection may be the only option [Reference Drawson, Toombs and Mushquash6]. In addition, existing datasets often do not capture communities’ lived experiences, local knowledge, or priorities, particularly among populations historically underrepresented in research. Collecting primary data allows researchers and community partners to generate evidence that is more relevant to community-defined needs and health equity. Further, certain types of data collection methods may be more “participatory” and/or readily implemented by community members (e.g., focus groups) than others (e.g., large-scale electronic surveys) [Reference Vaughn and Jacquez7]. Thus, although the frameworks of community-focused research are theoretically compatible with all types of data collection, it is likely that the types of data collection most frequently used in community-focused studies differ from those without a community focus.
Within the health sciences, community-engaged research has become increasingly important for improving the relevance, equity, and translation of research into practice. Traditional biomedical research has often been criticized for failing to address community priorities, underrepresenting populations disproportionately affected by health inequities, and producing interventions that are difficult to implement in real-world settings. By engaging patients, community organizations, public health practitioners, and other stakeholders as research partners, community-engaged approaches improve the relevance of research questions, facilitate recruitment and retention of historically underrepresented populations, strengthen implementation, and enhance dissemination of findings into policy and practice [Reference Gibbons and Pérez-Stable3,Reference Wilkins, Miller, Richmond and Carrasquillo4]. Despite these benefits, institutional barriers, including promotion and tenure expectations, limited funding mechanisms, longer project timelines, and insufficient training in equitable partnerships continue to challenge broader adoption of CEnR within academic health sciences. Programs such as the Robert Wood Johnson Foundation’s IRL initiative represent important opportunities to build capacity for rigorous academic-community partnerships and advance health equity.
Despite the increasing interest in community-focused research, few papers have empirically examined the data collection methods chosen by those doing community-focused research. One exception is Drawson et al., Reference Drawson, Toombs and Mushquashwho reviewed the research methods used in studies employing “indigenous research methods,” a specific type of community-focused research drawing on indigenous ways of knowing [Reference Drawson, Toombs and Mushquash6]. The authors noted, “data collection, analysis, and interpretation may vary considerably more in research approaches using an Indigenous method or framework compared to typically Western methods that are often highly standardized.” In their review, they found that researchers often used data collection methods that aligned with Indigenous storytelling traditions, including “conversational methods,” photovoice, and autoethnographies. These findings suggest both an emphasis on qualitative data collection that allows participants to direct the collection. However, the extent to which this finding would extend to a broader range of community-focused research studies is not clear.
Over the past decade, the Interdisciplinary Research Leaders (IRL) Program [Reference Leaders8], funded by the Robert Wood Johnson Foundation, has provided a platform for furthering community-focused research by supporting cohorts of research teams composed of academic researchers and community partners. This program has provided a large laboratory of community-focused research projects and offers an opportunity to understand what data collection methods are used within such projects. By assessing the methodologies used by IRL-supported projects, this paper aims to thoroughly identify and evaluate the data collection methods used in community-focused research. Information on the landscape of data collection methods in community-focused research can be used by funders to craft better mechanisms for community-focused research, by researchers to inform budgets and timelines, and by policy makers to highlight gaps in existing data infrastructure that hinder community-focused research.
Methods
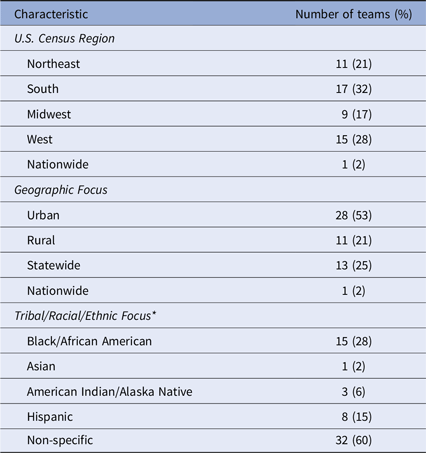
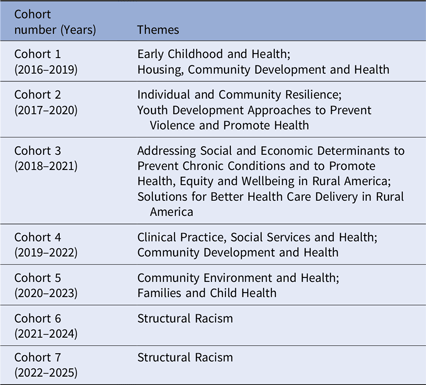
This study describes data collection methods used by the first five cohorts supported by the IRL program, a national initiative of the Robert Wood Johnson Foundation designed to cultivate community- focused research partnerships that advance health equity [Reference Leaders9]. Each cohort included 15 teams of three members, two researchers with terminal degrees or extensive applied research experience and one community leader with deep ties to a community or geographic area. Most IRL teams had at least one member from an underserved background. For the first five cohorts, 170/220 (77%) of the team members were female and 114/220 (52%) were people of color. The U.S. region, the rural or urban geographic focus, and the tribal/racial/ethnic focus of these IRL study teams are shown in Table 1. Together each team codesigned research that prioritizes community-defined needs and drives actionable solutions. The IRL program supported teams over a three-year period, providing financial support, intensive leadership development, and expert mentoring in research methods, community engagement, and policy translation. Research conducted was structured around annual selected thematic areas, such as early childhood health, community resilience, rural health systems, integration of clinical and social services, role of community environment in health, and structural racism and community health (Table 2). Cohort 1 began in 2016 and Cohort 5 in 2020. Teams were asked to submit a “final product” resulting from their research at the end of their three-year fellowship period. Information about the research methods used by IRL teams was abstracted from these final products. For IRL Cohorts 1 - 3, the final products were “research briefs:” a two- to three-page short report on the context, purpose, methods and results of their IRL research project. For Cohorts 4 and 5, teams were given a wider range of options for the format of their final product, including an opinion piece written for submission to a newspaper (an “op-ed”), or slides for a presentation to a stakeholder group.
Region, geographic focus, and tribal/racial/ethnic focus of the 53 IRL teams included in this study. U.S. regions are as defined by the U.S. Census Bureau

Table 1. Long description
The table presents the distribution of IRL teams across various characteristics. It has three main sections: U.S. Census Region, Geographic Focus, and Tribal/Racial/Ethnic Focus. Each section lists categories and the corresponding number of teams (in percentages). The U.S. Census Region section includes Northeast (11 teams, 21 percent), South (17 teams, 32 percent), Midwest (9 teams, 17 percent), West (15 teams, 28 percent), and Nationwide (1 team, 2 percent). The Geographic Focus section includes Urban (28 teams, 53 percent), Rural (11 teams, 21 percent), Statewide (13 teams, 25 percent), and Nationwide (1 team, 2 percent). The Tribal/Racial/Ethnic Focus section includes Black/African American (15 teams, 28 percent), Asian (1 team, 2 percent), American Indian/Alaska Native (3 teams, 6 percent), Hispanic (8 teams, 15 percent), and Non-specific (32 teams, 60 percent).
* Percents do not sum to 100% since some study teams focused on more than one tribal/racial/ethnic group.
IRL cohort themes

Table 2. Long description
A table with 7 rows and 2 columns. The columns are labeled ‘Cohort number (Years)’ and ‘Themes’. Row 1: Cohort 1 (2016-2019), Early Childhood and Health; Housing, Community Development and Health. Row 2: Cohort 2 (2017-2020), Individual and Community Resilience; Youth Development Approaches to Prevent Violence and Promote Health. Row 3: Cohort 3 (2018-2021), Addressing Social and Economic Determinants to Prevent Chronic Conditions and to Promote Health, Equity and Wellbeing in Rural America; Solutions for Better Health Care Delivery in Rural America. Row 4: Cohort 4 (2019-2022), Clinical Practice, Social Services and Health; Community Development and Health. Row 5: Cohort 5 (2020-2023), Community Environment and Health; Families and Child Health. Row 6: Cohort 6 (2021-2024), Structural Racism. Row 7: Cohort 7 (2022-2025), Structural Racism.
All final products that contained information on research methods were included in the analysis. For Cohorts 1-3, all final products were research briefs and contained sufficient information for abstraction. For IRL Cohort 1 (2016–2019) 12 of the 15 teams submitted a final product. For Cohort 2 (2017-2020) only seven of the 15 teams were able to submit a final product, likely due to the disruptive impact of the pandemic in the final months of their fellowship. For Cohort 3 (2018–2021) 10 of the 15 teams submitted a final product. For Cohort 4 (2019–2022) 13 of the 15 teams submitted a final product, including 5 research briefs, 2 full reports, 5 presentations, and one op-ed; the op-ed did not contain any information about the research methods the team used and was thus excluded. For Cohort 5 (2020–2023) 13 of the 15 teams submitted a final product, including 3 research briefs, 1 policy brief, 6 presentations, and 3 op-eds. The policy brief was excluded from analysis since it did not contain any information about the research methods the team used. For the 75 teams in all five cohorts, a total of 53 final products (70%) were available for analysis.
Methods described in the final products were first categorized as involving primary data vs. secondary data. For primary data collection, methods were then categorized as qualitative and/or quantitative and the specific method used was noted. Qualitative data collection methods included focus groups, interviews, field notes from observers, photovoice, and surveys with primarily open-ended questions. Quantitative data collection methods included surveys with closed-ended questions, review of electronic medical record (EMR) data, and environmental sampling.
For secondary data, methods were categorized according to the source of the data rather than by whether the data were primarily qualitative or quantitative. The data sources were first divided into five categories, determined a priori:
-
Government data. This category includes government administrative data (e.g. arrests, crime rates, emergency room use, land ownership, budgets, contracts, audits), government policies, and government-supported survey or census data
-
Legislative data such as enacted laws
-
Judicial data such as court opinions or rates of juvenile referrals
-
News reports in any medium
-
Other sources such as service providers or non-government organizations (NGOs)
Government data was then further categorized according to the level of government: federal, state, county, or local (city, township, school district).
The extracted information was stored in a REDCap database [Reference Harris, Taylor, Thielke, Payne, Gonzalez and Conde10] and tabulated using R statistical software [Reference R Core11], version 4.3.0.
Results
Primary vs. secondary data
Table 3 shows the distribution of teams across the five cohorts based on their use of primary data, secondary data, or both. The majority (74%) of teams collected and used only primary data, while a very small proportion (6%) relied exclusively on secondary data sources. The remaining 21% used both primary and secondary data. The heavy reliance on primary data collection remained consistent over time. The first cohort was more likely than the other cohorts to use both data types (4 of 12 used both primary and secondary data), while Cohort 3 had no teams that used both sources. These findings suggest that across all cohorts, primary data collection was the dominant approach, while reliance on secondary data alone was minimal. The use of both primary and secondary data was moderately common.
Primary vs secondary data

Table 3. Long description
The table shows the distribution of teams across five cohorts based on their use of primary data, secondary data, or both. It has six rows and seven columns, including a total row. The columns are labeled Cohort 1, Cohort 2, Cohort 3, Cohort 4, Cohort 5, and Total. The rows are labeled Primary data only, Secondary data only, Both, and Total products available. Row 1: Primary data only, Cohort 1: 7, Cohort 2: 5, Cohort 3: 9, Cohort 4: 10, Cohort 5: 8, Total: 39 (74 percent). Row 2: Secondary data only, Cohort 1: 1, Cohort 2: 0, Cohort 3: 1, Cohort 4: 0, Cohort 5: 1, Total: 3 (6 percent). Row 3: Both, Cohort 1: 4, Cohort 2: 2, Cohort 3: 0, Cohort 4: 2, Cohort 5: 3, Total: 11 (21 percent). Row 4: Total products available, Cohort 1: 12, Cohort 2: 7, Cohort 3: 10, Cohort 4: 12, Cohort 5: 12, Total: 53.
Primary data collection methods
Among the 50 teams that conducted primary data collection, 19 teams (38%) collected only qualitative data, while an additional 22 (44%) collected both quantitative and qualitative data (Table 4). The proportion of teams collecting only quantitative data was relatively low across all cohorts (18%), with Cohort 5 having the highest count (4 teams), and Cohort 1 having none. The preference for qualitative data was fairly consistent over cohorts, although there was some variation with more teams from Cohort 2 (6/7) including quantitative data than other cohorts. The majority of teams (82%) incorporated qualitative methods, either alone or in combination with quantitative methods, highlighting the value of rich, descriptive data for these teams. Overall, these findings indicate a strong preference for qualitative or both qualitative and quantitative approaches among teams conducting primary data collection.
Qualitative vs. quantitative methods among the teams (N = 50) who carried out any primary data collection

Table 4. Long description
A table comparing qualitative and quantitative methods among teams conducting primary data collection across five cohorts. The table has 5 columns and 4 rows. Column headers are Cohort 1, Cohort 2, Cohort 3, Cohort 4, Cohort 5, and Total. Row labels are Qualitative only, Quantitative only, Both, and Total teams using primary data. Row 1: Qualitative only, Cohort 1: 6, Cohort 2: 1, Cohort 3: 4, Cohort 4: 3, Cohort 5: 5, Total: 19 (38 percent). Row 2: Quantitative only, Cohort 1: 0, Cohort 2: 3, Cohort 3: 1, Cohort 4: 1, Cohort 5: 4, Total: 9 (18 percent). Row 3: Both, Cohort 1: 5, Cohort 2: 3, Cohort 3: 4, Cohort 4: 8, Cohort 5: 2, Total: 22 (44 percent). Row 4: Total teams using primary data, Cohort 1: 11, Cohort 2: 7, Cohort 3: 9, Cohort 4: 12, Cohort 5: 11, Total: 50.
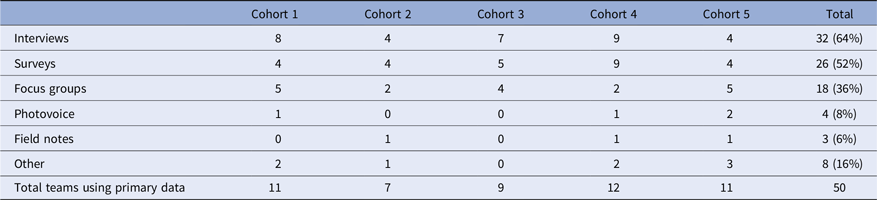
For the 50 teams that conducted primary data collection, the most common methods used were interviews, surveys, and focus groups, in that order (Table 5). Nearly two-thirds of the teams used interviews (32 teams, 64%). Over half of the teams used surveys, with Cohort 4 having the highest overall usage (9 teams). Over one-third used focus groups, with Cohort 1 and Cohort 5 having the highest numbers (5 teams each). Photovoice, a research method that combines photography and storytelling, was used by only four teams (8%). Field notes, in the form of notes from outside observers about intervention program sessions or notes from participants about community organization or public government meetings, were rarely used (6%), possibly due to their supplementary nature rather than being a primary data collection tool. Eight teams (16%) used other data collection methods, including extracting data from EMR, environmental sampling of air, water or soil, quantitative analysis of state regulations, and walkability mapping. The distribution of data collection methods does not show any obvious trends over time.
Primary data collection methods among the teams (N = 50) who carried out primary data collection. Most teams used more than one method, so the percentages do not add up to 100%

Table 5. Long description
The table presents the distribution of primary data collection methods used by 50 teams across five cohorts. The methods include interviews, surveys, focus groups, photovoice, field notes, and other methods. The table has six rows for the data collection methods and six columns for the cohorts plus a total column. Row 1: Interviews, Cohort 1: 8, Cohort 2: 4, Cohort 3: 7, Cohort 4: 9, Cohort 5: 4, Total: 32 (64%). Row 2: Surveys, Cohort 1: 4, Cohort 2: 4, Cohort 3: 5, Cohort 4: 9, Cohort 5: 4, Total: 26 (52%). Row 3: Focus groups, Cohort 1: 5, Cohort 2: 2, Cohort 3: 4, Cohort 4: 2, Cohort 5: 5, Total: 18 (36%). Row 4: Photovoice, Cohort 1: 1, Cohort 2: 0, Cohort 3: 0, Cohort 4: 1, Cohort 5: 2, Total: 4 (8%). Row 5: Field notes, Cohort 1: 0, Cohort 2: 1, Cohort 3: 0, Cohort 4: 1, Cohort 5: 1, Total: 3 (6%). Row 6: Other, Cohort 1: 2, Cohort 2: 1, Cohort 3: 0, Cohort 4: 2, Cohort 5: 3, Total: 8 (16%). The total number of teams using each method is also provided.
Secondary data sources
The majority of teams who used secondary data either alone or in combination with primary data relied heavily on government data from federal, state, county, or local administrative records (79% or 11 of 14 teams); the distribution across these levels is described in greater detail below. Cohorts 1 and 5 had the highest number of teams using government data (5 and 4 respectively) (Table 6). Two teams used judicial data: one used administrative court data on rates of juvenile referrals and the other used state court and US Supreme Court opinions. Two teams used print, radio and/or TV news reporting related to prison conditions in one case and to environmental pollution in the other. No teams used legislative data. Six teams obtained data from other sources such as local service providers, local advocacy organizations, local or national analytics organizations (such as Greenlink Equity Map), and letters from incarcerated people. Cohort 1 had the highest number of teams relying on “other” sources (3 teams), while Cohorts 3 and 5 did not use any.
Secondary data sources among the teams (N = 14) who carried out any secondary data collection

Table 6. Long description
A table showing secondary data sources among 14 teams. The table has 6 rows and 6 columns. The columns are labeled as Cohort 1, Cohort 2, Cohort 3, Cohort 4, Cohort 5, and Total. The rows are labeled as Government data, Legislative data, Judicial data, News reports, Other sources, and Total teams using secondary data. Row 1: Government data, Cohort 1: 5, Cohort 2: 0, Cohort 3: 1, Cohort 4: 1, Cohort 5: 4, Total: 11 (79 percent). Row 2: Legislative data, Cohort 1: 0, Cohort 2: 0, Cohort 3: 0, Cohort 4: 0, Cohort 5: 0, Total: 0 (0 percent). Row 3: Judicial data, Cohort 1: 0, Cohort 2: 1, Cohort 3: 0, Cohort 4: 1, Cohort 5: 0, Total: 2 (14 percent). Row 4: News reports, Cohort 1: 0, Cohort 2: 0, Cohort 3: 0, Cohort 4: 1, Cohort 5: 1, Total: 2 (14 percent). Row 5: Other sources, Cohort 1: 3, Cohort 2: 1, Cohort 3: 0, Cohort 4: 2, Cohort 5: 0, Total: 6 (43 percent). Row 6: Total teams using secondary data, Cohort 1: 5, Cohort 2: 2, Cohort 3: 1, Cohort 4: 2, Cohort 5: 4, Total: 14.
For the subset of teams using government data, more than half of the teams (6 out of 11) used federal data, making this the most commonly utilized level of governmental data. The most common federal data used was census data (decennial census or American Community Survey), used by 4 of the 6 teams; other federal data included health data from the National Center for Health Statistics, pollution data from the Environmental Protection Agency, and childcare data from the AI/AN Family and Childhood Experiences Survey (AI/AN FACES) from the Department of Health and Human Services. Cohort 5 had the highest usage of federal data (3 teams), while Cohorts 2 and 4 did not use any federal data (Table 7). Nearly half of the teams relied on state-level data. A small proportion of teams (3 out of 11) accessed county-level data. Teams from Cohorts 1, 3, and 5 utilized county data, while Cohort 2 and 4 did not. City-level administrative data was the least utilized, with only one team (from Cohort 1) incorporating this source. Cohort 1 had the highest diversity of sources, utilizing federal, state, county, and city data. Overall, Table 7 highlights the varying reliance on different levels of government data across teams, with a clear preference for federal and state sources.
Sources of government data among the teams (N = 11) who used it. Some teams used more than one source, so the percentages do not add up to 100%

Table 7. Long description
The table shows the usage of federal, state, county, and local government data across five cohorts of teams. It has six rows and seven columns, including a total column. The rows are labeled Federal, State, County, Local, and Total teams using government data. The columns are labeled Cohort 1, Cohort 2, Cohort 3, Cohort 4, Cohort 5, and Total. Row 1: Federal, Cohort 1: 2, Cohort 2: 0, Cohort 3: 1, Cohort 4: 0, Cohort 5: 3, Total: 6 (55 percent). Row 2: State, Cohort 1: 2, Cohort 2: 0, Cohort 3: 1, Cohort 4: 1, Cohort 5: 1, Total: 5 (45 percent). Row 3: County, Cohort 1: 1, Cohort 2: 0, Cohort 3: 1, Cohort 4: 0, Cohort 5: 1, Total: 3 (27 percent). Row 4: Local, Cohort 1: 1, Cohort 2: 0, Cohort 3: 0, Cohort 4: 0, Cohort 5: 0, Total: 1 (9 percent). Row 5: Total teams using government data, Cohort 1: 5, Cohort 2: 0, Cohort 3: 1, Cohort 4: 1, Cohort 5: 4, Total: 11. The table highlights the varying reliance on different levels of government data across teams, with a clear preference for federal and state sources.
Discussion
The aim of this study was to comprehensively assess community-focused researchers’ choice of data in projects conducted under the Robert Wood Johnson Foundation IRL program. We specifically assessed whether projects used existing data or collected their own data, and, if they collected data, the methods used to do so.
Our findings indicate a very strong preference for primary data collection (74%) and particularly qualitative data collection methods (either alone (38%) or in combination with quantitative data (44%)) in these community-focused research projects. The use of primary over secondary data in our cohorts may reflect a lack of existing data relevant to the research questions of interest to community-focused researchers. Drawson et al. [Reference Drawson, Toombs and Mushquash6] observe that traditional research that lacked community involvement “…resulted in data that were unusable by communities.” The IRL teams doing primary data collection did not specify in their final products why they chose this approach over secondary data, but it is possible that existing data were not available on the specific communities of interest, at the level of geography needed, or failed to capture domains of interest to communities. In addition, existing research and data on marginalized communities may have relied on a deficit framework that fails to capture community strengths. Primary data collection therefore provides an opportunity to generate more equitable and locally relevant evidence. It is also possible that the choice to collect data was motivated by the opportunity data collection provides for additional community participation. Vaughn et al. [Reference Drawson, Toombs and Mushquash6] note that each step in the research process offers a “choice-point” for the level of community participation. They define levels of participation intensity ranging from informing (academic researchers provide information on the study to the community) to collaborating (community members partner to conduct the research) to empowering (community members lead the research). Data collection is a crucial decision in community-focused research. The choice of primary data collection may reflect a desire for deeper community participation and collaboration in data collection and decision-making. This approach, as opposed to using existing data, which can limit community engagement, highlights the need for change and innovation in the research process. [Reference Minkler and Wallerstein12]
The preference for qualitative data in the IRL cohorts is also notable and in contrast to estimates of the proportion observed in health research papers overall. For example, one review of the literature from 2011 reported that between 0 and 0.6% of research articles in general medical journals used qualitative methods only, while for health services and policy research, this range was 0% and 6.4%. [Reference Gagliardi and Dobrow13] Another study found that 9% of health services and management research studies between 1999 and 2008 included a qualitative component with or without quantitative methods. [Reference Weiner, Amick, Lund, Lee and Hoff14] A recent review of qualitative work across disciplines indicated that qualitative research has become more common over recent decades, but remained the minority in health-related research (e.g., < 12% nursing and < 4% in medicine). [Reference Thelwall and Nevill15] Thus, our findings suggest that qualitative data collection may be particularly well-suited to community-focused research. As noted by Vaughn et al., [Reference Vaughn and Jacquez7] regarding participatory research approaches, “decisions must be made about which tools and methods will produce the desired level of participation.” Our findings suggest that teams prioritized capturing community voices and contextual understanding, consistent with community- focused research principles and other participatory approaches that prioritize lived experiences. The choice of qualitative methods may have also arisen out of the relatively limited funds and short timeframe available to IRL cohorts. Significant time and money is required to coordinate complex or large-scale quantitative or mixed-method studies. Cohorts may have chosen smaller-scale qualitative data collection projects to better fit within the parameters of the funding model.
Strengths of our study include the ability to track data choices in well-defined cohorts of community-focused research teams. The emphasis of the IRL program on community engagement meant that these teams had a community-focused emphasis from their initiation, with research teams required to have one community partner as a co-leader, allowing us to identify data collection choices that grew out of that focus. By following cohorts of teams in this program, we were also able to track trends over time.
The preference for primary, qualitative data collection in community-focused research is important information for funders. Those developing grant mechanisms designed to support community-focused research should recognize that many applicants will wish to collect data, requiring significant time and staff. Given the difficulty of securing grant support for qualitative work, funders should consider explicitly targeting funds for qualitative studies. The findings here can also inform researchers planning community-focused research projects, who should be aware that many researchers in their position choose primary, qualitative data collection as the optimal approach. Researchers should plan for the time- and resource-intensive nature of this type of data collection. Finally, reliance on newly collected data may reflect failures of existing data infrastructure, which should prompt discussion of how to improve surveillance and administrative data for community-focused research.
From a translational science perspective, our findings reinforce the growing recognition that community-engaged research is critical for bridging the gap between scientific discovery and real-world implementation. Although clinical and administrative datasets remain invaluable for many research questions, they often lack the contextual information needed to understand barriers, facilitators, and community priorities that influence the uptake and sustainability of interventions. The widespread use of primary qualitative data among IRL teams highlights the importance of incorporating community knowledge alongside traditional health data. Expanding institutional support for community-engaged methods, including training in qualitative and mixed methods, partnership development, and equitable engagement practices may strengthen the translation of research into interventions and policies that are both effective and responsive to community needs.
Limitations of our study include potential lack of generalizability, as all research was part of one program. In particular, the mix of data approaches used by IRL teams may have been influenced by the themes for their cohort. Likewise, the explicitly interdisciplinary nature of the program may have increased the number of researchers from fields outside of traditional health research where methods such as qualitative data collection are more common. Second, missing data is a limitation as some research teams did not provide final products, or their final products did not include a sufficient description of their research methods. It is possible that certain types of research methods may have been more common in projects that were missing a final product. For example, it is plausible that some missing final products arose from challenges common with primary data collection, which would result in an underestimate of preference for primary data collection. Finally, we do not have comprehensive information on these teams’ rationale for their choice of data.
In summary, our analysis of this sample of community-focused research projects indicates a strong reliance on primary, qualitative data collection. It will be important to ascertain whether this reliance fully reflects researcher preference or is instead a result of constraints (e.g., no relevant existing data, or difficulties acquiring existing data). Although there are many benefits to primary data collection, it is time and resource intensive. Building repositories of data relevant and accessible to community-focused researchers could be an important effort in building capacity and impact. Even with such efforts, however, it seems likely that community-focused researchers will continue to use primary data collection; thus, it will also be important to build out primary qualitative data collection training and infrastructure to ensure there is capacity to do timely work. Next steps in this research should therefore be to understand the reasons behind data choices and to identify barriers to the use of existing data as well as challenges to data collection that could be addressed
Author contributions
Ann M. Brearley: Conceptualization, Data curation, Formal analysis, Methodology, Writing - original draft, Writing - review & editing; Drissa M. Toure: Conceptualization, Methodology, Writing - original draft, Writing - review & editing; Ifrah M. Biyoow: Data curation, Writing - review & editing; Inari S. Mohammed: Data curation, Writing - review & editing; Susan M. Mason: Conceptualization, Methodology, Writing - original draft, Writing - review & editing.
Funding statement
This work was supported by the Robert Wood Johnson Foundation’s Interdisciplinary Research Leaders Program (all co-authors, grant number 81124); and by the NIH National Center for Advancing Translational Sciences (AB, grant number UL1TR002494). The content is solely the responsibility of the authors and does not necessarily represent the official views of the NIH.
Competing interests
There are no conflicts of interest to report.





 Open access

