Introduction
Studying language development by observing children and adults in naturalistic contexts harkens back to the earliest diary studies when parents painstakingly documented by hand the productions of their own children (Darwin, Reference Darwin1877; Leopold, Reference Leopold1949). In modern times, several prominent diary studies using basically the same methods provided remarkably detailed pictures of a child's language development over time (e.g., Dromi, Reference Dromi1987; Mervis, Mervis, Johnson & Bertrand, Reference Mervis, Mervis, Johnson and Bertrand1992). With the advent of audio- and, subsequently, video-recording technology, the process was greatly facilitated, offering a relatively permanent record of the language that was produced, rather than relying on fleeting memories and distilled notes. Such technological advances also propelled the method into the mainstream. The first classic longitudinal study of Adam, Eve and Sarah by Roger Brown (Brown, Reference Brown1973), and later studies which included larger and more diverse samples (Hart & Risley, Reference Hart and Risley1995; Pan, Rowe, Singer & Snow, Reference Pan, Rowe, Singer and Snow2005), are examples of how naturalistic observation is a source of rich information regarding what children say and what they hear from caregivers.
Today, naturalistic observation continues to be a mainstay of researchers’ toolkits applied in both smaller- (e.g., Bornstein, Tamis-LeMonda, Hahn & Haynes, Reference Bornstein, Tamis-LeMonda, Hahn and Haynes2008) and larger-scale studies (e.g., NICHD Early Child Care Research Network, 1997). Typically, a caregiver and a child play together for a short time (e.g., 5–20 minutes) in a home or laboratory setting with toys or books. This method is appropriate for young children, since they need not comply with instructions or generate responses on cue. Moreover, naturalistic observation may be a useful way of assessing the language skills of children from diverse backgrounds, especially when involving a caregiver or other familiar adult (Craig & Washington, Reference Craig and Washington2000), and may be especially useful in languages where standardized tests are not available. In sum, naturalistic observation offers a window into what children and their caregivers do in unstructured, child-friendly contexts. These activities provide language acquisition researchers with information about what words or sentences a child produces, how a child responds to the language of others, and the frequency and nature of the language a child hears from their caregiver.
However, analyses of language samples typically involve transcription of the audio- or video-recordings, a process that requires substantial time, money, effort, and expertise. Several measures of adult or child speech can be derived, but one frequently used measure is a count of the words produced, i.e., tokens. For measures of the caregiver, number of word tokens tends to be highly correlated with other features of caregiver speech, such as word types or MLU (Hurtado, Marchman & Fernald, Reference Hurtado, Marchman and Fernald2008), and with child outcomes, especially in children at younger ages (Rowe, Reference Rowe2012). Number of recognizable child words or vocalizations may reflect a child's developmental level, particularly at younger ages, as well as the extent to which they are engaged in communicative interaction: for example, by measuring the frequency of bids for attention or responses to a communicative partner.
Recent advances in speech recognition technology make it possible to obtain counts of adult words and child vocalizations using automated methods that do not require transcription. The primary use-case for this technology is day-long recordings conducted over multiple hours in, for example, a child's home (Greenwood, Thiemann-Bourque, Walker, D., Buzhardt & Gilkerson, Reference Greenwood, Thiemann-Bourque, Walker, Buzhardt and Gilkerson2011), capturing interactions in contexts that are not typically accessible by researchers. In this brief report, we assess the validity of one such automated speech analysis system, Language ENvironment Analysis (LENATM) (Richards, Gilkerson, Paul & Xu, Reference Richards, Gilkerson, Paul and Xu2008), when used in the shorter and more constrained context of a laboratory play session. We compared LENA's automatically-generated counts to those of transcribers based on 20-minute play sessions with Spanish-speaking caregivers and their children at 1;7 and 2;2.
What is LENA?
LENA is an audio-recording and automated speech recognition technology that captures up to 16-hours of the first-person soundscape of a child's naturalistic life without an experimenter needing to be present. The LENA system consists of: (1) a Digital Language Processor (DLP) which records the audio environment, (2) software which is used to process, store, and analyze LENA data, and (3) specialized clothing that holds the device in the correct position on the child (see VanDam (Reference VanDam2014) for evidence that the acoustic characteristics of the speech recorded by LENA are the same with clothing produced by the LENA foundation as with other clothing).
LENA uses machine learning algorithms, trained on a large corpus of recordings from English-speaking families, to segment and categorize the audio into sound types (e.g., speech, noise, electronic media) and to compute automatic counts of adult words (AWC), child vocalizations (CVC), and conversational turns (CTC) (Xu, Yapanel & Gray, Reference Xu, Yapanel and Gray2009). The system also allows downloading of the audio-recording enabling further analyses (e.g., Ramírez-Esparza, Garcia-Sierra & Kuhl, Reference Ramírez-Esparza, Garcia-Sierra and Kuhl2014; Weisleder & Fernald, Reference Weisleder and Fernald2013). In many ways, LENA has revolutionized the field by providing a novel method for obtaining quick, easy, and broad access to the language use and learning environments of young children from different populations at home, at school, and out in the world (Bergelson, Casillas, Soderstrom, Seidl, Warlaumont & Amatuni, Reference Bergelson, Casillas, Soderstrom, Seidl, Warlaumont and Amatuni2019; D'Apice, Latham & von Stumm, Reference D'Apice, Latham and von Stumm2019; Ganek & Eriks-Brophy, Reference Ganek and Eriks-Brophy2018; Greenwood, Schnitz, Irvin, Tsai & Carta, Reference Greenwood, Schnitz, Irvin, Tsai and Carta2018; Soderstrom & Wittebolle, Reference Soderstrom and Wittebolle2013; Wang, Hartman, Aziz, Arora, Shi & Tunison, Reference Wang, Hartman, Aziz, Arora, Shi and Tunison2017; Woodard, Losievski, Arjmandi, Lehet, Wang, Houston & Dilley, Reference Woodard, Losievski, Arjmandi, Lehet, Wang, Houston and Dilley2019).
Based on 70 1-hour long samples from English-speaking children 0;2 to 3;0, a LENA Foundation study (Xu et al., Reference Xu, Yapanel and Gray2009) states that the correlation between transcriber word counts and LENA-generated AWCs was strong (r = .92). Absolute differences were about 2%. Correlations between LENA and transcriber adult word counts were substantially lower in samples recorded in noisy environments (e.g., day care) and varied depending on recording length, with error rates dropping dramatically in recordings longer than 1 hour and plateauing after 4 hours. This latter finding led to the recommendation that recording lengths should be at least 1 hour (Xu et al., Reference Xu, Yapanel and Gray2009). Accuracy for CVC was weaker (75%). A recent independent evaluation of CVC with children with hearing loss indicated poor accuracy in the identification of child vocalizations and recommends caution (Woodard et al., Reference Woodard, Losievski, Arjmandi, Lehet, Wang, Houston and Dilley2019). Another independent evaluation also reports weak results, yet nevertheless concluded that reliability levels for both AWC and CVC are acceptable for certain uses (Cristia, Lavechin, Scaff, Soderstrom, Rowland, Rasanen, Bunce & Bergelson, Reference Cristia, Lavechin, Scaff, Soderstrom, Rowland, Rasanen, Bunce and Bergelson2019). Validations in non-English languages report overall mixed results (Busch, Sangen, Vanpoucke & van Wieringen, Reference Busch, Sangen, Vanpoucke and van Wieringen2018; Canault, Le Normand, Foudil, Loundon & Thai-Van, Reference Canault, Le Normand, Foudil, Loundon and Thai-Van2016; Gilkerson, Richards, Warren, Montgomery, Greenwood, Oller, Hansen & Paul, Reference Gilkerson, Richards, Warren, Montgomery, Greenwood, Oller, Hansen and Paul2017; Pae, Yoon, Seol, Gilkerson, Richards, Ma & Topping, Reference Pae, Yoon, Seol, Gilkerson, Richards, Ma and Topping2016; Weisleder & Fernald, Reference Weisleder and Fernald2013). While increasingly popular (Ganek, Smyth, Nixon & Eriks-Brophy, Reference Ganek, Smyth, Nixon and Eriks-Brophy2018; Gilkerson, Richards, Warren, Oller, Russo & Vohr, Reference Gilkerson, Richards, Warren, Oller, Russo and Vohr2018; Romeo, Leonard, Robinson, West, Mackey, Rowe & Gabrieli, Reference Romeo, Leonard, Robinson, West, Mackey, Rowe and Gabrieli2018; Romeo, Segaran, Leonard, Robinson, West, Mackey, Yendiki, Rowe & Gabrieli, Reference Romeo, Segaran, Leonard, Robinson, West, Mackey, Yendiki, Rowe and Gabrieli2018), the validity of turn counts, or CTC, in day-long contexts has been more difficult to establish (Cristia, Bulgarelli & Bergelson, Reference Cristia, Bulgarelli and Bergelson2020).
Use of LENA in laboratory settings
In this study, we explored the extent to which LENA provides accurate estimates of adult word counts (AWC) and child vocalizations (CVC) during laboratory play sessions. In an earlier test of this idea, Oetting and colleagues (Oetting, Hartfield & Pruitt, Reference Oetting, Hartfield and Pruitt2009) took existing play session audio-recordings (n = 17), played them to a LENA recorder on two occasions, and then compared LENA counts with those from transcripts. Correlations for adult word counts were strong (rs = .71 and .85), leading the authors to suggest, with some cautionary notes, that LENA had potential for use in this context. Absolute estimates of word counts were also comparable across transcriber vs. LENA. In spite of these promising findings, the practice of generating LENA word counts via existing recordings was not endorsed by the LENA Foundation because the “acoustic features of a recorded audio signal are markedly different from those of one recorded directly in a live environment” (Xu et al., Reference Xu, Yapanel and Gray2009, p. 3).
Here, we examine the validity of AWC and CVC in lab settings by collecting recordings in situ and following procedures recommended by the LENA Research Foundation (e.g., using the specialized clothing). Our goal is to compare LENA's automated counts to transcriber counts both with correlations and estimates of absolute levels. We anticipated that accuracy would be higher in this context than in day-long recordings because our recordings were conducted in a constrained laboratory setting which is quieter and less complex (e.g., a single caregiver-child dyad) than a typical home environment. On the other hand, our recordings are much shorter than the 1 hour recommended by the LENA Foundation (Xu et al., Reference Xu, Yapanel and Gray2009), and our sample consists of Spanish-speaking caregivers and their children, which could negatively impact accuracy. We did not evaluate CTC since timing information was not available in our transcripts and the validity of CTC in day-long contexts is less well-established than the other measures (Cristia et al., Reference Cristia, Bulgarelli and Bergelson2020).
Method
Participants
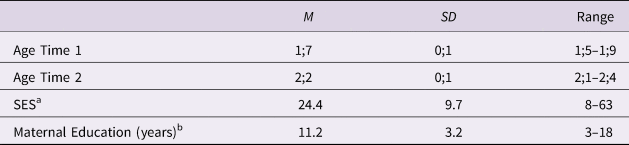
Participants were primarily-Spanish-speaking caregivers and their children (n = 108, 46 males; 62 females) who participated when the children were 1;7 and 2;2. All caregivers were native Spanish speakers and children were reported to hear >70% Spanish from caregivers. The majority of caregivers were born in Mexico (95, 87.2%); however, 7.3% (8) were born in Central America, 2.8% (3) in the US, and 0.9% (1) in South America. A total of 23.1% (25) of the children were first born and 37.0% (40) were second born. As shown in Table 1, the participants were from families in which mean maternal education was less than high school, on average, although there was some range. Scores on an updated version of the Hollingshead Index (Hollingshead, Reference Hollingshead1975) indicated that these families were generally from lower socioeconomic status (SES) backgrounds. Data for 10 sessions were excluded (4 sessions at 1;7; 6 sessions at 2;2) because it was later identified that the DLP malfunctioned (4 sessions), the child took off/refused to wear the LENA clothing (4 sessions), or the session was aborted with < 10 minutes of recording (2 sessions). The current analyses are based on n = 104 dyads at 1;7 and n = 102 at 2;2. A total of 98 dyads had usable data at both time points.
Demographics of original sample (n = 108)

a Socioeconomic status (SES) as measured by the Hollingshead Four-Factor Index, a composite score based on both parents’ education and occupation (Hollingshead, Reference Hollingshead1975)
b Highest level of education achieved. primaria: 0–6 years, secundaria: 7–9 years, preparatoria: 10–12 years, universidad: 13–18 years.
Procedure
The sessions were conducted in a quiet, kid-friendly playroom closed off from high-noise/traffic areas, involving a single caregiver, typically the mother, and the target child. The caregiver was asked to “play with your child as you would at home” for about 20 minutes. Mean length of session was 22.7 minutes (range = 13.4–25.0) at 1;7 and 23.0 minutes (range = 17.1–25.0) at 2;2. (A minimum of 10 minutes is needed for the LENA software to process a recording. For sessions < 10 minutes, adding an additional recording in silence on a different date to the same DLP allows the recording to be processed without contaminating the counts.)
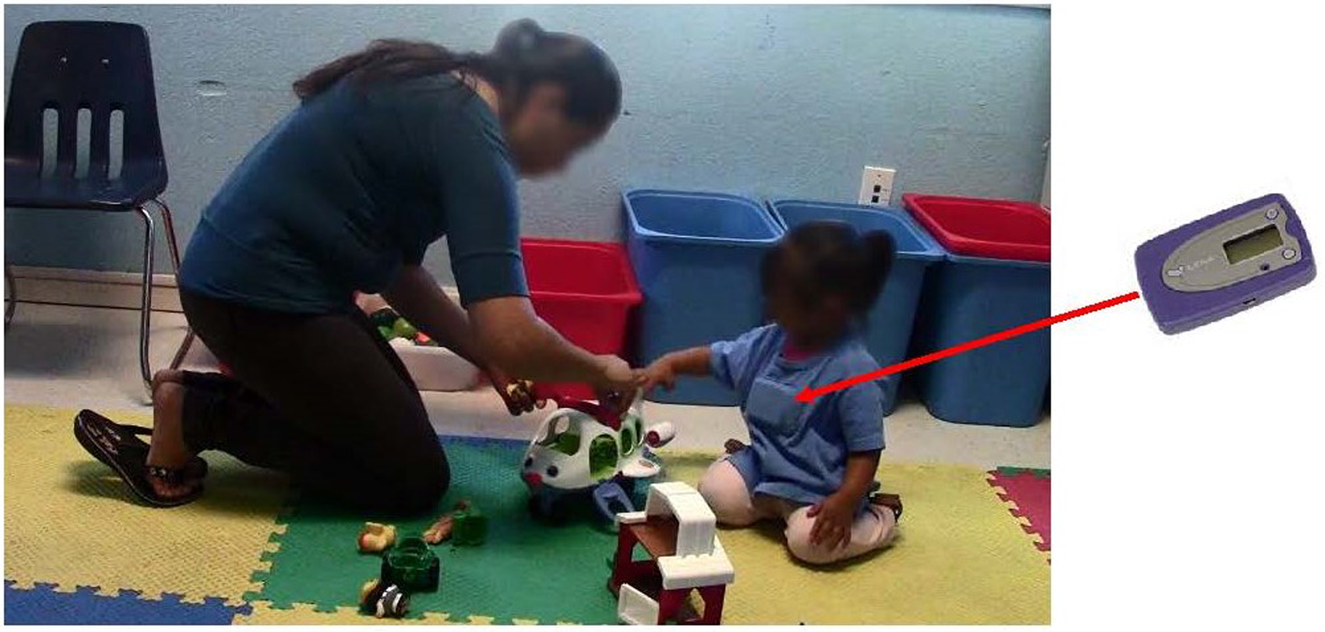
At each time point, the dyad was provided with a standard set of toys designed to elicit communication and pretend play (Fisher Price airplane, school bus, and people; farm house and animals; toy pans, plates, fruit and utensils; stuffed animal and a doll), and an age-appropriate children's book. We intentionally did not provide toys that made noise (e.g., electronic toys) so as to facilitate transcription. Sessions were videotaped and audio-recorded with the LENA DLP worn in the front pocket of the specialized clothing (Figure 1). The experimenter turned on the DLP just as they left the room. In some cases, talk by the experimenter to the caregiver or child and/or talk by the caregiver to the experimenter was captured by the recording.
Illustration of laboratory set-up with child wearing LENA DLP in specially made clothing purchased from the LENA Research Foundation.

Measures
Automated measures of caregiver and child talk
The following measures were generated by the LENA software for each 5 minute segment: (a) Adult Word Count (AWC): number of adult words spoken “near and clear” to the child, excluding overlapping speech or sounds, and (b) Child Vocalization Count (CVC): number of speech-like vocalizations by the target child, including words, babbling, and pre-speech communicative sounds or “protophones,” such as squeals, growls, or raspberries, but excluding crying, whining, and vegetative sounds (e.g., breathing, burping). CVC captures the number of continuous strings of speech-like vocalizations of any length that occur between pauses of approximately 300 ms. Thus, CVC captures both intelligible child words as well as child productions that a transcriber would not identify as words. Trained listeners cleaned the recordings using both video and audio information, noting when the child was not wearing the DLP, the recording quality was poor, or the child was crying throughout the session.
Transcription and data reduction
All adult words were orthographically transcribed following Child Language Data Exchange System conventions (CHILDES; MacWhinney, Reference MacWhinney2000). All intelligible words produced by the child were transcribed orthographically. All unintelligible child vocalizations produced as part of or as complete utterances were indicated using xxx, per standard conventions. After initial transcription, all transcripts were checked for accuracy by trained research assistants. All discrepancies were resolved based on mutual agreement after discussion. Each transcript was analyzed using FREQ in CLAN. Total Adult Words was the sum of all word tokens spoken by all adults: typically, maternal caregiver and experimenter. In order to most closely approximate CVC counts, we computed Total Child Vocalizations as the sum of all intelligible words and unintelligible vocalizations produced by the target child. A more conservative measure was Intelligible Child Words, the sum of all intelligible word tokens, excluding unintelligible vocalizations. Time stamp information was not included in our transcripts precluding analyses of conversational turns.
Statistical analysis
We first present descriptives, providing mean (M), standard deviation (SD), and range for both LENA and transcriber counts. We then present Pearson correlations between LENA and transcriber across participants and across time. To compare absolute counts, paired-sample t-tests are conducted. Following Ziaei, Sangwan and Hansen (Reference Ziaei, Sangwan and Hansen2016), we also computed Word Count error (WCerr) for Total Adult Words, Total Child Vocalizations, and Intelligible Child Words (see also Räsänen, Seshadri, Karadayi, Riebling, Bunce, Cristia, Metze, Casillas, Rosemberg, Bergelson & Soderstrom, Reference Räsänen, Seshadri, Karadayi, Riebling, Bunce, Cristia, Metze, Casillas, Rosemberg, Bergelson and Soderstrom2019). WCerr is a measure of the absolute deviation between LENA and transcriber counts, expressed as a proportion:
 $${\rm W}{\rm C}_{{\rm err}} = \lpar {\vert {\lpar {{\rm automated\ }\ndash {\rm transcriber}} \rpar } \vert /{\rm transcriber}} \rpar \ast 100$$
Note that this estimate penalizes over- and underestimation equally. Mean (M) and median WCerr reflect the central tendencies of the absolute deviation across participants. Smaller WCerr reflects more similar absolute estimates across LENA and transcriber, on average, whereas, a larger WCerr indicates less similar absolute estimates.
Results
Total Adult Words
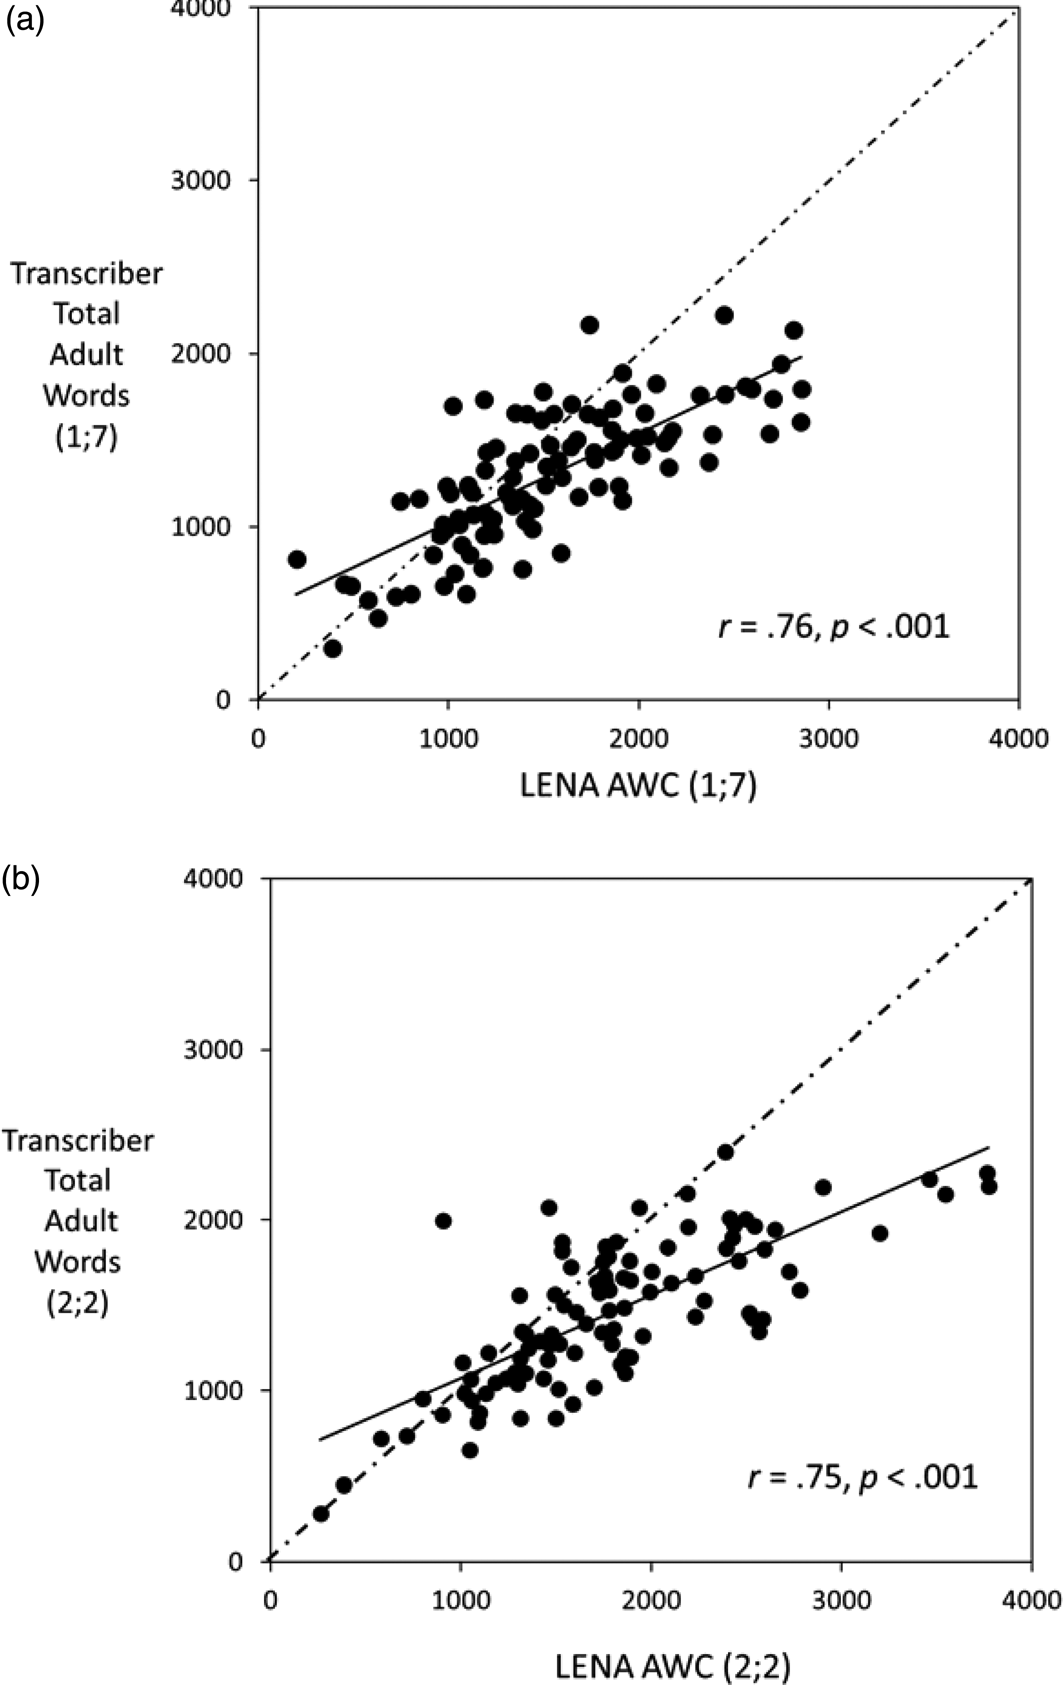
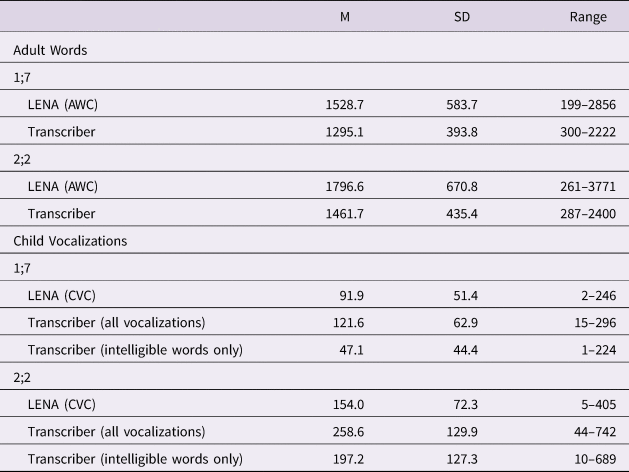
Table 2 presents descriptive statistics for LENA AWC and transcriber Total Adult Words at 1;7 and 2;2. The two methods yielded average estimates of between approximately 1200 and 1800 words produced over the play session and similarly wide range across caregivers. Figures 2a and b plot the associations between LENA AWCs and transcriber Total Adult Words at 1;7 and 2;2, respectively. Correlations were strong (rs ⩾ .75) with no clear outliers at either time point. Correlations across timepoints were similar (LENA: r(96) = .63, p < .001; Transcriber: r(96) = .68, p < .001).
Scatterplots of the associations between LENA-generated Adult Word Counts (AWC) and Transcriber Total Adult Words at (a) 1;7 (n = 104) and (b) 2;2 (n = 102). Solid line represents linear best fit; dashed line represents the identity line (diagonal).

Descriptive statistics for Adult Word tokens and Child Vocalization/Word tokens based on LENA automated analyses and transcribers at 1;7 (n = 104) and 2;2 months (n = 102)

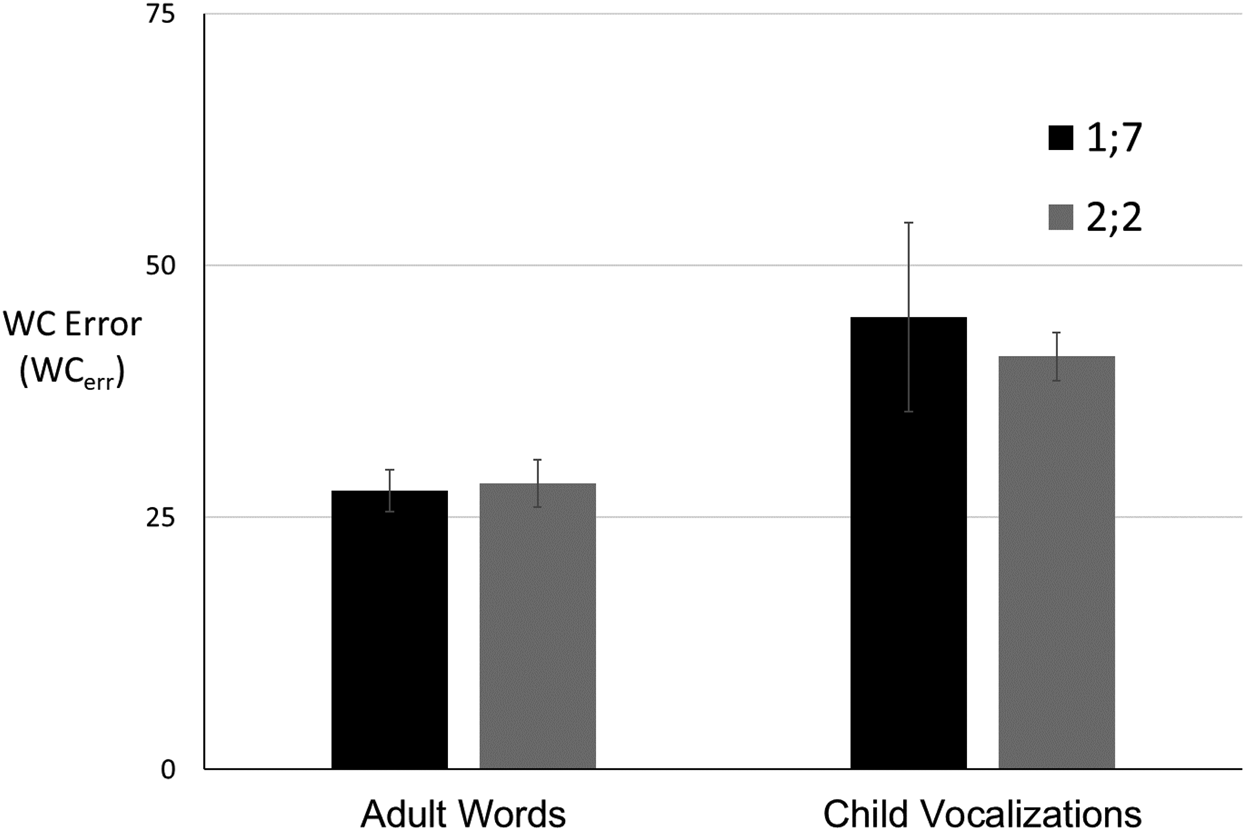
Table 2 also shows that AWCs were significantly higher than transcriber Total Adult Words at both 1;7, t(103) = 6.3, p < .001, d = .61, and 2;2, t(101) = 7.6, p < .001, d = .75. Figure 3 shows that WCerr was just above 25% at both age points (1;7: M = 27.7%, Median = 23.6%, range = 0.0 to 87.2%; 2;2: M = 28.3%, Median = 20.3%, 0.4 to 89.9%), with no differences across time points, t(97) = 0.25, p = .80, d = -.03.
Mean difference between LENA automated AWC and transcriber Total Adult Words, and automated CVC and transcriber Total Child Vocalizations, expressed as a percentage (WCerr) at 1;7 (n = 104) and 2;2 (n = 102). (Ziaei et al., Reference Ziaei, Sangwan and Hansen2016). Error bars represent +/− 1 SE.

Total Child Vocalizations
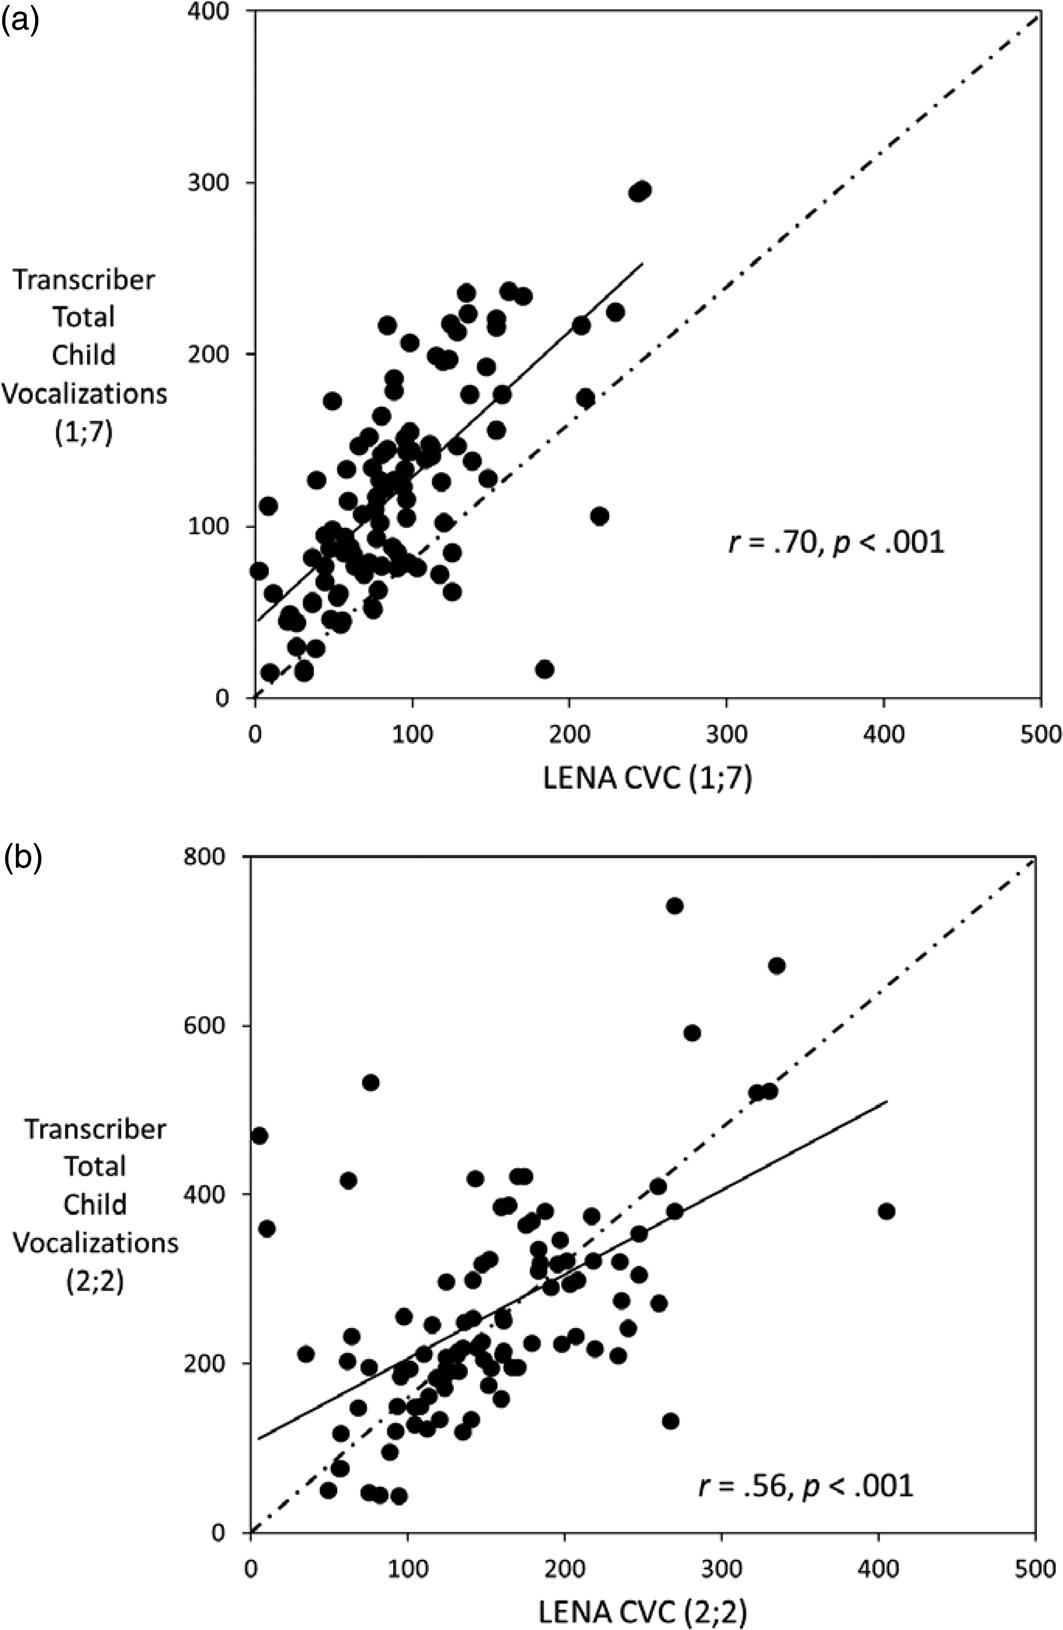
Table 2 presents mean CVC and Total Child Vocalizations. Across methods, children were producing approximately 100 vocalizations during the session at 1;7 and 200 vocalizations at 2;2. Figure 4a shows a strong correlation between LENA and transcriber at 1;7. Figure 4b also shows a significant positive correlation at 2;2, albeit weaker than at the earlier age point.
Scatterplot of the association between LENA Child Vocalizations (CVC) and Transcriber Total Child Vocalizations at (a) 1;7 (n = 104) and (b) 2;2 (n = 102). Solid line represents linear best fit; dashed line represents the identity line (diagonal).

At 1;7, Table 2 shows that CVCs were significantly lower compared to Total Child Vocalizations, t(103) = 6.6. p < .001, d = .64. Figure 3 shows that the WCerr at 1;7 was about 45% (M = 44.9%, SD = 95.6, Median = 34.2%), nearly twice that as for adult words, with substantial variation across participants (range = 0–982.4). At 2;2, CVC was again significantly lower than Total Vocalizations, t(101) = 9.8, p < .001, d = .97. The WCerr was comparable to that at the earlier age point, with less variability (M = 39.5%; Median = 37.0; range = 0–113.6).
Both methods reflected an increase in child vocalizations from 1;7 to 2;2, yet the increase was significantly smaller for LENA (M = 61.3, SD = 68.6) than for transcribers (M = 138.8, SD = 117), t(97) = 7.4, p < .001, d = .75. Both LENA and transcriber counts were moderately correlated across age (LENA: r(96) = .43, p < .01; Transcriber: r(96) = .45, p < .01). This could reflect sources of error due to the recording process or other aspects of the procedure at the two time points, or true variability in the degree to which children changed over this period.
Intelligible Child Words
Not unexpectedly, Table 2 shows that counts of Intelligible Child Words were significantly lower compared to Total Child Vocalizations at both 1;7, t(103) = 19.3, p < .001, d = 1.9, and 2;2, t(101) = 13.7, p < .001, d = 1.4. The estimates were strongly correlated (1;7: r = .78, 2;2: r = .94, all p < .001), suggesting that children who were producing more vocalizations were also producing more intelligible words.
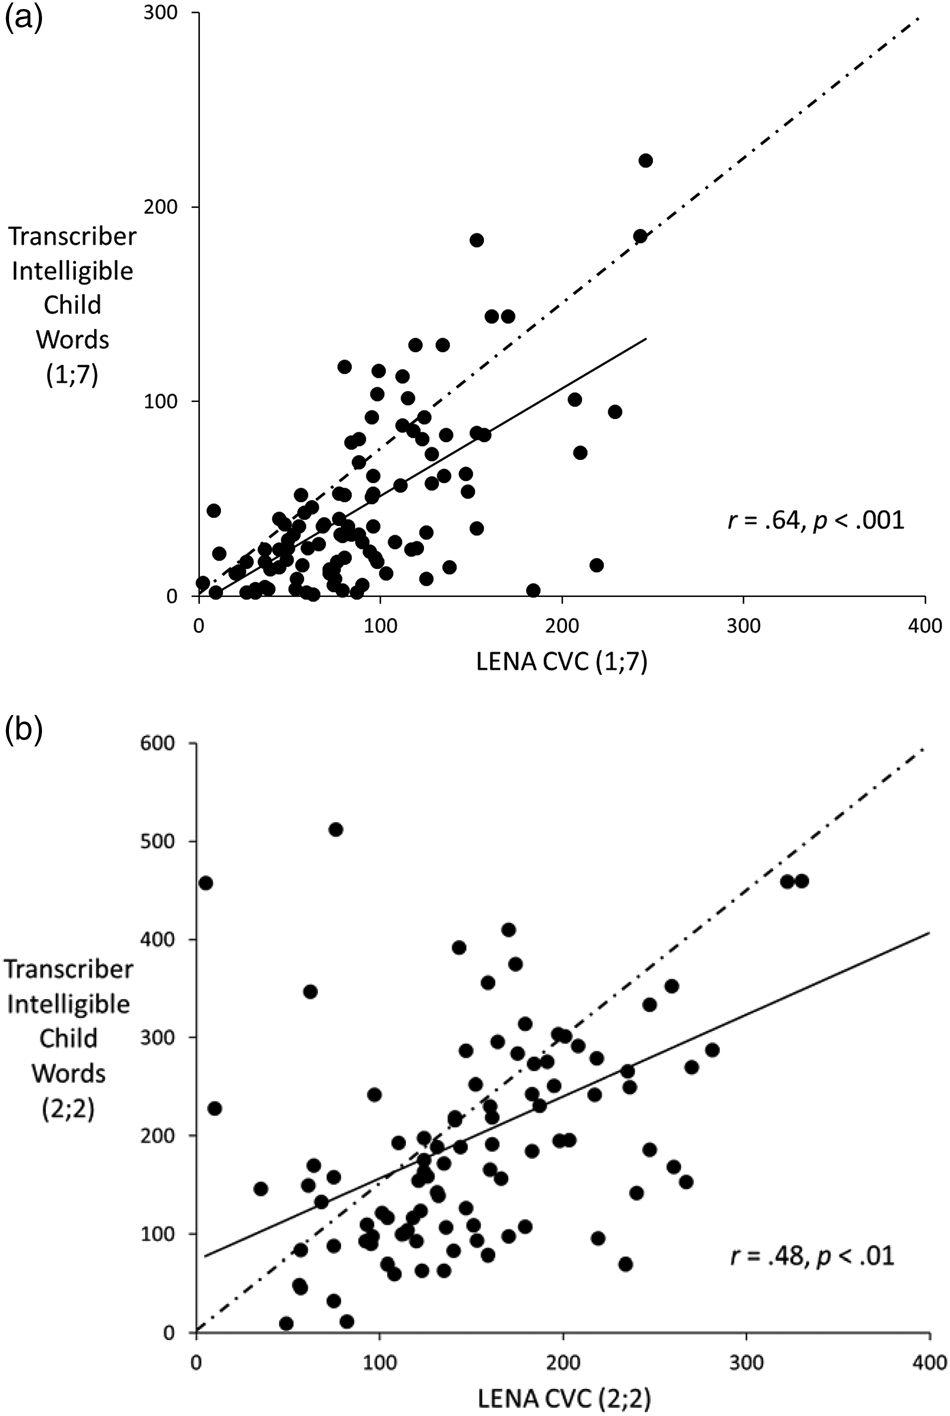
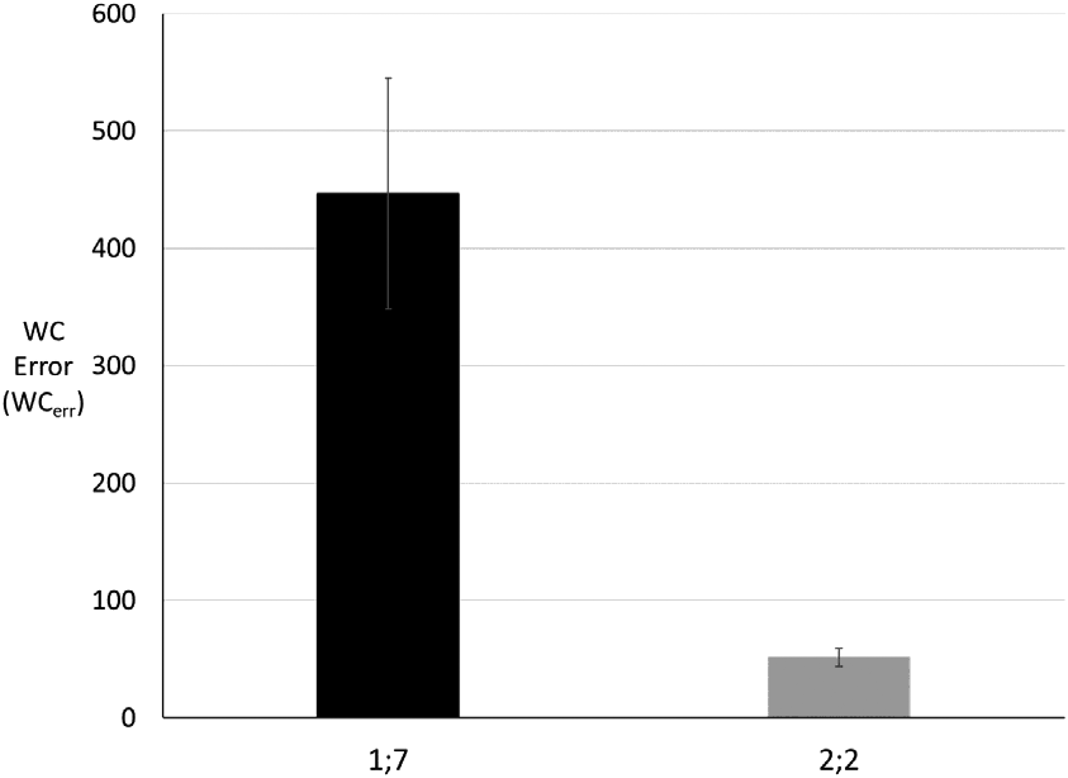
Comparing CVC to transcriber Intelligible Child Words, Figure 5a shows a moderate correlation at 1;7. Figure 5b shows a weaker correlation at 2;2. Figure 6 shows that WCerr values were large at 1;7 (M = 446.9%; Median = 111.4, range = 0.9 to 6,200%). This is due to the consistent underestimation in children at the lower end of the distribution in word production, mitigated by both under- and over-estimation in children at the upper end of the distribution. WCerr values were smaller at 2;2 (M = 51.6%, Median = 32.8, range = 0–583.3) than at 1;7, because LENA both under- and over-estimated intelligible child words across the full range.
Scatterplot of the association between LENA Child Vocalizations (CVC) and Transcriber Total Intelligible Words at (a) 1;7 (n = 104) and (b) 2;2 (n = 102). Solid line represents linear best fit; dashed line represents the identity line (diagonal).

Mean difference between LENA automated CVC and transcriber counts of child intelligible words, expressed as a percentage (WCerr) at 1;7 (n = 104) and 2;2 (n = 104) (Ziaei et al., Reference Ziaei, Sangwan and Hansen2016). Error bars represent +/− 1 SE.

Discussion
Automated speech analyses systems, such as LENA, have recently gained popularity for exploring a range of naturalistic contexts in which caregivers and children interact. However, automated speech analyses could be useful in traditional research contexts as well. Here, we explored the extent to which LENA provides accurate estimates of adult words and child vocalizations/words when used with short recordings in a laboratory context with Spanish-speaking children and their caregivers. Similar to earlier studies with day-long recordings, the results indicated that LENA AWCs were strongly correlated, albeit not perfectly, with adult word counts based on human transcribers. Thus, LENA and transcribers did a comparable job in capturing which caregivers talked more and which caregivers talked less during a laboratory play session. Importantly, associations between the LENA and transcriber counts were consistent across the full distribution of caregiver talk, suggesting similar relations at both low and high levels of caregiver talk. Both LENA and transcribers captured stability across time in caregivers to a similar degree. At the same time, the absolute AWCs were inflated compared to transcriber counts, with a 25% error on average at both time points. The absolute discrepancies were considerably higher than those reported by the LENA Foundation for day-long recordings (Xu et al., Reference Xu, Yapanel and Gray2009), a discrepancy that could be the result of our shorter recordings but is surprising given that the laboratory context is quieter than home environments.
The results were less promising with child vocalizations. Correlations between CVC and Total Vocalizations were weaker than for adult words, although still moderate to strong. At 1;7, LENA consistently underestimated child vocalizations compared to transcribers and deviation estimates were nearly twice that as for adult word counts. At 2;2, the correlation was weaker than at 1;7 and there was evidence of both under- and over-estimations. LENA also underestimated the degree of developmental change compared to transcriber counts.
At the same time, CVCs over-estimated intelligible word counts at 1;7, with the weakest correlations found between LENA and transcribers at 2;2. The fact that CVC under-estimated child vocalizations but over-estimated child intelligible words suggests that LENA counts are somewhere between these two traditional indexes of child productions at this age. Future studies should further explore the sources of discrepancies across methods and the conditions under which LENA's accuracy could be improved in this setting.
Taken together, these results suggest that LENA may be a useful, but not perfect, alternative to transcription for measuring amount of caregiver speech in quiet, short contexts akin to a traditional laboratory play session. Evidence for LENA's accuracy in estimating child vocalizations was less promising. It is not clear how our findings relate to the accuracy of LENA's estimates in the context of daylong recordings, the more typical use-case. On one hand, our recordings are significantly shorter than the minimum recommended length of 1 hour, and a previous evaluation by the LENA Foundation found that error rates dropped as a function of recording length (Xu et al., Reference Xu, Yapanel and Gray2009). Thus, our findings may underestimate performance relative to its intended use with daylong recordings. On the other hand, our recordings were conducted in much simpler acoustic environments, a single caregiver and child in a quiet room. Thus, our results may inflate the system's performance relative to naturalistic settings.
Our findings suggest that LENA may be an appropriate alternative to transcription when the goal is to capture individual variation in number of adult words, particularly when the cost of transcription is prohibitive or when availability of expert personnel is lacking. On the other hand, LENA may be less useful when the absolute number of adult words, or child vocalizations, are the focus. One advantage of LENA is that estimates can be generated quickly, within a few hours of data collection. Another is that LENA estimates do not rely on the specialized expertise and significant training that are required for reliable transcriptions, although some screening of sessions may be required. In many settings, these advantages may offset the relatively substantial upfront and ongoing costs associated with the LENA software, recording devices, and specialized clothing.
On the other hand, many benefits of transcription remain. Transcripts provide information about the syntactic, semantic, and pragmatic properties of the speech produced by caregivers that is not captured by the automated LENA measures. Although, in some contexts, quantity of talk is correlated with features of that talk (e.g., lexical diversity, syntactic complexity), research suggests that properties of caregiver speech and of caregiver-child conversations predict child language outcomes over and above quantity alone (Rowe, Reference Rowe2012; Hirsh-Pasek et al., Reference Hirsh-Pasek, Adamson, Bakeman, Owen, Golinkoff, Pace, Yust and Suma2015). In the current sample, those caregivers who used more words also tended to produce longer utterances at both 1;7, r(103) = .60, and 2;2, r(101) = .60. These correlations are strong, but far from perfect, suggesting there is variation in qualitative features of caregiver talk that remains unexplained by sheer word counts (Hoff, Reference Hoff2006; Montag, Jones & Smith, Reference Montag, Jones and Smith2018). While the automated counts necessarily gloss over these critical features, LENA produces an audio recording that enables further and more in-depth qualitative analyses if so desired. LENA AWCs may be usefully combined with other measures of parent-child interactions, such as caregiver sensitivity or responsiveness (e.g., Roggman, Cook, Innocenti, Norman & Christiansen, Reference Roggman, Cook, Innocenti, Norman and Christiansen2013), to yield converging information about overall characteristics of caregiver-child engagement as observed in the laboratory. These and other potential uses expand the toolbox of resources for capturing variation in caregiver talk in the research context.
A potential limitation of the current study is that we recorded Spanish-speaking caregivers and their children, while the LENA system was developed and validated with English-speaking families; results may be different with speakers of other languages. At the same time, the current results add evidence that LENA can provide valid estimates of Spanish-speaking caregivers in laboratory environments as well as in all-day recordings (Weisleder & Fernald, Reference Weisleder and Fernald2013). Another limitation is that our recordings were short and children were at the beginning stages of productive language use. Short recordings with sparse samples may have exaggerated the absolute differences between LENA and transcribers for the child measures. Future studies should explore whether accuracy improves in longer recordings or with older children who are producing more vocalizations. In addition, caregivers were almost exclusively adult females; different results may be obtained with male caregivers. Finally, our study did not provide a validation of conversational turns, an important area of future research.
Conclusion
The LENA recording and speech recognition technology has become increasingly popular because of its ability to capture the complex and noisy real-life contexts in which children and their caregivers engage over the course of the day. The results of this study suggest that this technology offers some promise as a tool in the more constrained and shorter laboratory context as well. This functionality may be especially useful in large-scale studies when a global assessment of amount of caregiver talk is needed and when the cost, time, or training involved with transcription is burdensome. LENA does not appear to be as appropriate a substitute for transcribers in studies that have child vocalizations or words as a focus. Future studies are needed to fully characterize the sources of these limitations and their implications for research and clinical uses.
Acknowledgements
We are grateful to the children and parents who participated in this research. Special thanks to Mónica Munévar, Janet Bang, Ruby Roldan, Karina González, Araceli Arroyo, Viviana Limón, Lucía Martínez, Veronica Goei, and the staff of the Language Learning Lab at Stanford University and Grail Family Services. This work was supported by grants from the National Institutes of Health (HD092343), the Schusterman Foundation, the Lucile Packard Foundation, and the W.K. Kellogg Foundation to Anne Fernald.