Introduction
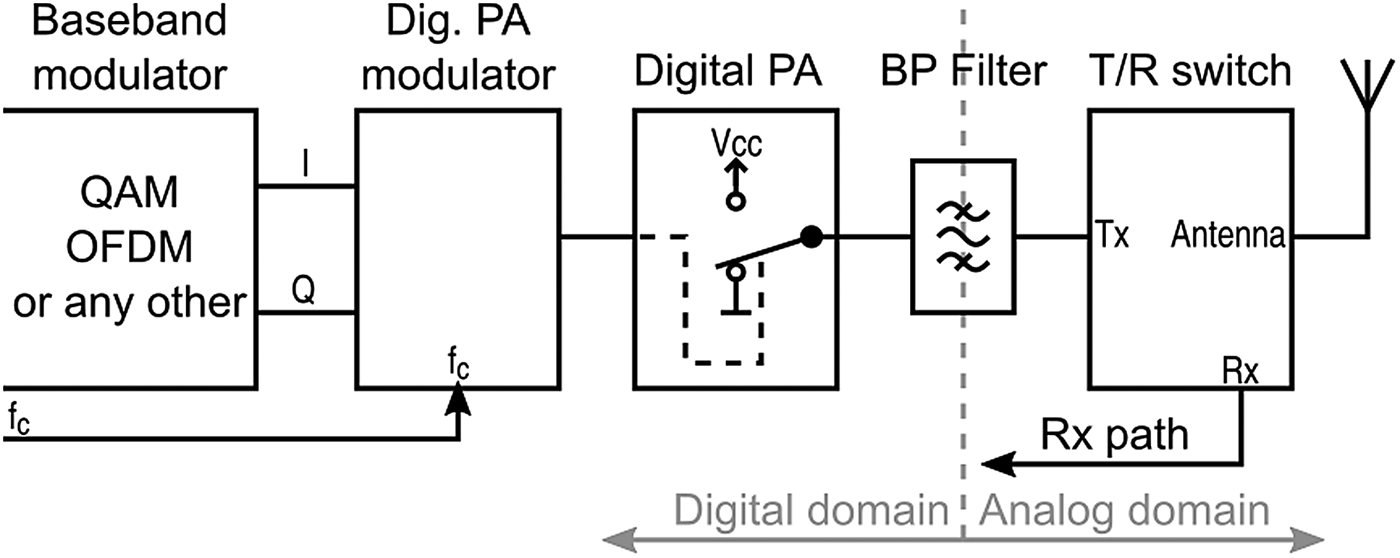
The digital transmitter as depicted in Fig. 1 is a fully transparent replacement for an analog transmitter chain from the upconverter to the output filter. With digital transmitters the upconverter is replaced by a so-called modulator, in some papers also referred to as encoder. It accepts a complex baseband signal of any kind and translates it into a purely binary data stream suitable to be amplified by the digital power amplifier (PA). This process is completely transparent to the baseband signal itself. The content and modulation scheme of the baseband (BB) are not altered by the translation carried out by the digital PA modulator, i.e., the wanted spectrum appears close to the carrier frequency as in case of an analog upconverter.
Block diagram of a digital Tx chain.

Since the digital PA modulator is a purely digital circuit, it can be implemented along with the BB modulator as a highly integrated digital ASIC (application specific integrated circuit). The digital PA itself essentially is a voltage-controlled switch and thus, in principle, can be more efficient than analog amplifiers. The amplifier output is fed into a band-pass (BP) filter, which removes all out-of-band signals, thus restoring the analog signal at the selected carrier frequency. Note, that the transition from a digital (i.e. binary) signal into the analog domain takes place only in the BP filter. No dedicated digital-to-analog converter is needed. Right in front of the antenna a transmit/receive (T/R) switch selects between transmit and receive path.
In today's applications BB processors are usually implemented in the digital domain. Extending the boundary of the digital domain even behind the PA yields several benefits. Modern digital logic requires extraordinary low power and can be implemented in a very small volume in general. The solution presented here only requires 1.8 × 1.8 mm2 for the amplifier and 2.5 × 2.3 mm2 for the T/R switch. Dimensions and cost can be further reduced if the on-chip blocking caps would be implemented on an interposer. The active circuitry of this amplifier design without the DC stabilizing capacitors consumes just 0.5 mm2 of chip area (ref. Fig. 4). A transmitter of this size will easily fit behind each antenna, even in the tightest (massive) MIMO (multiple input, multiple output) antenna arrays, effectively eliminating problems with cable losses and volume requirements. Also, since digital PAs do not utilize frequency dependent matching techniques the operating frequency can be changed on the fly to anywhere between DC and the maximum frequency of operation by adapting the input signal and switching the BP filter to the new carrier.
Most publications in the field of digital transmitters either cover only the modulator without any PA [Reference Dinis, Oliveira and Vieira1,Reference Tanio, Hori, Tawa and Kunihiro2] or characterize an amplifier without a modulator [Reference Wentzel, Chevtchenko, Kurpas and Heinrich3–Reference Hoffmann, Wentzel, Hühn and Heinrich5]. Our own research shows that modulated operation can change the achievable amplifier characteristics in comparison to single-tone measurements. Also, the interaction between digital PA modulator and the PA poses its own challenges on the amplifier design as well as on the modulator side. This paper builds on our previous work by implementing a complete digital amplifier chain including modulator, PA, BP filter, and T/R switch. It is the extended version of [Reference Hühn, Wentzel and Heinrich6] and provides additional insights in aspects that could not be fitted within the limited space of the original work. Furthermore, a new amplifier version is presented, which enables higher carrier frequencies and was evaluated with higher bandwidth signals up to 100 MHz. The method used by the digital PA modulator to correct for amplifier non-idealities is described and its behavior is analyzed for different BB signals. Characterization is done using realistic signals similar to common WCDMA (wide band code division multiple access) and LTE (long-term evolution) signals. The new digital PA MMICs (monolithic microwave integrated circuits), presented in this paper for the first time, are of greatly reduced complexity compared to earlier designs [Reference Hühn, Wentzel and Heinrich7], resulting in a very stable operation and insensitivity to supply voltages.
The paper is organized as follows: The section “Realization” describes the components of the transmitter chain and the section “Measurement Results” discusses single tone as well as modulated measurement results in the 900 MHz band. The section “Increasing Frequency and Bandwidth” presents a second amplifier version, using a faster GaN process, enabling 2 GHz operation. A discussion of practical aspects of the distortion correction scheme is given in the section “Non-linearity correction” and the section “Conclusion” concludes the work.
Realization
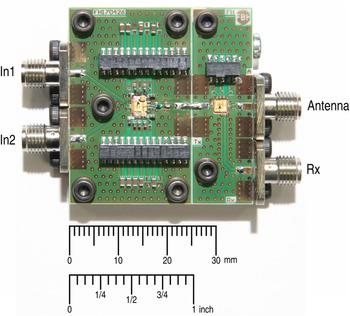
The all-digital transmitter is realized following a modular approach. The amplifier as well as the T/R switch are each built as independent modules that can be tested and characterized separately but can also be mechanically and electrically linked together. See Fig. 2 for a photograph of both sub-modules combined to form a single unit. This approach provides great flexibility for testing different amplifier versions in combination with different switches and also allows for individual characterization of the switch and amplifier on their own. Both modules were fabricated using Rogers RO4003C laminate. The size of the modules in Fig. 2 is only constrained by the large test connectors used and can easily be reduced to a fraction of the area by choosing smaller interconnect solutions. The modulator is implemented as a Matlab model. The binary output waveforms are generated using Keysight's M8195A AWG providing a maximum sample rate of 65 GSa/s.
Realized modules combined to form a single unit: Digital microwave PA with filter (left) and T/R switch (right).

Modulator
Digital amplifiers are inherently non-linear circuits which work similarly to a digital buffer gate with voltage level shifting, but on a much higher frequency scale and with much higher output power. The desired linearity for amplification of analog signals is created by encoding the amplitude and phase variations into a stream of binary pulses within the digital PA modulator. The encoding is performed in such a way that the spectrum of the binary waveform at the amplifier input contains the wanted signal at the carrier frequency. In order to form a purely binary signal in the time domain, additional frequency components are added far out-of-band. Then, a simple BP filter is sufficient to restore the wanted analog signal from the amplified binary pulse stream.
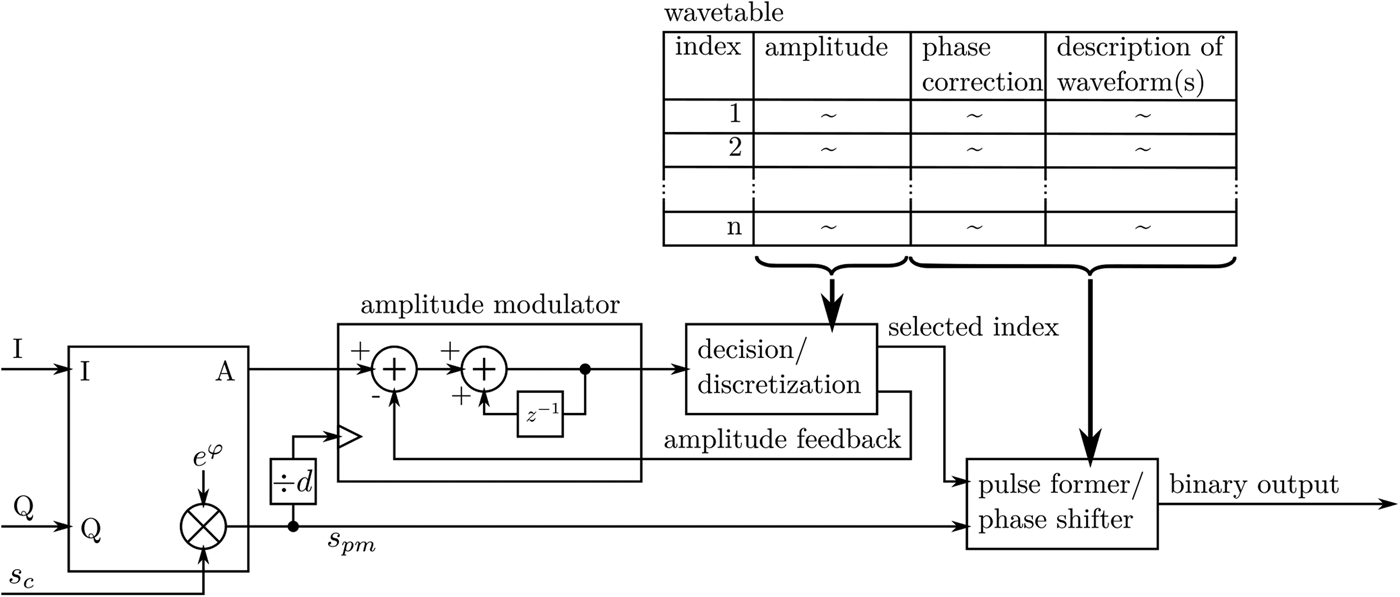
The digital PA modulator used in this setup is described in detail in [Reference Hühn, Wentzel and Heinrich8]. Figure 3 provides a block diagram. The signal from the BB processor is assumed to be provided as complex valued samples. In the first block of Fig. 3 this signal is reprocessed into an amplitude-only signal and a purely phase modulated carrier. The latter one is used as a clock source for all further blocks within the digital PA modulator. For all investigations in this paper the amplitude modulator block runs with a decimation factor of d = 1, i.e., at carrier speed. A low-pass delta-sigma modulator of second order is used. Amplitude modulator and discretizer work together to select a waveform entry from the wavetable. The index of the selected entry is then sent to the pulse former circuit. The waveform description is used inside the pulse former to feed a high-speed shift register and by thus forming the output signal. A phase correction value can be utilized by a digitally controllable delay line inside the pulse former block to shift the whole pulse with sub-sample resolution.
Block diagram of the digital PA modulator.

The modulator as described also inherently provides the ability to correct for static non-idealities of the amplifier. For this the output of the amplifier after the BPF is sampled and the actual amplitude and phase are compared to the ideal values. Initially, the amplitude values recorded in the wavetable for each waveform represent the ideal (calculated) system response of that specific waveform, which differs from the actual response. Thus, by replacing the amplitude values with the sampled ones the wavetable will provide a better representation of the actual behavior. Any deviations in phase can be added to the phase correction field.
It was found that for the 5 MHz wide BB signal about 1000 randomly sampled points in the output signal already provide a reasonable basis to estimate new amplitude values with good accuracy over the complete amplitude range.
Digital microwave PA
For amplification a digital microwave PA MMIC was developed and realized in the FBH's (Ferdinand-Braun-Institut, Leibniz-Institut für Höchstfrequenztechnik) 0.25 μm GaN HEMT (high electron mobility transistor) process. Other works in the field of digital amplifiers use very complex topologies, often incorporating a lot of different power supply rails [Reference Wentzel, Chevtchenko, Kurpas and Heinrich3]. In many papers detailed schematics are omitted or substituted by simplified functional diagrams, but photographs show a lot of different biasing connections [Reference Soma, Hori, Wentzel, Heinrich and Kunihiro4,Reference Tanio, Hori, Hayakawa, Tawa, Motoi and Kunihiro9]. This work, in contrast, focuses on reducing circuit complexity. Component count, number of voltage sources and the dependence of voltage levels to each other is kept at a minimum. As a positive side effect, the stability of operation when subjected to supply voltage fluctuation is greatly enhanced over previous designs [Reference Hühn, Wentzel and Heinrich7].
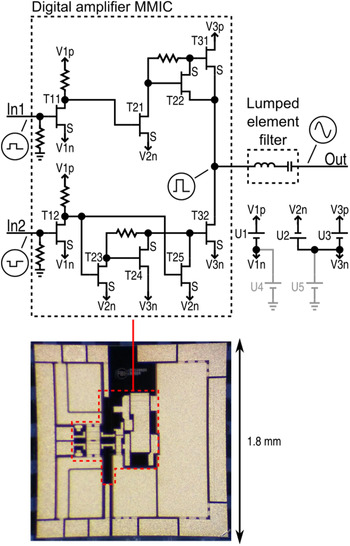
Figure 4 depicts the schematic of the realized amplifier module. Merely three voltage sources (U1–U3) provide power to the circuit. U4 and U5 represent static offset potentials, compensating only tiny leakage currents (≪ 1 mA). Since GaN HEMTs require a gate drive of 4 − 5 Vpp to fully switch on and off, an on-chip class-A preamplifier stage (T11, T12) is included. This stage is powered by U1 (usually 10 − 25 V). The complementary digital input signal reaches T11 and T21 via the terminals In1 and In2. As the maximum signal input amplitude provided by the AWG is ≈ 700 mVpp ( $\widehat {=} 2.5 \, {\rm mW}$) only, T11 and T12 cannot operate in a true energy-friendly switching mode. Instead, they are operated in their active region in class A mode. The necessary DC bias of ≈ 2.2 V is set by U4. Since there is no DC current flowing through the transistors gate (except negligible leakage), U4 does not provide any current. In commercial applications this stage should be realized off-chip in a more energy-efficient CMOS (complementary metal-oxide-semiconductor) process, directly feeding T21, T23, and T25 with the required ≈ 5 Vpp. With the availability of complementary and very sensitive low-threshold-voltage transistors in CMOS, this first amplification stage could be realized in the form of a purely digital (i.e. switch-mode) voltage level shifter. In this way, the power consumption of this stage could be reduced down to the mW region. The 5 V output swing is still within the limits of common extended drain CMOS processes, although the required high switching speed poses some challenges to the CMOS realization.
Schematic of digital microwave PA. Sources in grey do not supply any current. Bottom: Chip photograph.

The preamplified ≈ 5 Vpp signal is then boosted by T21 to provide a peak-to-peak voltage larger than U3 at the gate of T31. T22 adds current amplification. Also, the gate-to-source capacitance of T31 helps by providing positive feedback. When the gate voltage of T31 rises in order to switch it into the conducting state, the source voltage rises. This ∂ u/∂ t couples through the gate-to-source capacitance and helps to further charge the gate. For the low-side output transistor T32, in contrast, ≈ 5 Vpp gate drive is sufficient, but, in this case, the drain-to-gate capacitance has an adverse effect. When T32 is switched into conducting state, the voltage at its drain falls and, through the drain-to-gate capacitance, pulls the gate down. As a result, much higher gate drive currents are required. The transistors T23–T25 provide the necessary current amplification for charging and discharging the gate.
The lack of positive gate-drive voltage for the final-stage transistors T31 and T32 was an intentional design decision in favor of greatly simplifying circuit topology. Both transistors were realized with a total gate-width of 1 mm so that they can carry the expected full-load peak current of 670 mA even at 0 V gate-source voltage. U2 sets the negative gate-to-source voltage that is applied to the final stage transistors when switched open (usually between 5 and 8 V). U5 matches the DC bias of the digital amplifier part (T21–T32) to output bias of the preamplifier stage (T12–T12). Depending on the value of U1, U5 usually varies between 8 and 19 V. The amplified signal at the MMICs output pin is finally fed into a simple lumped element filter. It consists of a 15 nH inductor (Coilcraft 0402DC series) and a 1.8 pF capacitor (ATC 600L series) for BP filtering at 900 MHz.
Since there is no reactive matching necessary in digital amplifiers, they cannot only operate over a large frequency range but also drive a broad range of load impedances. The (power) gain is purely determined by the supply voltage level (U3) and the load impedance. Limits are only given by the maximum allowable voltage of the MMIC process and the current handling capability of the final stage HEMTs. This MMIC's current handling capacity is designed to reach its maximum when driving a 50 Ω load at the technology's specified maximum supply voltage of 60 V, resulting in about 11 W of output power delivered into the load, according to simulation.
GaN-based T/R switch
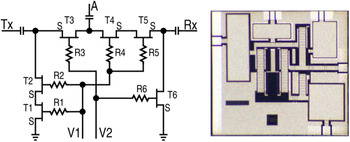
To switch between transmit (Tx to antenna) and receive (antenna to Rx) path of the proposed digital transceiver line-up, a SPDT (single-pole-double-throw) switch using 8 × 125 μm GaN-HEMTs from the same process as the previously described digital amplifier are used. Figure 5 shows the schematic of the realized MMIC.
Schematic of the GaN-based SPDT switch including a chip photograph.

The switch is composed of six 8 × 125 μm GaN-HEMTs (T1–T6 in Fig. 5), six resistors (R1–R6) with 2 kΩ at each gate of the HEMTs and a blocking capacitor (≈ 120 pF) at each pin Tx, Rx and A (antenna). To switch the RF output signal from the digital PA at the Tx node to the antenna input (A), T4, T5, T1, and T2 are reverse-biased so that channels between source and drain are pinched-off. In our case, this means a negative voltage of −20 V at pin V1. At the same time the gates of T3 and T6 are forward biased (V2 = +1 V) so that low channel resistance exists between drain and source. T3–T5 act as a series device to switch the RF on/off. As the focus of this switch was low insertion loss in the transmit path (Tx to A), only one GaN-HEMT T3 is used for isolation in the off-state. In contrast, the Rx path (A to Rx) applies with T4, T5 two transistors for increased isolation in off-state. T1, T2, and T6 shunt RF leakage to ground when the respective path is inactive. The SPDT switch MMIC was mounted on a copper heat sink and connected via bond-wires to the PCB (printed circuit board). The resulting module can then be used for stand-alone characterization or can be connected to the amplifier module (cp. the section “Digital Microwave PA”) to complete the Tx chain. Insertion loss values of 0.6 dB in the transmit path and 1 dB in the receive path were measured at 900 MHz. The input reflection is better than −13 dB at each port. Power handling up to 10 W was simulated, which is a common value for a 1 mm gate-width GaN-HEMT.
Measurement results
Single-tone measurements
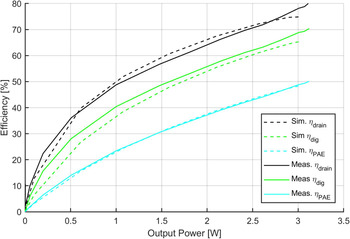
All single-tone measurements were carried out using U3 = 30 V. Figure 6 compares measured efficiency with simulated efficiency for different power backoff levels. The overall power added efficiency (PAE) is relatively low because of the high static power consumption of the class A preamplifier stage (T11 and T21; P U1 ≈ 1.8 W). When this stage is realized as digital level shifter in CMOS in a commercial product, its power consumption is expected to be much lower (ref. the section “Digital Microwave PA”), increasing the PAE to values very close to η dig. η dig denotes the efficiency of the switch part of the amplifier (rest of the circuit, including T21–T32, P U2, P U3). The final-stage drain efficiency η drain, as a measure commonly used in digital PA publications, only considers the final stage (T31 and T32; P U3). η dig is the relevant efficiency of the digital PA when benchmarking it to other concepts. We achieve up to 70% η dig for full-scale single-tone signals. This value is expected to grow even further when increasing the supply voltage U3 beyond the present value of 30 V. Overall, the measured data matches the simulated performance well.
Measured and simulated efficiency versus back-off; ηdrain = final-stage drain efficiency (U3); ηdig = efficiency without preamplifier (U2 + U3); ηPAE = PAE (U1 + U2 + U3 + Input power).

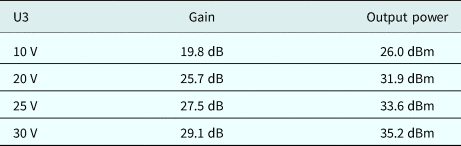
The gain of the proposed amplifier is purely defined by the supply voltage U3 (ref. Table 1). None of the other supplies have to be readjusted when changing U3. At a supply voltage U3 of 30 V a full-scale output power of 35.2 dBm was reached while only providing 2.4 mW (total power of the digital signal with 710 mVpp, which means 2.0 mW at 900 MHz) on each of the two input ports. Also, the amplifier proved to be very insusceptible to variations of several hundred mV at the voltage sources. Higher values for U3 up to 60 V should be possible but could not be measured due to breakdown problems with the large MIM capacitors.
Gain and output power for different supply voltages U3, measured with 900 MHz full-scale single tone

Modulated measurements
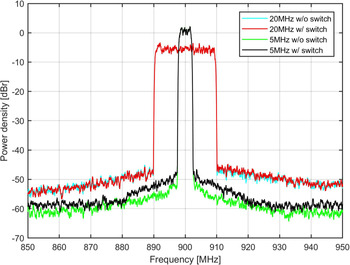
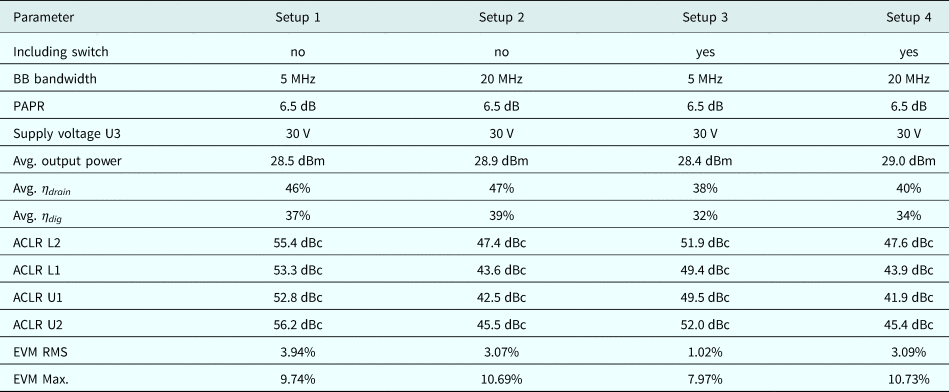
Further measurements were conducted using QAM BB signals of 5 MHz and 20 MHz bandwidth with 6.5 dB PAPR (peak-to-average power ratio) on a 900 MHz carrier. The QAM signals are generated from random complex samples, which are processed by polar clipping and a raised-root-cosine filter to give the desired PAPR while closely resembling the statistical properties of WCDMA signals. For converting the BB signal into a binary pulse stream, the Matlab model of the modulator as described in the section “Modulator” and [Reference Hühn, Wentzel and Heinrich8] was used. The output of a fast AWG (Keysight M8195A) was directly connected to the module described in the section “Realization”, providing ≈700 mVpp to the MMIC's first amplifier stage. The resulting output signal of the module was captured using a Tektronix TDS6124C real-time oscilloscope and downloaded to a PC for analysis. Results were cross-checked with a spectrum analyzer. Fig. 7 shows the resulting spectrum at the amplifier output for both a 5 MHz and a 20 MHz wide BB signal. Table 2 summarizes the measurement results. An efficiency of η dig = 39% is reached for the 20 MHz wide signal. As with the single-tone measurements, the efficiency for the modulated signals is also expected to rise when further increasing the supply voltage U3 beyond 30 V.
Spectrum of different BB signals measured at the amplifier output (“w/o switch”) and at the antenna port of the T/R switch (“w/ switch”); All signals with enabled correction feature of the modulator.

Summarized measurement results

For all measurements the parameter correction feature of the modulator (see. [Reference Hühn, Wentzel and Heinrich8]) was enabled in order to correct for amplifier distortions resulting from the selected dead time (between high- and low-side transistor switching) and amplifier imperfections. When comparing the results with and without the T/R switch, the slightly lower performance for measurements with the T/R switch in place as well as the slightly higher than expected average output power are a result of uncertainties in the parameter estimation process of this correction (see the section “Non-linearity correction”). A better fine tuning of this optimization process and its parameters might improve the results even more.
Increasing frequency and bandwidth
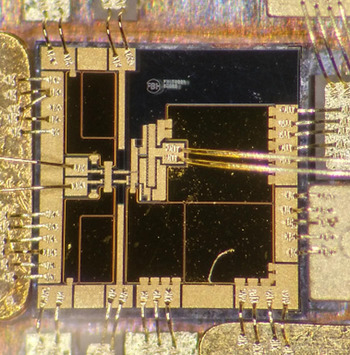
In a second step, an additional amplifier MMIC was fabricated in a GaN HEMT process with only 0.15 μm gate length. The reduced gate length increases the possible operating frequency of the transistors and therefore increases the range of usable carrier frequency in digital amplifier operation. At the same time, the operation voltage is decreased. Figure 8 shows a chip photograph. The schematic is identical to the one in Fig. 4, but device scaling has been adapted to the new process and the reduced maximum supply voltage. T31 measures 400 µm total gate width and T32 is 500 µm. This means, in the digital PA architecture only the PA MMIC is changed and the output filter is adapted to 2 GHz compared to the 900 MHz setup in the section “Modulated Measurements”. The new filter consists of 1.0 pF and 3.9 nH as lumped elements in the 0402 form factor. Bond wires of about 2 mm length at the MMICs output provide additional inductance.
MMIC for the 2 GHz module.

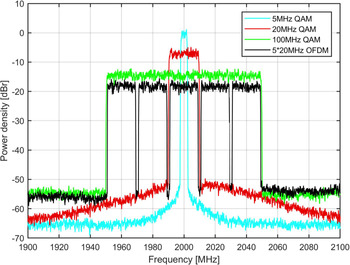
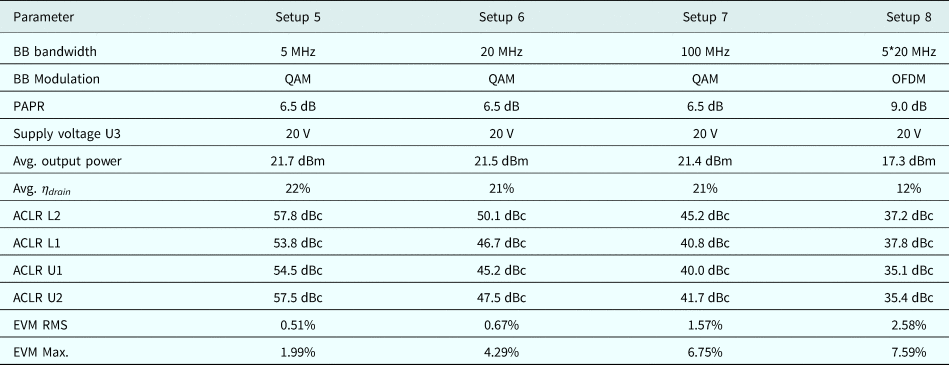
Figure 9 presents the measured spectra for transmission at 2 GHz. The 5 and 20 MHz QAM are identical to the input signals used in the section “Modulated Measurements”. Additionally, a 100 MHz wide QAM signal with 6.5 dB PAPR was applied here in order to demonstrate operation for wide-bandwidth signals. LTE operation is covered by the 100 MHz wide, 9.0 dB PAPR signal. It consists of 5 20 MHz LTE-like OFDM signals in carrier aggregation. Table 3 summarizes the measurement results.
Spectrum of different BB signals measured at the amplifier output.

Summarized measurement results at 2 GHz

The ACLR (adjacent channel leakage ratio) results at 2 GHz are slightly better than in the previous case at 900 MHz. Unfortunately η drain is worse than for the 900 MHz module from the 0.25 μm process (the section “Modulated Measurements”). The drop in ACLR performance and drain efficiency for the 5 × 20 MHz signal with respect to the 100 MHz QAM signal can be explained by the lower average output power, which is an unavoidable consequence of the higher PAPR of this signal. The very limited overall performance in terms of efficiency and output power was found to arise mostly from the fact that the transistors deliver only half of the current expected from DC and load-pull measurements. This effect is due to trap effects which increase the dynamic on-resistance when switching large drain-source voltages. It is still under investigation and must be mitigated for future 0.15 μm switch designs.
The ACLR performance is already very good, in fact even better than for the 900 MHz measurements, but still remains a few dB under its theoretical maximum. While the in-channel frequency components are performing very well (as witnessed by the low EVM values) the measured noise floor in direct proximity to the wanted signal is still a few dB higher than in the signal provided by the digital PA modulator. Exemplary investigations using the 100 MHz QAM signal indicate that the amplitude accuracy is the main limiting factor at the moment.
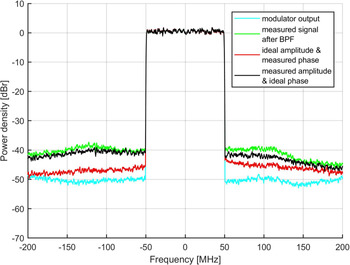
Figure 10 compares the measured spectrum after the amplifier (with correction enabled) to the ideal modulator output signal. Also shown is the measured signal with its amplitude portion post-processed to match its ideal curve, keeping only the measured phase in the plotted signal. For the last trace, the amplitude signal from the measurement is kept, but the phase signal is replaced with its ideal waveform. This method visualizes nicely that correcting the remaining amplitude error yields a better response in the ACLR figures. Future research will, therefore, focus on the exact effects responsible for the remaining amplitude error.
Analysis of the impact of remaining amplitude and phase errors after the BPF (downconverted). Graphs show all four combinations of phase and amplitude portions from the measured output and the ideal signal.

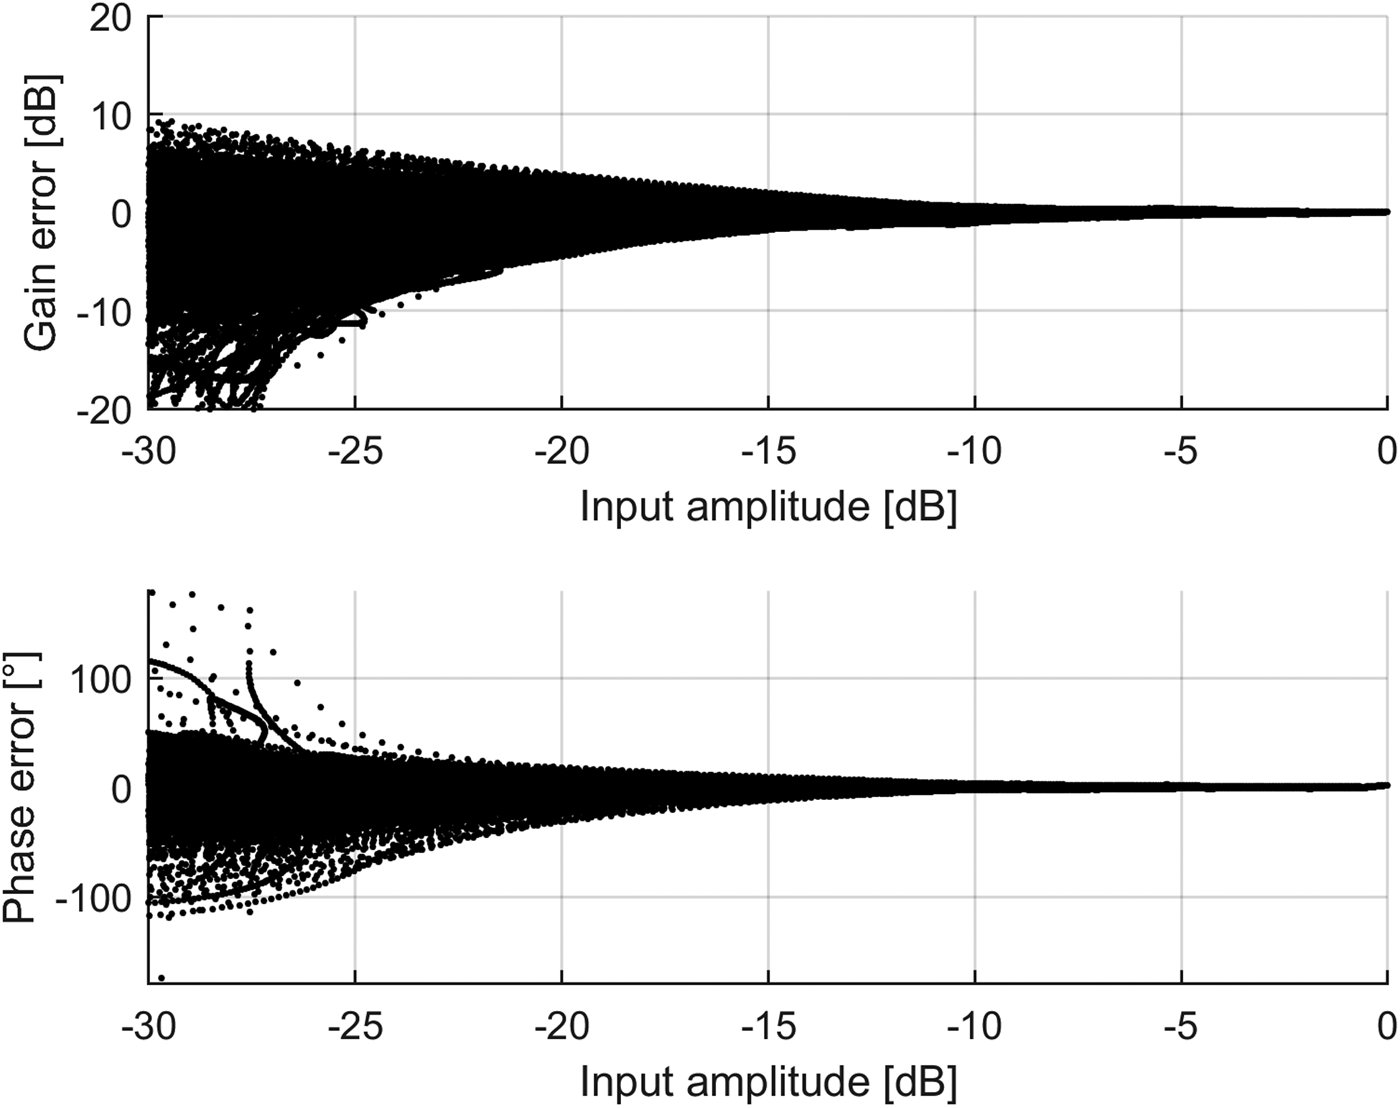
In Fig. 11, the corresponding AM-AM and AM-PM errors are plotted for the measured signal (with correction) and compared to the ideal modulator output. Significant deviations in gain are present mainly for amplitudes below −15 dB relative input power. Figure 12 plots the difference between the ideal and the measured amplitude signal (both scaled to 1) on a linear scale. The mismatch reaches 1% for input amplitudes below −15 dB. This confirms the findings of the previous figure, but also shows that the absolute error is only marginally smaller at higher amplitudes.
Remaining error on the 100 MHz QAM signal.

Absolute amplitude error on the 100 MHz QAM signal; reference and measured signal both scaled to 1.

Non-linearity correction
For the start point of each measurement, the amplitude entries inside the wavetable were set to calculated (ideal) values for each waveform, without including dead-time or simulated amplifier behavior. After the system is turned on, the actual output can be sampled and compared to this ideal signal form. Then, new amplitude and phase entries for the wavetable are estimated by calculating the arithmetic mean for each input amplitude. Also, for each amplitude a phase error can be estimated in a similar fashion. This process can be carried out with any modulated signal, special training sequences are not necessary.
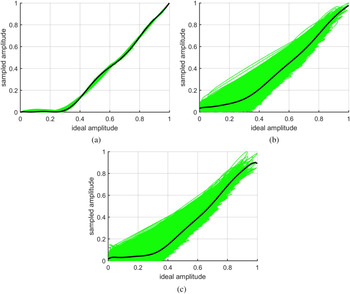
For the 5 MHz signal Fig. 13(a) shows the correspondence of measured versus ideal signal amplitudes. From this data set, it is relatively straight forward to estimate corrected values than can be used in the wavetable. It is also obvious from the graph that the amplifier does not react to short pulses (ideal amplitude < 0.3). In the specific BB signal used here, the amplitude is below 0.3 for 29.9% of the total time. Since the output signal is effectively supressed during this time, this results in a very low ACLR (cp. Fig. 14). After the corrected amplitude values are applied to the wavetable, those waveforms that do not produce any output are not used anymore and all others are rescaled according to the translation given by Fig. 13(a). The resulting AM-AM curve after correction is then linear and the signal shows good ACLR (Fig. 14).
AM-AM base curves as used for the correction algorithm in its first iteration. (a) 5 MHz signal, (b) 100 MHz signal, (c) 5 × 20 MHz signal.

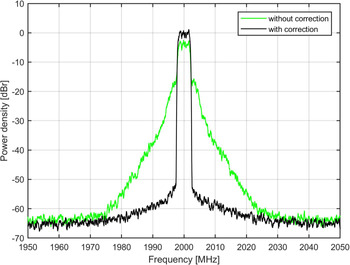
Effect of the parameter correction feature of the modulator.

Figure 13(b) shows exactly the same process for the 100 MHz signal. Here, the interaction of amplitude and phase results in a more broadly scattered plot. Since the phase of each sample is not considered for this plot there are no negative sampled amplitudes. As a consequence the trace of averages cannot reach zero, even if the only signal present at an ideal amplitude of zero is purely measurement noise. To soften out errors that result from the sub-optimal measurement data, the estimated new amplitude values are mixed with the current values of wavetable in a 85(new) to 15(old) ratio. The similarly estimated phase correction values are mixed with the existing values at a 50% ratio. The process is repeated a few times. At each repetition the AM-AM plot narrows down and the ACLR increases.
The last example in Fig. 13(c) shows the same data of the initial run for the 5 × 20 MHz wide signal. Here a special difficulty arises: since amplitudes close to the peak value occur only very rarely, little measurement data is available for corrections. The available data scatters broadly close to peak, eventually resulting in a downwards bend of the estimated amplitude value curve. This bend is then consequently interpreted by the algorithm as a decreasing amplitude for high pulse widths (i.e. effective duty cycle > 50%). Since this behavior is actually possible, for example if the amplifier prolongs all pulses, the use of the wavetable entry with the highest amplitude is disabled and all other entries are re-scaled to provide a full range from 0 to 1. In this case, by visual inspection of the plotted data, it is obvious that this decision is erroneous. This unjustified disabling of waveforms for the highest amplitudes results in a lower peak output power of the overall system, explaining why the average output power of the 5 × 20 MHz in Table 3 is lower than the average output power of the 100 MHz minus the increasement in PAPR. This behavior of the algorithm still needs to be addressed in future research. The difficulty of meeting the same precision as for the other signals has also implications on the in-band errors, eventually showing up as increased EVM figures (cp. Table 3).
Overall, the effect of the parameter correction is very substantial as is proven by the comparison of the two spectral plots for the 5 MHz signal in Fig. 14. Without any correction it starts out barely reaching 15 dB ACLR as a result of the AM-AM curve (Fig. 13(a)) deviating severely from the ideal transfer function. After correction of only the amplitude and phase values of each waveform in the wavetable, 54 dB ACLR are reached. This shows how effective this built-in correction method already is. The plot also shows how the correction influences the average power level. Since without correction each amplitude is projected onto a lower amplitude value than anticipated (cp. Fig. 13(a)) the average output power of the uncorrected signal is to low in the uncorrected state and rises to the expected level only when the new amplitude values are applied.
In laboratory experiments it was found that the correction values remained valid even for measurements that were re-conducted weeks later as long as the temperature of the amplifier does not change. The correction process is executed using samples from the actual transmit signal, special training sequences are not required. Therefore, if required, the process can be rerun in the live system without shutting down the transmission.
Conclusion
A complete all-digital transmitter including a digital PA modulator, a novel switch amplifier MMIC with reduced complexity and a transmit/receive switch is presented. The modulator is able to correct for amplifier non-idealities without the need for an additional DPD. Using this technique, the measurement results using 5 MHz wide 6.5 dB PAPR signals at 900 MHz, as well as 2000 MHz carrier frequency, fulfill the 3GPP ACLR specifications for base stations, even with only a simple lumped-element LC output filter. No bulky high-Q filter technologies are necessary. In the case of the 900 MHz module, final-stage drain efficiency for modulated signals is high (47%) and can reach up to 80% for a full-scale tone. The T/R switch had nearly no influence on the 20 MHz signal except reducing the overall efficiency by a few percentage points. First tests at U3 = 40 V showed 37 dBm output power for a full-scale 900 MHz tone. The 2 GHz module reaches 45 dB ACLR also with the 20 MHz signal. Moreover, 40 dB of ACLR are obtained for a very wideband 100 MHz signal. Overall, the signal chain solution presented here is suitable for various application scenarios. With its extremely compact size it is predestined for any (massive) MIMO application utilizing beam forming techniques to multiple receivers where it can be mounted right underneath each antenna element.
The amplifier MMIC also qualifies as a building block for use in a SDR because of its inherent frequency agility. Since it does not use reactive matching it can operate at any carrier frequency from the 2 GHz band down to DC.
Further research is focusing on correcting the current mismatch of the 0.15 μm process to its simulation models, in order to reach at least comparable levels of efficiency to those achieved with the 0.25 μm GaN-HEMT MMIC PA. Also, an in-depth analysis of the root causes of the remaining amplitude and phase errors, especially for wide bandwidth signals will be undertaken.
Author ORCIDs
Florian Hühn, 0000-0002-6869-0699.
Acknowledgments
This work has been funded by the Leibnitz Association under contract SAW 2015-FBH1 and by the German BMBF in the framework of Forschungsfabrik Mikroelektronik Deutschland under contract 16FMD02.
 Florian Hühn received a Dipl.-Ing. degree in electrical engineering from the University of Bremen in 2011. He is currently a Ph.D. candidate in the microwave department of the Ferdinand-Braun-Institut in Berlin. His research activities focus on modulators for highly efficient switch mode RF power amplifiers and digital microwave PA design.
 Andreas Wentzel received the Dipl.-Ing. and Dr.-Ing. degree in electrical engineering from the Technical University of Berlin, Germany, in 2006 and 2011, respectively. Currently, he is the head of the Digital PA Lab in the III-V-Electronics department of the Ferdinand-Braun-Institut in Berlin. His research activities focus on the design of digital TX architectures including advanced switch-mode power amplifier concepts realized on GaN and InP as well as on optimized modulation schemes and filter structures suitable for this type of PA.
 Wolfgang Heinrich received the diploma, PhD, and habilitation degrees from the Technical University of Darmstadt, Germany. Since 1993, he has been with the Ferdinand-Braun-Institut (FBH) at Berlin, Germany, where he is head of the microwave department and deputy director of the institute. Since 2008, he is also professor at the Technical University of Berlin. His present research activities focus on MMIC design with emphasis on GaN power amplifiers, mm-wave integrated circuits, and electromagnetic simulation. Prof. Heinrich has authored or coauthored more than 350 publications and conference contributions. He has been serving the microwave community in various functions, e.g., as Distinguished Microwave Lecturer for the term 2003–2005, as General Chair of the European Microwave Week in Munich, 2007, and as Associate Editor of the IEEE Transactions on MTT from 2008 until 2010. Since 2010, he is President of the European Microwave Association (EuMA).