
1. Introduction
Shear-enhanced dispersion of a soluble species transported by a background flow with a specific velocity profile has been of interest since the original works by Taylor (Reference Taylor1953, Reference Taylor1954) and the subsequent analysis by Aris & Taylor (Reference Aris and Taylor1956), referenced to today as Taylor–Aris dispersion. Initially, a pressure-driven flow through a circular tube was considered, and the spreading of an initial concentration distribution over time was described by an effective diffusion coefficient. Aris formalized the work by using the method of statistical moments, describing the concentration distribution along the channel axis by its cross-stream-averaged moments. The analysis revealed the well-known  $Pe^{2}$-dependency, where the Péclet number is defined as
 $Pe = U a / D$ with a characteristic velocity
 $U$, a characteristic length scale
 $a$ and the molecular diffusion constant
 $D$.
This paper is concerned with the problem of hydrodynamic dispersion in Hele-Shaw flows with variations of the wall mobility, which could be  $\zeta$ potential variations for electroosmotic flow or variations of the wall slip length for pressure-driven flow. As was shown in a recent series of papers, inhomogeneous
 $\zeta$ potentials at the walls can give rise to internal pressure gradients, leading to pressure-driven backflow. Specifically, Boyko et al. (Reference Boyko, Rubin, Gat and Bercovici2015) demonstrated theoretically that, for the case of non-homogeneous
 $\zeta\!$ potentials at the bounding plates, different height-averaged two-dimensional flow fields can be created based on electroosmotic flow. Experimentally, this principle was implemented by varying the
 $\zeta$ potential based on chemical patterning (Paratore et al. Reference Paratore, Boyko, Kaigala and Bercovici2019b) and by employing gate electrodes below flat (Paratore et al. Reference Paratore, Bacheva, Kaigala and Bercovici2019a; Boyko et al. Reference Boyko, Bacheva, Eigenbrod, Paratore, Gat, Hardt and Bercovici2021) or microstructured surfaces (Dehe et al. Reference Dehe, Rofman, Bercovici and Hardt2020). In a recent publication, this principle was utilized to sort particles by their respective diffusivity (Bacheva et al. Reference Bacheva, Paratore, Rubin, Kaigala and Bercovici2020). The ability to shape the flow field in both space and time enables adaptive, re-configurable microfluidic platforms with multiple functionalities such as mixing, flow guiding and separation. Similarly, pressure-driven Hele-Shaw flows with varying wall slip lengths exhibit flow inhomogeneities. Walls of a microfluidic channel or Hele-Shaw cell with slip-length patterns produce specific flow patterns where the local flow direction differs from that of the globally applied pressure gradient (Hendy, Jasperse & Burnell Reference Hendy, Jasperse and Burnell2005; Six & Kamrin Reference Six and Kamrin2013). The slip length can either originate from the molecular interactions between the liquid and the solid (Lei, Rigozzi & McKenzie Reference Lei, Rigozzi and McKenzie2016), or it can be an effective quantity reflecting the average effect due to a superhydrophobic or liquid-infused surface (Ybert et al. Reference Ybert, Barentin, Cottin-Bizonne, Joseph and Bocquet2007; Schönecker, Baier & Hardt Reference Schönecker, Baier and Hardt2014).
The aforementioned work focuses on the ability to influence the flow field. To widen the application area of Hele-Shaw flows with variations of the wall mobility, a corresponding model for species transport is needed. In order to incorporate all effects considered in previous work, the model derived in this paper accounts for effective electroosmotic mobilities at the walls, as well as slippage effects. The electroosmotic mobility can vary both in space and time at both walls, and the effective slip at the walls can exhibit a spatio-temporal dependency as well. Ultimately, we employ an averaging of the concentration field over the cell height, thereby capturing the three-dimensional (3-D) scenario by a 2-D model. In total, we complement the existing framework of 2-D flow shaping in Hele-Shaw cells with an appropriate species transport model, thus enabling the development of further applications where fluid mixtures are considered, such as in chemistry or bio-medical engineering.
Since the original works by Taylor and Aris, a large number of studies have focused on extending the applicability of dispersion models. The Taylor–Aris solution is restricted to time scales large compared with the typical diffusion time, and in a seminal work, Ananthakrishnan and coworkers (Ananthakrishnan, Gill & Barduhn Reference Ananthakrishnan, Gill and Barduhn1965) presented the regions of validity in a Péclet number–time space. This yielded results on the influence of pulsating flow (Aris Reference Aris1960; Gill, Ananthakrishnan & Nunge Reference Gill, Ananthakrishnan and Nunge1968), on extending the applicability of the solution for short times (Gill et al. Reference Gill, Ananthakrishnan and Nunge1968; Gill, Sankarasubramanian & Taylor Reference Gill, Sankarasubramanian and Taylor1971; Barton Reference Barton1983) or on generalizations to several transport processes in homogeneous and heterogeneous media (Brenner & Edwards Reference Brenner and Edwards1993), among others. Additionally, the role of secondary flow in a plane vertical to the main flow was discussed by Janssen (Reference Janssen1976) in the context of a coiled tube. Especially the influence of oscillatory flow has been of interest. Chatwin (Reference Chatwin1975) analysed the dispersion due to an oscillating pressure gradient and showed that the mean distribution of a contaminant satisfies a diffusion equation with an effective diffusion coefficient with a harmonic time dependence based on twice the driving frequency. Also, he showed that, in the limit of slow oscillations, the dispersion coefficient could be approximated with the steady-state dispersion coefficient. For fast oscillations, the dispersion coefficient sharply decreases with frequency. Following this work, Watson (Reference Watson1983) theoretically analysed the influence of the channel geometry, frequency and Schmidt number, with exact solutions for circular and slit channels. Also, he showed that the dispersive effects of a steady and an oscillatory flow field are additive. Joshi et al. (Reference Joshi, Kamm, Drazen and Slutsky1983) experimentally verified the predicted dispersion laws using a infrared-absorption technique. Smith addressed the issue of dispersion when the oscillation period is smaller than the diffusive time scale based on the channel width (Smith Reference Smith1982). In this case, the oscillatory flow leads to the contraction of dissolved species during one half-cycle of the oscillation period, thus leading to a negative effective diffusion coefficient. Since negative diffusion coefficients lead to infinite concentration values in advection–diffusion equations, he proposed a delay-diffusion equation instead. Alternative efforts to consider oscillating flows include adaptations of the method of moments to account for dispersion due to superposed pulsating pressure gradients and stationary flow, with the solution being applicable to all times after the release of dissolved species (Mukherjee & Mazumder Reference Mukherjee and Mazumder1988). While the aforementioned work focused on oscillatory pressure gradients along a channel, Bandyopadhyay & Mazumder (Reference Bandyopadhyay and Mazumder1999) incorporated the additional effects of wall oscillations in a parallel-plate channel.
In recent years, the research field was revitalized in the context of microfluidic applications, where hydrodynamic dispersion can play a significant role. For example, Kamholz et al. (Reference Kamholz, Weigl, Finlayson and Yager1999) discussed that a T-mixer can exhibit different shapes of diffusive zones, e.g. in the shape of a butterfly or a flat profile. Inhomogeneous velocities lead to varying residence times close to the wall and thus, different extents of the diffusion zone. The varying shapes of diffusive zones were experimentally observed by Ismagilov et al. (Reference Ismagilov, Stroock, Kenis, Whitesides and Stone2000). The influence of flow inhomogeneities in the streamwise direction on hydrodynamic dispersion was analysed by Stone & Brenner (Reference Stone and Brenner1999) for the specific case of a radially extending flow between two plates. Ng (Reference Ng2006) included the effect of wall reactions into a dispersion model of oscillating flow. The influence of the cross-sectional shapes of shallow microchannels on the flow profile and thus the dispersion was analysed by Ajdari, Bontoux & Stone (Reference Ajdari, Bontoux and Stone2006). For microchannels with finite length, Giona et al. (Reference Giona, Adrover, Cerbelli and Garofalo2009) showed the existence of an advection-dominated dispersion regime. Also, apart from the influence of the channel wall, the role of secondary flow was discussed in the context of microfluidic applications by Jiang et al. (Reference Jiang, Drese, Hardt, Küpper and Schönfeld2004), Zhao & Bau (Reference Zhao and Bau2007) and Adrover (Reference Adrover2013). While the aforementioned works were concerned with spatial inhomogeneities, the role of time-dependent flow profiles was discussed by Vedel & Bruus (Reference Vedel and Bruus2012) and Vedel, Hovad & Bruus (Reference Vedel, Hovad and Bruus2014). Here, the authors showed that oscillations can enhance dispersion, given that the oscillation frequency is lower than the momentum and solute diffusion time scale over the channel cross-section.
Apart from rather generic work, hydrodynamic dispersion was also considered in quite specific scenarios involving electroosmotic and pressure-driven flow. Datta & Kotamarthi (Reference Datta and Kotamarthi1990) developed a dispersion model for capillary electrophoresis, accounting for both pressure and electroosmotically driven flow in the limit of small  $\zeta$ potentials. Following, several studies were concerned with a combination of both driving mechanisms through capillaries, focusing on flow driven by large
 $\zeta$ potentials (Griffiths & Nilson Reference Griffiths and Nilson2000), arbitrary cross-sections (Zholkovskij, Masliyah & Czarnecki Reference Zholkovskij, Masliyah and Czarnecki2003; Zholkovskij & Masliyah Reference Zholkovskij and Masliyah2004), flow in the context of capillary zone electrophoresis (Ghosal Reference Ghosal2003), overlapping electric double layers (Zholkovskij et al. Reference Zholkovskij, Yaroshchuk, Masliyah and de Pablo Ribas2010) and slit channels (Zholkovskij, Masliyah & Yaroshchuk Reference Zholkovskij, Masliyah and Yaroshchuk2013). Gleeson & Stone (Reference Gleeson and Stone2004) contributed by analysing the influence of inhomogeneous, randomized
 $\zeta$ potentials at the wall. Also, the effect of adsorption–desorption wall reactions was discussed by Datta & Ghosal (Reference Datta and Ghosal2008). Ng & Zhou (Reference Ng and Zhou2012a) analysed the effects of varying
 $\zeta$ potentials and wall slip, demonstrating enhanced dispersion. Bahga, Bercovici & Santiago (Reference Bahga, Bercovici and Santiago2012) developed a dispersion model in the context of electrokinetic flow in channels with varying cross-sections, including multispecies transport and chemical reactions at equilibrium. Additionally accounting for magnetohydrodynamic forces, Vargas et al. (Reference Vargas, Arcos, Bautista and Méndez2017) derived a dispersion model for a flat plate microchannel, and Muñoz et al. (Reference Muñoz, Arcos, Bautista and Méndez2018) accounted for pulsating electroosmotic flow in the presence of slip. Chu et al. (Reference Chu, Garoff, Przybycien, Tilton and Khair2019) discussed both stationary and oscillatory dispersion in a parallel-plate channel, focusing on the effects of oscillations that can lead to a local negative dispersion coefficient, and the successive problems when the negative dispersion coefficient is inserted into a macrotransport equation. The work referred to above demonstrates that, despite over 60 years of research, open questions concerning hydrodynamic dispersion in various contexts remain to be studied.
Most of the work above considers flow through channels with different cross-sections, where the flow velocity is mainly along a specified direction. This is a result of pressure gradients that are usually applied uniformly along a channel, and electroosmosis due to an electric field applied in a specific direction. Inhomogeneous  $\zeta$ potentials at the walls of Hele-Shaw cells often lead to internal pressure gradients. A notable study on electrokinetic flows in a shallow-channel geometry was performed by Lin, Storey & Santiago (Reference Lin, Storey and Santiago2008), who accounted for variations of the electric conductivity in a depth-averaged model. The spatio-temporal evolution of the conductivity is described by a transport equation. The velocity field is dictated by the electric field strength and the zeta potential at the channel walls which, in turn, depends on the local values of the conductivity. As a result, a dispersion tensor is obtained. A major difference between these studies and the present work lies in the fact that Lin et al. (Reference Lin, Storey and Santiago2008) considered a dispersion mechanism that is governed by the internal dynamics of the system (the re-distribution of ions), whereas we focus on dispersion due to imposed, inhomogeneous boundary conditions at the channel walls.
For Hele-Shaw cells, characterized by small heights compared with lateral extents, extensive work exists on dispersion. For example, in the context of viscous fingering of miscible fluids in Hele-Shaw cells, a model to account for hydrodynamic dispersion was proposed by Zimmerman & Homsy (Reference Zimmerman and Homsy1991), both for isotropic as well as velocity-dependent dispersion. Implicitly, this model assumes the flow to obey the same form of the velocity profile for a given average velocity, e.g. plane Poiseuille flow. Thus, it is unable to account for different flow profiles, as inherent, for example, in the case of superposed electroosmotic and pressure-driven flow of varying magnitude. Another restriction often applied in the modelling is that the driving force of the flow in Hele-Show cells is uniform over the cell. For example, in the experiments of Roht et al. (Reference Roht, Auradou, Hulin, Salin, Chertcoff and Ippolito2015), the effect of an oscillating flow on the dispersion of concentration fields is discussed for the case of an external pressure gradient driving the flow. However, to the best of our knowledge, no dispersion model for inhomogeneous flow in Hele-Shaw cells exists, for example originating from superposed pressure-driven and electroosmotic flow or from an inhomogeneous distribution of the slip length at the boundaries.
The remainder of the paper is organized as follows. In § 2, we derive a dispersion model for a dissolved species by means of a multiple-scale perturbation approach, resulting in a 2-D macrotransport equation. The resulting transport equation describes the long-time evolution of the height-averaged concentration distribution in the Hele-Shaw cell and incorporates the advective–diffusive transport effects over the cell height in a space-dependent, non-isotropic dispersion tensor. In § 3, we formulate the governing equations for a stationary and oscillatory flow field, which we later utilize in the macrotransport problem. In § 4, we demonstrate the application of the dispersion model to the case of sinusoidal variations of the wall mobility, outlining the effects of a superposed constant wall mobility, electric field direction, as well as slip length. In § 5, we compute concentration fields for three test cases both with a 3-D particle-tracking approach and the 2-D model and show good agreement of both approaches. The test cases include a stationary flow field with zero average flow (§ 5.2), an oscillatory flow field with zero average flow (§ 5.3) and a rotary flow field (§ 5.4). Finally, in § 6 we summarize our findings.
2. Dispersion model – multiple-scale perturbation
2.1. Introduction
In this section, we derive a transport equation for a dissolved species in a background fluid flow, as illustrated in figure 1. We consider the flow of a Newtonian, incompressible fluid through a domain that is bound in the  $z$-direction by two parallel plates, located at
 $z=0$ and
 $z=h$. In the
 $x$ and
 $y$ directions, the cell's extension is
 $L_0$. In the following, we will refer to the
 $x$ and
 $y$ directions as in-plane, and to the
 $z$-direction as transversal or cross-stream, due to the fact that the flow velocities are mainly in the
 $x$ and
 $y$-directions. In § 3, the governing equations for the flow will be discussed. For now, we describe the flow by a 3-D flow field, with the velocity components expressed as
 $$\begin{gather} u(x,y,z,t) = \bar{u}(x,y,z) + u' (x,y,z,t) \end{gather}$$
 $$\begin{gather}v(x,y,z,t) = \bar{v}(x,y,z) + v' (x,y,z,t) \end{gather}$$
 $$\begin{gather}w(x,y,z,t) = \bar{w}(x,y,z) + w'(x,y,z,t), \end{gather}$$
where  $u$ and
 $v$ are parallel to the bounding walls, and
 $w$ normal to these. Each velocity component can be decomposed into steady-state and fluctuating parts, denoted by
 $\overline {(\cdot )}$, and
 $(\cdot )'$, respectively. For now, we will continue with the unspecified expressions
 $u'$,
 $v'$,
 $w'$, only requiring that the signal is periodic with period
 $T_{osc} = 1/f$. The steady-state part of the flow field can be obtained by time averaging the flow field over one period of oscillation, as will be introduced in detail in § 2.3. In general, the oscillation can be composed of multiple frequencies, which depend on the mechanism of fluid actuation.
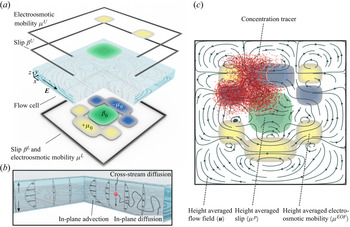
Illustration of a Hele-Shaw cell geometry under electric field actuation. (a) The upper and lower walls are separated by a spacing  $h$, and can both exhibit non-uniform electroosmotic mobilities
 $\mu$ as well as slip lengths
 $\beta$. The resulting flow field is non-homogeneous. (b) A dissolved species, here represented by a single molecule, is transported by cross-stream diffusion and in-plane advection as well as diffusion. (c) Two-dimensional representation of the system. A concentration field distribution (red) gets dispersed over the Hele-Shaw cell. The effects of velocity inhomogeneities over the cell height are included in the dispersion matrix
 ${\boldsymbol{\mathsf{D}}}$, resulting in a two-dimensional model.

The transport of a dissolved species inside such a flow field is driven by advection with the background flow velocity, as well as by molecular diffusion due to Brownian motion of the molecules, as shown in figure 1(b). Assuming a sufficiently low species concentration as well as impermeable walls and no sources or sinks of concentration, e.g. due to chemical reactions or adsorption processes, the transport is governed by the 3-D advection–diffusion equation
 \begin{equation} \frac{\partial c}{\partial t} + u \frac{\partial c}{\partial x} + v \frac{\partial c}{\partial y} + w \frac{\partial c}{\partial z} = D \left( \frac{\partial^{2} c}{\partial x^{2}} +\frac{\partial^{2} c}{\partial y^{2}} +\frac{\partial^{2} c}{\partial z^{2}} \right), \end{equation}
where  $D$ denotes the coefficient of molecular diffusion of the species, and
 $c$ the molecular concentration. While the specific boundary conditions at the outer perimeter of the cell in
 $x$,
 $y$-directions depend on the problem under study and are not important for the derivation of the transport model, we can impose the impermeability wall boundary condition at the upper and lower wall as
 \begin{equation} \frac{\partial c}{\partial z} = 0 \quad \text{at} \ z = 0,h. \end{equation}
While (2.2) represents the transport equation for the full problem, solving it for extended fluid domains can be computationally very demanding, since in all three dimensions the processes occurring on the smallest scales need to be resolved. Especially when solving transient problems, it can become impractical to compute the time evolution of the concentration field in a reasonable time. Therefore, we develop a reduced-order model that captures the processes on the small scales such that only the macro scales have to be resolved. In figure 1(c), the corresponding 2-D model of the system depicted in figure 1(a) is represented schematically.
In order to apply the multiple-scale perturbation approach, the micro- and macroscales, and thus the different time scales, need to be identified (Mei & Vernescu Reference Mei and Vernescu2010). In agreement with previous work on hydrodynamic dispersion in channels (Chu et al. Reference Chu, Garoff, Przybycien, Tilton and Khair2019), we here identify the length and time scales in a fluid domain with a typical length scale in the  $x$ and
 $y$-directions
 $L$ much larger than the channel height
 $h$. It is important to note that the in-plane scale
 $L$ is due to an inhomogeneity of the flow domain on this scale, not necessarily identical to the side length of the cell. This yields a small parameter
 \begin{equation} \epsilon = \frac{h}{L} \ll 1, \end{equation}
which we will use in the perturbation analysis.
The species transport in the considered Hele-Shaw cells results in three distinct time scales. We assume that the shortest time scale is due to the diffusion in cross-stream direction, which is of the order
 \begin{equation} T_{dif,h} = O \left( \frac{h^{2}}{D} \right) = O (T_{osc}). \end{equation}
Here, in analogy to Chu et al. (Reference Chu, Garoff, Przybycien, Tilton and Khair2019), the oscillation of the flow field is considered to occur on the order of the smallest time scales, for the case that the flow field has an oscillatory component. This assumption is supported by an order-of-magnitude comparison to recent results on the topic of flow shaping, where channel heights of the order of  $10^{-5}$ m were used, which in conjunction with diffusion coefficients of
 $10^{-9}$ m
 $^{2}$ s
 $^{-1}$ leads to
 $T_{dif,h} = \mathit {O} ( 10^{-1}$ s), coinciding with reported oscillatory frequencies (Paratore et al. Reference Paratore, Bacheva, Kaigala and Bercovici2019a; Dehe et al. Reference Dehe, Rofman, Bercovici and Hardt2020).
The second time scale of the system can be identified as the time scale of advection along the in-plane inhomogeneity scale  $L$, resulting in
 \begin{equation} T_{adv} = O \left( \frac{L}{U_{c}} \right) = O \left( \frac{h}{W_{c}} \right) = \frac{T_{dif,h}}{\epsilon}. \end{equation}
Here,  $U_{c}$ and
 $W_{c}$ are typical in-plane and transverse velocities, respectively. The relation of the time scales of advection in the streamwise and transverse directions can be inferred from an order-of-magnitude analysis of the continuity equation, as shown in Appendix B.
The third time scale is the diffusive time scale across the inhomogeneity scale  $L$, yielding
 \begin{equation} T_{dif,L} = O \left( \frac{L^{2}}{D} \right) = \frac{T_{dif,h}}{\epsilon^{2}}. \end{equation}
Having identified all relevant time scales of the problem, a hierarchy of time variables can be defined, which we will use to perform a perturbation analysis
 \begin{equation} t_0 = t, \quad t_1 = \epsilon t, \quad t_2 = \epsilon^{2} t. \end{equation}
Before we proceed, we non-dimensionalize the advection–diffusion equation (2.2). The spatial coordinates can be rescaled by the typical length scales  $L$ and
 $h$ for the
 $x$ and
 $y$, and
 $z$ directions, respectively, and the velocities by their characteristic velocities
 $U_{c}$ and
 $W_{c}$. The concentration can be rescaled by a typical concentration
 $c_0$, and the time by the diffusive time scale
 $T_{dif,h}$, resulting in
 $$\begin{gather} \frac{\partial \hat{c}}{\partial \hat{t}} + \epsilon Pe \left( \frac{\partial \hat{c}}{\partial \hat{x}} + \frac{\partial \hat{c}}{\partial \hat{y}} + \frac{\partial \hat{c}}{\partial \hat{z}} \right) = \epsilon^{2} \left( \frac{\partial^{2} \hat{c}}{\partial \hat{x}^{2}} +\frac{\partial^{2} \hat{c}}{\partial \hat{y}^{2}} \right) +\frac{\partial^{2} \hat{c}}{\partial \hat{z}^{2}}, \end{gather}$$
 $$\begin{gather}\frac{\partial \hat{c}}{\partial \hat{z}} = 0 \quad \text{at} \ \hat{z} = 0,1. \end{gather}$$
Here, the hatted variables represent non-dimensionalized quantities, and  $Pe$ represents the Péclet number, herein defined as
 $Pe = U_{c} h / D$. The advection–diffusion equation (2.9) is representative of the full problem, and in the following, we will reduce it to an effective 2-D model, governing the long-time behaviour of the full problem, following the approach by Chu et al. (Reference Chu, Garoff, Przybycien, Tilton and Khair2019).
First, we utilize the time scales defined in (2.8a–c) to expand the time derivative as
 \begin{equation} \frac{\partial}{\partial t} = \frac{\partial}{\partial t_0} + \epsilon\frac{\partial}{ \partial t_1} +\epsilon^{2} \frac{\partial}{ \partial t_2}. \end{equation}
For brevity, in what follows we have dropped the hats and all variables will be non-dimensional. The concentration field can be expanded in  $\epsilon$ as (Fife & Nicholes Reference Fife and Nicholes1975)
 \begin{align} c(x,y,z,t) &= c^{(0)}(x,y,z,t_0,t_1,t_2) + \epsilon c^{(1)}(x,y,z,t_0,t_1, t_2) \nonumber\\ &\quad + \epsilon^{2} c^{(2)}(x,y,z,t_0,t_1, t_2) + O (\epsilon^{3}). \end{align}
Inserting (2.11) and (2.12) into the governing equation (2.9) and boundary condition (2.10) results in a set of equations of different orders in  $\epsilon$. We will consider them in increasing order, to build up a macroscale transport equation. Before we derive the macrotransport equation, it is important to note that the components
 $c^{(1)}$ and
 $c^{(2)}$ are assumed to be fluctuating components, with vanishing average over the channel height, when averaged over one oscillation period. The details of this rationale will be outlined and justified during the derivation of the macrotransport equation. Additionally, in § 2.4 we will sketch how the derivation would change if this assumption was not introduced.
2.2. Leading-order perturbation:  $\mathit {O} = ( \epsilon ^{0} )$

The leading-order approximation results in
 $$\begin{gather} \frac{\partial c^{(0)}}{\partial t_0} = \frac{\partial^{2} c^{(0)}}{\partial z^{2}}, \end{gather}$$
 $$\begin{gather}\frac{\partial c^{(0)}}{\partial z} = 0 \quad \text{at } z = 0,1. \end{gather}$$
The solution to (2.13) under the boundary condition (2.14) can be expressed as a infinite series of the form
 \begin{equation} c^{(0)} = c^{(0)}_0 (x,y,t_1,t_2) + \sum_{n=1}^{\infty} c^{(0)}_n(x,y,t_1,t_2) \ \textrm{e}^{{-}n^{2}{\rm \pi}^{2} t_0} \cos (n{\rm \pi} z). \end{equation}
If the initial distribution  $c^{(0)}$ depends on
 $z$, the
 $z$-dependent terms decay over a time scale
 $t_0$ due to the factor
 $\textrm {e}^{-n^{2}{\rm \pi} ^{2} t_0}$, and are thus irrelevant for the long-term solution. Therefore, it is legitimate to drop the dependence on
 $t_0$ and utilize
 \begin{equation} c^{(0)} = c^{(0)}_0 (x,y,t_1,t_2). \end{equation}
The independence of  $c^{(0)}$ from the transverse coordinate
 $z$ indicates that it represents the cross-stream average of the concentration.
2.3. First-order perturbation: $\mathit {O} = ( \epsilon ^{1} )$

The first-order perturbation of (2.9) under the boundary condition (2.10) yields
 $$\begin{gather} \frac{\partial c^{(0)}}{\partial t_1} + \frac{\partial c^{(1)}}{\partial t_0} + Pe \,u \frac{\partial c^{(0)}}{\partial x} + Pe\, v \frac{\partial c^{(0)}}{\partial y}= \frac{\partial^{2} c^{(1)}}{\partial z^{2}}, \end{gather}$$
 $$\begin{gather}\frac{\partial c^{(1)}}{\partial z} = 0 \quad \text{at } z = 0,1. \end{gather}$$
In order to derive the macroscale transport equation, let us introduce the time average over one period of oscillation (on the short time scale) as
 \begin{equation} \overline{({\cdot})} = \frac{1}{T_{osc}} \int_{t_0}^{t_0 + T_{osc}} ({\cdot}) \,\mathrm{d} t_0, \end{equation}
and the transverse average as
 \begin{equation} \langle ({\cdot}) \rangle = \int_0^{1} ({\cdot}) \,\mathrm{d} z. \end{equation}
Applying now both the time and transverse average to (2.17) leads to an equation for  $c^{(0)}$ on time scale
 $t_1$ as
 \begin{equation} \frac{\partial c^{(0)}}{\partial t_1} + Pe \langle \bar{u} \rangle \frac{\partial c^{(0)}}{\partial x} + Pe \langle \bar{v} \rangle \frac{\partial c^{(0)}}{\partial y}= 0, \end{equation}
where the term on the right-hand side vanishes due to the time average of the boundary condition (2.18), and the second term on the left-hand side due to the averaging over a fluctuating component, as discussed in the preceding section. Physically, this equation demonstrates that the development of the height-averaged concentration  $c^{(0)}$ is driven by the advection with the average flow velocity, in accordance with our initial assumptions in § 2.1.
In order to obtain  $c^{(1)}$, we can subtract (2.21) from (2.17), insert (2.1), resulting in an expression for
 $c^{(1)}$ as
 \begin{equation} \frac{\partial c^{(1)}}{\partial t_0} + Pe ( ( \bar{u} - \langle \bar{u} \rangle ) + u' ) \frac{\partial c^{(0)}}{\partial x} + Pe ( (\bar{v} - \langle \bar{v} \rangle ) + v' ) \frac{\partial c^{(0)}}{\partial y}= \frac{\partial^{2} c^{(1)}}{\partial z^{2}}. \end{equation}
This equation can be interpreted as the governing equation for the cross-stream concentration variation  $c^{(1)}$, which is driven by velocity variations over the channel height, relative to the time and transverse average. It is visible that two contributions drive the system. One is due to the time-averaged velocity differences over the channel height
 $(\bar {u} - \langle \bar {u} \rangle ,\bar {v} - \langle \bar {v} \rangle )$, and the other one due to the oscillatory velocities (
 $u',v'$). Due to the linearity of the equation,
 $c^{(1)}$ is expected to consist of a stationary part and an oscillatory part, and (2.22) suggests the form
 \begin{equation} c^{(1)} = Pe ( \boldsymbol{a}(x,y,z) + \boldsymbol{b}(x,y,z,t_0) ) \boldsymbol{\cdot} \boldsymbol{\nabla}_\parallel c^{(0)}. \end{equation}
Here, we have introduced the streamwise gradient  $\boldsymbol {\nabla }_\parallel = (\partial /\partial x, \partial / \partial y)$ to simplify notation. Based on the assumption that
 $c^{(1)}$ is a fluctuation quantity, contributions from the general solution of the homogeneous equation were neglected in the above ansatz.
The stationary solution  $\boldsymbol {a}$ and the oscillatory solution
 $\boldsymbol {b}$ are governed by two separate problems, which we can obtain by inserting (2.23) into (2.22), and separating the stationary problem and the oscillatory problem. The corresponding boundary conditions for
 $\boldsymbol {a}$ and
 $\boldsymbol {b}$ are found by inserting (2.23) into the boundary condition (2.18). The problem associated with the steady-state term then reads
 \begin{equation} \begin{pmatrix} \bar{u} - \langle \bar{u} \rangle\\ \bar{v} - \langle \bar{v} \rangle \end{pmatrix}= \frac{\partial^{2} \boldsymbol{a}}{\partial z^{2}}, \quad \text{with} \ \frac{\partial \boldsymbol{a}}{\partial z} = 0 \ \text{at} \ z = 0,1. \end{equation}
From the structure of (2.24), we can see that the solution is not unique. If  $\boldsymbol {a}^{(1)}$ is a solution of (2.24), then
 $\boldsymbol {a}^{(1)} + \boldsymbol {C}(x,y)$ satisfies the equation as well, where
 $\boldsymbol {C}(x,y)$ is an arbitrary function depending on
 $x$,
 $y$ only. Therefore, in order to render the solution unique, we can impose the additional condition
 $\langle \boldsymbol {a} \rangle = \boldsymbol {0}$. As we have pointed out in § 2.1,
 $c^{(1)}$ is expected to be a fluctuating quantity, and by imposing the aforementioned condition, we ensure that the stationary component of (2.23) satisfies this condition.
In a similar manner, the unsteady problem associated with  $\boldsymbol {b}$ is obtained as
 \begin{equation} \frac{\partial \boldsymbol{b}}{\partial t_0} + \begin{pmatrix} u'\\ v' \end{pmatrix} = \frac{\partial^{2} \boldsymbol{b}}{\partial z^{2}}, \quad \text{with} \ \frac{\partial \boldsymbol{b}}{\partial z} = 0 \ \text{at} \ z = 0,1. \end{equation}
As we can see, this equation does not uniquely define  $\boldsymbol {b}$. If
 $\boldsymbol {b^{(1)}}$ is a solution to (2.25), then
 $\boldsymbol {b^{(1)}} + \boldsymbol {D}(x,y)$ is a solution as well, where
 $\boldsymbol {D}(x,y)$ is an arbitrary function depending on
 $x$ and
 $y$ only. In order to render the solution unique, we impose the additional condition
 $\langle \bar {\boldsymbol {b}} \rangle = \boldsymbol {0}$. In analogy to the additional condition for
 $\boldsymbol {a}$, we ensure that
 $c^{(1)}$ is a fluctuating component, vanishing upon time and height averaging. The solutions to both boundary value problems (2.24) and (2.25) depend on the specific flow field and, for now, we will keep it in the general form. We will discuss some specific solutions in § 5. For now, we just assume that we have solved for
 $\boldsymbol {a}$ and
 $\boldsymbol {b}$, and thus determined
 $c^{(1)}$, allowing us to move on to the second-order perturbation.
2.4. Second-order perturbation: $\mathit {O} = ( \epsilon ^{2} )$

For the order  $\mathit {O} = ( \epsilon ^{2} )$, we first identify the governing equation as
 \begin{align} &\frac{\partial c^{(0)}}{\partial t_2} + \frac{\partial c^{(1)}}{\partial t_1} + \frac{\partial c^{(2)}}{\partial t_0} + Pe \left( u \frac{\partial c^{(1)}}{\partial x} + v \frac{\partial c^{(1)}}{\partial y} + w \frac{\partial c^{(1)}}{\partial z} \right)\nonumber\\ &\quad = \frac{\partial^{2} c^{(0)}}{\partial x^{2}} + \frac{\partial^{2} c^{(0)}}{\partial y^{2}} +\frac{\partial^{2} c^{(2)}}{\partial z^{2}}, \end{align}
and the boundary conditions as
 \begin{equation} \frac{\partial c^{(2)}}{\partial z} = 0 \quad \text{at } z = 0,1. \end{equation}
As we can see from (2.26),  $c^{(2)}$ exhibits an ambiguity as well. In analogy to
 $\boldsymbol {a}$ and
 $\boldsymbol {b}$, we impose the additional restriction that
 $c^{(2)}$ is a fluctuation quantity, i.e.
 $\langle \overline {c^{(2)}} \rangle = 0$. Thus, the time and transverse average of the third term of (2.26) disappears.
Our choice of the additional conditions to render the solutions unique becomes more clear in retrospect, since now  $c^{(0)}$ represents the long-term, cross-stream average of the concentration distribution. The components
 $c^{(i)}$ for
 $i\geq 1$ are fluctuating components that vanish upon transverse and time averaging (Mei, Auriault & Ng Reference Mei, Auriault and Ng1996; Chu et al. Reference Chu, Garoff, Przybycien, Tilton and Khair2019). If we had chosen different constraints for
 $\boldsymbol {a}$,
 $\boldsymbol {b}$ and
 $c^{(2)}$, leading to a non-vanishing time and height average of
 $c^{(1)}$ or
 $c^{(2)}$, we could carry out the derivation including these additional terms. As a result,
 $c^{(0)}$ would not represent the long-time height average, but we would have to use the fact that
 $\langle \bar {c} \rangle = \langle \overline {c^{(0)}} \rangle + \epsilon \langle \overline {c^{(1)}} \rangle +\epsilon ^{2} \langle \overline {c^{(2)}} \rangle$ to rewrite the final macrotransport equation. In the current derivation, we obtain the macrotransport equation in terms of
 $c^{(0)}$, thus simplifying it significantly.
The details of the simplification of the terms in (2.26) can be looked up in Appendix A. Inserting (A3), (A4) and (A5) into (2.26) leads to
 \begin{align} &\frac{\partial c^{(0)}}{\partial t_2} + Pe^{2} \left( \left\langle \bar{u} \frac{\partial \boldsymbol{a}}{\partial x} \right\rangle + \left\langle \bar{v} \frac{\partial \boldsymbol{a}}{\partial y} \right\rangle + \left\langle \bar{w} \frac{\partial \boldsymbol{a}}{\partial z} \right\rangle + \left\langle \overline{u' \frac{\partial \boldsymbol{b}}{\partial x}} \right\rangle + \left\langle \overline{v' \frac{\partial \boldsymbol{b}}{\partial y}} \right\rangle + \left\langle \overline{w' \frac{\partial \boldsymbol{b}}{\partial z}} \right\rangle \right) \boldsymbol{\cdot} \boldsymbol{\nabla}_\parallel c^{(0)} \nonumber\\ &\qquad + Pe^{2} \left( \langle \bar{u} \boldsymbol{a}\rangle \boldsymbol{\cdot} \frac{\partial \boldsymbol{\nabla}_\parallel c^{(0)}}{\partial x} + \langle \bar{v} \boldsymbol{a}\rangle \boldsymbol{\cdot} \frac{\partial \boldsymbol{\nabla}_\parallel c^{(0)}}{\partial y} + \langle \overline{u' \boldsymbol{b}}\rangle \boldsymbol{\cdot} \frac{\boldsymbol{\nabla}_\parallel c^{(0)}}{\partial x} +\langle \overline{v' \boldsymbol{b}}\rangle \boldsymbol{\cdot} \frac{\boldsymbol{\nabla}_\parallel c^{(0)}}{\partial y}\right) \nonumber\\ &\quad=\nabla_\parallel^{2} c^{(0)}. \end{align}
2.5. Final macrotransport equation
The final macrotransport equation is obtained by adding (2.28) multiplied by  $\epsilon ^{2}$ to (2.21) multiplied by
 $\epsilon$ and using
 $t_i = \epsilon ^{i} t$. This results in
 \begin{align} &\frac{\partial c^{(0)}}{\partial t} + (\epsilon Pe \langle \bar{\boldsymbol{u}}_\parallel \rangle + \epsilon^{2} Pe^{2} ( \boldsymbol{k}_{stat} + \boldsymbol{k}_{osc} ))\boldsymbol{\cdot} \boldsymbol{\nabla}_\parallel c^{(0)}\nonumber\\ &\quad = \epsilon^{2} (\boldsymbol{\nabla}_\parallel \boldsymbol{\cdot} [ ( {\boldsymbol{\mathsf{I}}} - Pe^{2} {\boldsymbol{\mathsf{D}}} ) \boldsymbol{\cdot} \boldsymbol{\nabla}_\parallel c^{(0)}]), \end{align}
where we have subsumed the velocity components in the  $x$ and
 $y$-directions into
 $\bar {\boldsymbol {u}}_\parallel = (\bar {u},\bar {v})$. Here,
 $\boldsymbol {k}_{stat}$ and
 $\boldsymbol {k}_{osc}$ denote advection-correction terms due to the stationary flow field and the oscillatory flow field, respectively,
 ${\boldsymbol{\mathsf{I}}}$ denotes the identity matrix and
 ${\boldsymbol{\mathsf{D}}}$ the dispersion tensor. The advection-correction terms are given as
 \begin{equation} \boldsymbol{k}_{stat} ={-}\left\langle \frac{\partial \bar{u}}{\partial x} \boldsymbol{a} \right\rangle -\left\langle \frac{\partial \bar{v}}{\partial y} \boldsymbol{a} \right\rangle +\left\langle \bar{w} \frac{\partial \boldsymbol{a}}{\partial z} \right\rangle \end{equation}
and
 \begin{equation} \boldsymbol{k}_{osc} ={-}\left\langle \overline{ \frac{\partial u'}{\partial x} \boldsymbol{b} } \right\rangle -\left\langle \overline{ \frac{\partial v'}{\partial y} \boldsymbol{b} } \right\rangle + \left\langle \overline{w' \frac{\partial \boldsymbol{b}}{\partial z} } \right\rangle, \end{equation}
and the dispersion tensor is given as
 \begin{equation} {\boldsymbol{\mathsf{D}}} = {\boldsymbol{\mathsf{D}}}_{stat} + {\boldsymbol{\mathsf{D}}}_{osc} =\begin{bmatrix} \langle \bar{u} a_x \rangle & \langle \bar{v} a_x \rangle \\ \langle \bar{u} a_y \rangle & \langle \bar{v} a_y \rangle \end{bmatrix} + \begin{bmatrix} \langle \overline{u' b_x}\rangle & \langle \overline{v' b_x}\rangle \\ \langle \overline{u' b_y}\rangle & \langle \overline{v' b_y}\rangle \end{bmatrix}. \end{equation}
Note that the subscripts  $x$,
 $y$ denote vector components of
 $\boldsymbol {a}$ and
 $\boldsymbol {b}$.
Only the spatial coordinates  $x$ and
 $y$ enter the macroscale transport equation (2.29), and the time-averaged effects due to cross-stream transport are contained in the transport coefficients (2.30, 2.31 and 2.32). Once the problems (2.24) and (2.25) have been solved, all coefficients of (2.29) are determined. The different terms can be interpreted as advection with the mean flow (second term on the left-hand side), an advection-correction term due to the variation of the flow with
 $z$ for stationary (
 $\boldsymbol {k}_{stat}$) and oscillatory flow (
 $\boldsymbol {k}_{osc}$), molecular diffusion (first term on right-hand side) and Taylor–Aris dispersion due to stationary (
 ${\boldsymbol{\mathsf{D}}}_{stat}$) and oscillatory (
 ${\boldsymbol{\mathsf{D}}}_{osc}$) flow. Similarly to previously reported dispersion models (e.g. Watson Reference Watson1983), the dispersion effects due to the stationary and the oscillatory component are additive. Also, the dispersion tensor exhibits a pre-factor
 $-Pe^{2}$, which we have to keep in mind when discussing the dispersion in specific flow fields in §§ 4 and 5. In addition to the derivation presented here, a similar equation can be derived using scaling arguments, following the classical analysis of Taylor–Aris dispersion. This alternative derivation is presented in the supplementary material (see supplementary material available at https://doi.org/10.1017/jfm.2021.648) for the case of stationary flow.
2.6. Thermodynamic consistency of the dispersion tensor
In order to fulfil the second law of thermodynamics, the dispersion tensor  ${\boldsymbol{\mathsf{I}}}-Pe^{2}{\boldsymbol{\mathsf{D}}}$ (2.32) has to be positive definite. As we have discussed, a dispersion tensor can instantaneously exhibit negative eigenvalues when the flow contracts a concentration field (Smith Reference Smith1982). The time-averaged dispersion tensor, however, has to be positive definite, in order to be able to apply (2.29) without the occurrence of singularities in the concentration.
A positive definite tensor  ${\mathsf{A}}_{ij}$ fulfils the condition
 $\chi _i {\mathsf{A}}_{ij}\chi _j>0$ (in index notation, using the Einstein summation convention), where
 $\boldsymbol {\chi }$ represents an arbitrary vector. We have to show that
 \begin{equation} \chi_i (\delta_{ij}-Pe^{2} ({\mathsf{D}}_{\text{stat},ij} + {\mathsf{D}}_{\text{stat},ij})) \chi_j>0 \end{equation}
is satisfied, where the identity tensor is expressed by the Kronecker delta  $\delta_{ij}$. The first term is positive definite, as
 $\chi _i \delta_{ij} \chi _j=(\chi _k )^{2}>0$.
In order to evaluate the stationary dispersion component, we rewrite  ${\boldsymbol{\mathsf{D}}}_{stat}$ as
 \begin{equation} {\mathsf{D}}_{stat,ij} = \langle \overline{u}_i a_j \rangle = \langle a_j ( \overline{u}_i - \langle\overline{u}_i \rangle ) \rangle = \left\langle a_j \frac{\partial^{2} a_i}{\partial z^{2}} \right\rangle , \end{equation}
where we have used (2.24). Integration by parts and using the boundary condition from (2.24) leads to
 \begin{equation} \left\langle a_j \frac{\partial^{2} a_i}{\partial z^{2}} \right\rangle = \left[ \frac{\partial a_i}{\partial z} a_j \right]_{z=0}^{1} - \left\langle \frac{\partial a_j}{\partial z} \frac{\partial a_i}{\partial z} \right\rangle ={-} \left\langle \frac{\partial a_j}{\partial z} \frac{\partial a_i}{\partial z} \right\rangle. \end{equation}
Then, we can show that the stationary component is positive semi-definite,
 \begin{align} \chi_i (- Pe^{2} {\mathsf{D}}_{\text{stat},ij}) \chi_j &= Pe^{2} \chi_i \left\langle \frac{\partial a_i}{\partial z} \frac{\partial a_j}{\partial z} \right\rangle \chi_j = Pe^{2} \left\langle \chi_i \frac{\partial a_i}{\partial z} \chi_j \frac{\partial a_j}{\partial z} \right\rangle \nonumber\\ &= Pe^{2} \left\langle \left( \frac{\partial a_k}{\partial z} \chi_k \right)^{2} \right\rangle \geq 0, \end{align}
becoming zero only if  $\boldsymbol {a}$ vanishes everywhere. This case corresponds to the situation of vanishing dispersion.
Next, we rewrite the oscillatory component as
 \begin{equation} {\mathsf{D}}_{osc,ij}= \langle \overline{b_i u'_j } \rangle = \left\langle\overline{ b_i \left(-\frac{\partial b_j}{\partial t_0} + \frac{\partial^{2} b_j}{\partial z^{2}} \right) } \right\rangle ={-}\left\langle\overline{ b_i \frac{\partial b_j}{\partial t_0}} \right\rangle + \left\langle\overline{ b_i \frac{\partial^{2} b_j}{\partial z^{2}} } \right\rangle, \end{equation}
where we have used (2.25). Analogously to the stationary component, we can show that the second term on the right-hand side is positive semi-definite. The first term of (2.37) inserted into (2.33) leads to
 \begin{align} \chi_i \left\langle - \overline{b_j \frac{\partial b_j}{\partial t_0}} \right\rangle \chi_j &={-}\left\langle\overline{\frac{1}{2}\chi_x^{2} \frac{\partial b_x^{2}}{\partial t_0}} \right\rangle - \left\langle\overline{\frac{1}{2}\chi_y^{2} \frac{\partial b_y^{2}}{\partial t_0}} \right\rangle - \left\langle\chi_x \chi_y\overline{ \frac{\partial b_x}{\partial t_0} b_y} + \chi_x \chi_y\overline{\frac{\partial b_y}{\partial t_0} b_x } \right\rangle\nonumber\\ &={-}\left\langle\overline{\frac{1}{2}\chi_x^{2} \frac{\partial b_x^{2}}{\partial t_0}} \right\rangle - \left\langle\overline{\frac{1}{2}\chi_y^{2} \frac{\partial b_y^{2}}{\partial t_0}} \right\rangle\nonumber\\ &\quad - \left\langle\chi_x \chi_y \left( \frac{1}{T_{osc}}[b_x b_y ]_{t_0}^{t_0+T_{osc}} -\overline{ \frac{\partial b_y}{\partial t_0} b_x } + \overline{\frac{\partial b_y}{\partial t_0} b_x } \right)\right\rangle =0. \end{align}
Keeping in mind that  $\boldsymbol {b}$ is an oscillatory function, as follows from the definition (2.25), we see that the final expression vanishes. Collecting all contributions, it follows that the condition (2.33) is satisfied, leading to a positive definite dispersion tensor.
3. Flow in a Hele-Shaw cell
After introducing the macrotransport equation in the preceding section, we now turn our attention towards the structure of the flow field in order to discuss and validate the model. The dispersion model was derived independently of the specific structure of the flow field, thus rendering it universal within its limits of applicability. Our research, however, was motivated by a specific class of flow fields, namely inhomogeneous Hele-Shaw flows. As we have outlined in the introduction, the potential of shaping the flow inside a Hele-Shaw cell by modifying the electroosmotic mobility at the wall was discussed in a series of recent papers. For modifying the wall mobility with gate electrodes, it has been shown to be beneficial to drive the fluid with an oscillatory signal, in order to minimize the contributions due to native  $\zeta$ potentials (Paratore et al. Reference Paratore, Bacheva, Kaigala and Bercovici2019a; Bacheva et al. Reference Bacheva, Paratore, Rubin, Kaigala and Bercovici2020; Dehe et al. Reference Dehe, Rofman, Bercovici and Hardt2020). Both the voltage at the gate electrodes as well as the driving field are oscillatory, and thus a time-averaged flow can be induced. This constitutes a part of the motivation to consider an oscillatory component of the velocity field in the following.
In order to utilize the transport equation derived in the preceding section, we require expressions for the time-averaged flow field ( $\bar {u}$,
 $\bar {v}$,
 $\bar {w}$), the
 $z$- and time-averaged flow field (
 $\langle \bar {u}\rangle$,
 $\langle \bar {v}\rangle$,
 $\langle \bar {w}\rangle$) as well as the oscillatory component of the flow field (
 $u'$,
 $v'$,
 $w'$). For this purpose, we adapt the derivation outlined by Boyko et al. (Reference Boyko, Rubin, Gat and Bercovici2015) with modified wall boundary conditions, similarly to the derivation presented by Rubin et al. (Reference Rubin, Tulchinsky, Gat and Bercovici2017) in the context of elastic deformations. In that context, different from previous work, we explicitly decompose the resulting governing equations into a stationary and an oscillatory component. Thereby, we enable using the resulting flow field in the macrotransport equation (2.29). For brevity, in the following we present the main steps that differ from the aforementioned work, with a more detailed derivation provided in the Appendix B.
We consider the same system as in § 2.1, a flow cell with constant distance  $h$ between the bounding plates without imposing specific boundary conditions at the outer perimeter of the flow cell. In this derivation, we rely on the assumption that the cell height
 $h$ is much larger than the thickness of the electric double layer
 $\lambda _{D}$, thus allowing us to incorporate the effects of an external driving field into an effective boundary condition, the so-called Helmholtz–Smoluchowski velocity. Therefore, the upper and lower walls are assumed to have varying electroosmotic mobilities, resulting in a slip velocity
 $\boldsymbol {u}_{slip} = \mu (x,y,t) \boldsymbol {E}(t)$. The mobilities can vary both in space (e.g. due to chemical patterning) and in time (e.g. due to changing electrode potentials).
In order to incorporate effects of different surface materials, it is also assumed that the surface exhibits some (effective) slip length  $\beta$. This enables, for example, the incorporation of slipping effects over hydrophobic flat surfaces, or the modelling of superhydrophobic surfaces, exhibiting an effective, isotropic slip length. Via the Navier-slip boundary condition
 $\beta \partial \boldsymbol {u}_\parallel / \partial z = \boldsymbol {u}_\parallel$ the slip velocity is related to the velocity gradient normal to the surface. Also, the slip length on both surfaces can exhibit a spatial dependence, while there is usually no time dependence. The wall boundary conditions take the form
 \begin{equation} \boldsymbol{u}^{L,U}_\parallel{=} \mu^{L,U}(x,y,t) \boldsymbol{E}_\parallel{+} \beta^{L,U} (x,y) ( \boldsymbol{n}^{L,U} \boldsymbol{\cdot} \boldsymbol{e}_z) \left.\frac{\partial \boldsymbol{u}_{{\parallel}} }{\partial z } \right\vert_{z=0}, \quad \boldsymbol{u}^{L,U}_\perp{=} 0, \end{equation}
where we have indicated the projection to the  $x$–
 $y$-plane by
 $\parallel$ and the
 $z$-component by
 $\perp$,
 $\boldsymbol {E}$ denotes the driving electric field,
 $\boldsymbol {n}^{L,U}$ the wall normal vector at the lower and upper walls, respectively, and
 $\boldsymbol {e}_z$ the unit vector in
 $z$-direction.
At this point, it is important to discuss some of the properties of the boundary conditions. First, it is important to note that the mobility fields  $\mu ^{L}$,
 $\mu ^{U}$ can exhibit an inherent dependence on the slip length. It was shown both theoretically by Squires (Reference Squires2008) and experimentally (Dehe et al. Reference Dehe, Rofman, Bercovici and Hardt2020) that the electroosmotic velocity over a structured superhydrophobic surface depends on the ratio of the slip length and the thickness of the electric double layer. If applicable, this dependence needs to be incorporated into the electroosmotic mobility field. Second, it is important to note that we consider the case that the walls either exhibit an electroosmotic velocity
 $\mu ^{U}(x,y,t) \boldsymbol {E}_\parallel$ or a Navier-slip velocity, but not both at the same time. However, for the sake of compactness of notation, we keep both contributions in the following derivation and require
 $\mu ^{U} \beta ^{U} = 0$ and
 $\mu ^{L} \beta ^{L} = 0$, at the upper and lower walls, respectively.
Following the derivation outlined in Appendix B, we obtain a governing equation for the pressure field  $p$ as
 \begin{equation} \tfrac{1}{12} \boldsymbol{\nabla}_\parallel \boldsymbol{\cdot} ( \langle \mu^{p} \rangle \boldsymbol{\nabla}_\parallel p ) = \boldsymbol{\nabla}_\parallel \boldsymbol{\cdot} \langle \mu^{EOF} \rangle \boldsymbol{E}_\parallel, \end{equation}
where we have introduced the effective mobilities  $\langle \mu ^{p} \rangle$ and
 $\langle \mu ^{EOF} \rangle$ as
 \begin{equation} \langle \mu^{p} \rangle = \frac{1 + 4 ( \beta^{U} + \beta^{L} ) + 12 \beta^{U} \beta^{L} }{1 + \beta^{U} + \beta^{L} } \end{equation}
and
 \begin{equation} \langle \mu^{EOF} \rangle = \frac{1}{2} \frac{ \mu^{U} + \mu^{L} + 2 ( \beta^{U} \mu^{L} + \beta^{L} \mu^{U} ) }{1+\beta^{U} + \beta^{L} }. \end{equation}
They represent the contributions to the average flow velocity due to the external electric field and due to the pressure field inside the cell. The latter may be caused by an applied pressure gradient or by inhomogeneous electroosmotic flow. It is important to keep in mind that both effective mobilities  $\langle \mu ^{p} \rangle$ and
 $\langle \mu ^{EOF} \rangle$ are position dependent. For the special case that
 $\langle \mu ^{p} \rangle$ is constant throughout the domain, e.g. due to constant or vanishing slip length, the equation reduces to a Poisson equation, similar to Boyko et al. (Reference Boyko, Rubin, Gat and Bercovici2015). Solving this equation in a fluid domain leads to a solution for the pressure field, which can be used to calculate the velocity
 $\langle \boldsymbol {u}_\parallel \rangle$.
In order to decompose the pressure field into stationary and oscillatory components, we can follow the principal idea outlined in § 2 and time average the governing equations (3.2) and (3.7) over one period of oscillation. In order to obtain the expressions for the oscillatory component of the pressure field, we subtract the time-averaged equation (3.5) from the full equation (3.2). Splitting up all time-dependent quantities into their stationary part, denoted by  $\overline {(\cdot )}$, and their time-periodic part,
 $(\cdot )'$, the equations for the pressure field read
 \begin{equation} \tfrac{1}{12} \boldsymbol{\nabla}_\parallel \boldsymbol{\cdot} ( \langle \mu^{p} \rangle \boldsymbol{\nabla}_\parallel \bar{p} ) = \boldsymbol{\nabla}_\parallel \boldsymbol{\cdot} ( \langle \overline{\mu^{EOF}} \rangle \overline{\boldsymbol{E}}_\parallel{+} \overline{ \langle {\mu'}^{EOF} \rangle \boldsymbol{E}'_\parallel }) \end{equation}
and
 \begin{equation} \tfrac{1}{12} \boldsymbol{\nabla}_\parallel \boldsymbol{\cdot} ( \langle \mu^{p} \rangle \boldsymbol{\nabla}_\parallel p') = \boldsymbol{\nabla}_\parallel \boldsymbol{\cdot} ( \langle {\mu'}^{EOF} \rangle \overline{\boldsymbol{E}}_\parallel{+}\langle \overline{\mu^{EOF}} \rangle {\boldsymbol{E}'}_\parallel{+}\langle {\mu'}^{EOF} \rangle {\boldsymbol{E}'}_\parallel{-} \overline{ \langle {\mu'}^{EOF} \rangle \boldsymbol{E}'_\parallel }). \end{equation}
Equation (3.5) resembles the original equation, with one additional driving term on the right-hand side. This term is highly important, because it allows to drive time-averaged flows by coupling two oscillatory components. Also, it is important to realize that the temporal structure of the driving terms is of importance, especially the phase shift between the driving field and the mobility. We will revisit this in § 5.3. The forcing term of (3.6) exhibits a contribution due to the time-averaged portions of the electric field and mobility interacting with the oscillatory component of the other, and a contribution due to the product of the oscillatory terms. The first term on the right-hand side oscillates with the time dependence of the mobility, the second term with the time dependence of the electric field, the third term with a higher frequency and the last one is constant. In the special case of a sinusoidal signal with frequency  $f$ for both contributions, the spectrum will consist of frequencies
 $f$ and
 $2f$. In the general case, even higher frequencies will be generated. Therefore, unlike previous work on similar problems (Chu et al. Reference Chu, Garoff, Przybycien, Tilton and Khair2019), we do not impose a specific form of the oscillation (e.g.
 $\textrm {Re}( U \exp ^{\textrm {i}\omega t})$).
The governing equation for the streamfunction  $\psi$, which is defined via
 $\boldsymbol {u}_\parallel = ( \partial \psi / \partial y, -\partial \psi / \partial x )$, follows from the derivation outlined in Appendix B, resulting in
 \begin{equation} ( \boldsymbol{\nabla}_\parallel{\times} \langle \boldsymbol{u}_\parallel \rangle ) \boldsymbol{\cdot} \boldsymbol{e}_{z} ={-}\nabla_\parallel ^{2} \psi ={-}\tfrac{1}{12} ( \boldsymbol{\nabla}_\parallel \langle \mu^{p} \rangle \times \boldsymbol{\nabla}_\parallel p ) \boldsymbol{\cdot} \boldsymbol{e}_{z} - ( \boldsymbol{E}_\parallel{\times} \boldsymbol{\nabla}_\parallel \langle \mu^{EOF} \rangle ) \boldsymbol{\cdot} \boldsymbol{e}_{z}, \end{equation}
where  $\boldsymbol {e}_{z}$ denotes the unit vector in the
 $z$-direction. This equation determines the vorticity, which is represented by
 $\omega = -\nabla _\parallel ^{2} \psi$. Physically, this expression demonstrates that vorticity can be created either by pressure gradients normal to gradients in
 $\langle \mu ^{p} \rangle$ (corresponding to varying effective slip lengths), or by gradients in the electroosmotic mobility normal to the electric field. In the special case of constant
 $\langle \mu ^{p} \rangle$, the first term on the right-hand side of (3.7) decouples from (3.2), thus leading to a system of two uncoupled Poisson equations.
In order to obtain governing equations for the stationary and oscillatory components of the streamfunction, we time average equation (3.7), leading to
 \begin{equation} -\nabla_\parallel ^{2} \bar{\psi} ={-}\tfrac{1}{12} ( \boldsymbol{\nabla}_\parallel \langle \mu^{p} \rangle \times \boldsymbol{\nabla}_\parallel \bar{p} - \overline{\boldsymbol{E}}_\parallel{\times} \boldsymbol{\nabla}_\parallel \langle \overline{\mu^{EOF}} \rangle - \overline{ \boldsymbol{E}'_\parallel{\times} \boldsymbol{\nabla}_\parallel \langle {\mu'}^{EOF} \rangle } ) \boldsymbol{\cdot} \boldsymbol{e}_{z}, \end{equation}
where, in analogy to the pressure equation (3.5), an additional term appears on the right-hand side, containing solely oscillatory components. Subtraction of equation (3.8) from the full equation (3.7) yields the equation for the oscillatory component of the streamfunction as
 \begin{align} -\nabla_\parallel ^{2} \psi' &={-}\tfrac{1}{12} ( \boldsymbol{\nabla}_\parallel \langle \mu^{p} \rangle \times \boldsymbol{\nabla}_\parallel p' - \boldsymbol{E}'_\parallel{\times} \boldsymbol{\nabla}_\parallel \langle \overline{\mu^{EOF}} \rangle\nonumber\\ &\quad - \overline{\boldsymbol{E}}_\parallel{\times} \boldsymbol{\nabla}_\parallel \langle {\mu'}^{EOF} \rangle - {\boldsymbol{E}'}_\parallel{\times} \boldsymbol{\nabla}_\parallel \langle {\mu'}^{EOF} \rangle + \overline{ \boldsymbol{E}'_\parallel{\times} \boldsymbol{\nabla}_\parallel \langle {\mu'}^{EOF} \rangle } ) \boldsymbol{\cdot} \boldsymbol{e}_{z}. \end{align}
Analogous to the pressure equation (3.6), additional coupling terms due to the oscillatory components occur, also with higher-order frequencies. With that, we have finally obtained the governing equations of the problem ((3.5) and (3.8) for the stationary part, (3.6) and (3.9) for the oscillatory part). Inserting the solution for the pressure field into the equation for the flow velocity, one obtains the solutions for the time-averaged flow field ( $\bar {u}$,
 $\bar {v}$,
 $\bar {w}$), the height- and time-averaged flow field (
 $\langle \bar {u}\rangle$,
 $\langle \bar {v}\rangle$,
 $\langle \bar {w}\rangle$) as well as the oscillatory component of the flow field (
 $u'$,
 $v'$,
 $w'$). Thus, all the necessary ingredients of the dispersion model are available.
3.1. Form of the solution for a stationary flow field
From the derivation in Appendix B, it is clear that a stationary flow field takes the form of a quadratic polynomial. In the following, we express the stationary dispersion tensor using a corresponding parametrization of the velocity field,
 $$\begin{gather} u(x,y,z) = A_1(x,y) z^{2} + A_2(x,y) z + A_3(x,y), \end{gather}$$
 $$\begin{gather}v(x,y,z) = B_1(x,y) z^{2} + B_2(x,y) z + B_3(x,y). \end{gather}$$
Then, by solving equation (2.24), the stationary dispersion tensor follows from (2.32) as
 \begin{align} {\boldsymbol{\mathsf{D}}}_{stat} = \begin{bmatrix} -\dfrac{8 A_1^{2}}{945} - \dfrac{A_1 A_2}{60} - \dfrac{A_2^{2}}{120} & -\dfrac{8 A_1 B_1}{945} - \dfrac{A_2 B_1}{120} - \dfrac{A_1 B_2}{120} - \dfrac{A_2 B_2}{120} \\[8pt] -\dfrac{8 A_1 B_1}{945} - \dfrac{A_2 B_1}{120} - \dfrac{A_1 B_2}{120} - \dfrac{A_2 B_2}{120} & -\dfrac{8 B_1^{2}}{945} - \dfrac{B_1 B_2}{60} - \dfrac{B_2^{2}}{120} \end{bmatrix}, \end{align}
and the advection-correction term from (2.30) as
 \begin{align} \boldsymbol{k}_{stat}= \begin{bmatrix} \dfrac{1}{2160} (16 A_1 + 15 A_2) \left(2 \dfrac{\partial A_1 }{\partial x} + 3 \dfrac{\partial A_2}{ \partial x} + 6 \dfrac{\partial A_3}{ \partial x} + 2 \dfrac{\partial B_1}{ \partial y} + 3 \dfrac{\partial B_2}{ \partial y} + 6 \dfrac{\partial B_3}{ \partial y}\right)\\ \dfrac{1}{2160} (16 B_1 + 15 B_2) \left(2 \dfrac{\partial A_1}{ \partial x} + 3 \dfrac{\partial A_2}{ \partial x} + 6 \dfrac{\partial A_3 }{ \partial x} + 2 \dfrac{\partial B_1}{ \partial y} + 3 \dfrac{\partial B_2}{ \partial y} + \dfrac{6 \partial B_3}{ \partial y}\right) \end{bmatrix}. \end{align}
4. Dispersion due to spatial modulation of the wall mobility
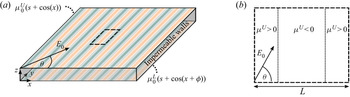
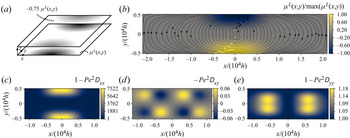
The dispersion model presented in § 2, as well as the governing equations for the flow field derived in § 3 are based on a long-wavelength approximation, i.e. assumptions similar to those underlying lubrication theory. Any flow field based on lubrication theory can be utilized to derive the respective dispersion tensor. Lubrication theory has been used extensively in the context of electrokinetic flows, see for example the classical works of Ajdari (Reference Ajdari1996) and Ghosal (Reference Ghosal2002), and the more recent work of Ng & Zhou (Reference Ng and Zhou2012b), Datta & Choudhary (Reference Datta and Choudhary2013), Ng & Chen (Reference Ng and Chen2013), Ghosh & Chakraborty (Reference Ghosh and Chakraborty2015), Kumar, Datta & Kalyanasundaram (Reference Kumar, Datta and Kalyanasundaram2016) and Arcos et al. (Reference Arcos, Méndez, Bautista and Bautista2018). One analytically accessible case is a Hele-Shaw cell with a sinusoidal modulation of the wall mobility and impermeable sidewalls. This configuration allows us to solve for the dispersion tensor explicitly, and demonstrate some of its characteristics that also apply to analytically less accessible flow fields. A similar wall modulation has been considered by Ajdari (Reference Ajdari2001) and Ng & Zhou (Reference Ng and Zhou2012a). Here, we investigate sinusoidally varying wall mobilities along the  $x$-axis, as shown in figure 2(a). The flow field obtained in the following is based on the assumption of thin double layers, and a closed-off domain with impermeable lateral restrictions at all sides. The wall mobilities have the form
 $$\begin{gather} \mu^{U} = \mu^{U}_0 ( s + \cos ( x )) \end{gather}$$
 $$\begin{gather}\mu^{L} = \mu^{L}_0 ( s + \cos ( x + \phi )), \end{gather}$$
where  $\mu ^{U}_0, \mu ^{L}_0$ are the wave amplitudes,
 $s$ is a constant offset and
 $\phi$ is the phase difference between the upper and the lower walls. The electric field is given by
 $\boldsymbol {E}= (E_x,E_y)^\textrm {T} = E_0 (\cos (\varTheta ),\sin (\varTheta ))^\textrm {T}$, where
 $E_0$ is the non-dimensional amplitude. It is important to keep in mind that the transport model was non-dimensionalized by the electric field magnitude and a characteristic wall mobility, so typically
 $E_0=1$.
Wall-mobility modulation based on a striped pattern. (a) Illustration of a cell with impermeable sidewalls and varying wall mobility. The unit cell utilized to calculate the flow field is indicated by a dashed rectangle. (b) Top view of the unit cell considered to derive the flow field. The electric field forms an angle  $\varTheta$ with the
 $x$-axis.

In order to construct the flow field, we assume that the cell is sufficiently long and sufficiently many stripes are considered, such that end effects due to the sidewalls are insignificant. Then, we can analyse the flow inside a unit cell, as depicted in figure 2(b), separately for each coordinate direction. In the  $x$-direction, no net electroosmotic flow is present. The local electroosmotic flow is balanced by a pressure-driven backflow, equivalently expressed as
 $\langle u \rangle = 0$. Then, the local pressure gradient is defined by the local electroosmotic flow, and the flow field in the
 $x$-direction is
 \begin{equation} u(z) = 3( \mu^{L}_0 + \mu^{U}_0) E_x z^{2} - ( 2 \mu^{U} +4 \mu^{L}) E_x z + \mu^{L} E_x. \end{equation}
The pressure gradient in the  $y$-direction is independent of
 $x$, since the stripes are assumed to be long enough (Ajdari Reference Ajdari2001). There is a net electroosmotic flow in the
 $y$-direction which is balanced by a pressure-driven flow, and we can compute the pressure gradient by requiring
 \begin{equation} \int_0^{2{\rm \pi}} \langle v \rangle \,\text{d}\kern0.7pt x = 0. \end{equation}
Then, by inserting the resulting pressure gradient into the expression for the velocity field (B5), we obtain
 \begin{equation} v(z) = 3 (\mu^{U}_0 - \mu^{L}_0) s E_y z^{2} +((\mu^{U} - \mu^{L}) - 3 (\mu^{U}_0 + \mu^{L}_0) s) E_y z + \mu^{L} E_y. \end{equation}
On this basis, we can compute the dispersion tensor (3.11). The computation is straightforward, and the result can be found in Appendix C.
In order to highlight the influence of different parameters on dispersion, we analyse some specific situations. First, we consider the offset  $s$. Physically, this corresponds to a situation where a constant
 $\zeta$ potential superposes the modulation, e.g. due to embedded electrodes. The resulting components of the dispersion tensor for the limiting cases of an electric field in the
 $x$- and
 $y$-directions (
 $\varTheta = 0, {\rm \pi}/2$) and for a mobility modulation in-phase (
 $\phi =0$) or phase shifted by half a period (
 $\phi ={\rm \pi}$) are given in table 1. Unless otherwise noted, the amplitudes of the upper and lower wall mobility are
 $\mu _0$. For the electric field in the
 $x$-direction, the dispersion tensor only has one non-zero component, namely
 ${\mathsf{D}}_{xx}$. For small
 $s$, the dispersion is dominated by the local modulation, with a doubling of the wavenumber compared with the wavenumber characterizing the mobility modulation. The dispersion coefficient grows as
 $s^{2}$, which means that the offset soon starts to become the dominating influence.
Elements of the dispersion tensor  ${\boldsymbol{\mathsf{D}}}$ for a sinusoidal wall-mobility pattern. Specific parameter combinations are considered, where
 $\mu ^{U}_0=\mu ^{L}_0=\mu _0$ unless otherwise noted. The full dispersion tensor can be found in Appendix C.

For an electric field in the  $y$-direction, the dispersion tensor also contains a contribution proportional to
 $s^{2}$. The electroosmotic flow is a plug flow with velocity magnitude (
 $s+\cos (x$)), which is superposed by a pressure-driven backflow. For
 $\phi =0$, the dispersion coefficient is
 $x$-independent. For wall-mobility patterns phase shifted by
 ${\rm \pi}$, the flow profile is a superposition of a plane Couette flow, a plug flow due to the constant offset at the walls, and the corresponding pressure-driven backflow. Again, a twofold increased wavenumber (relative to the wavenumber of the wall modulation) of the dispersion coefficient is found.
The electric field direction  $\varTheta$ also influences the dispersion tensor. The corresponding results are presented the results in the limit of vanishing offset
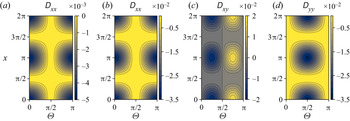
 $s=0$. The resulting dispersion tensor for in-phase and phase-shifted patterns is reported in table 1 and in figure 3. When the patterns are in phase (
 $\phi =0$), only the
 ${\mathsf{D}}_{xx}$ component is non-zero. Locally, the wall mobilities lead to an electroosmotic flow, which is balanced by a pressure-driven backflow. The factor
 $1/210$ corresponds to the classical Taylor–Aris solution for a pressure-driven flow in a parallel-plate channel (see supplementary material). The magnitude of the dispersion depends on the angle of the electric field. In the
 $y$-direction, the flow field is a local plug flow, where the flow at position
 $x_0$ is balanced by a flow at
 $x_0 +{\rm \pi}$ pointing in the opposite direction. Here, no dispersion occurs. In the case of a phase shift
 $\phi ={\rm \pi}$, the situation changes drastically. Now, the electroosmotic flow leads to a strong shear flow, as it points in opposite directions at the bounding walls at
 $z=0,1$. The pre-factor
 $1/30$ corresponds to the classical Taylor–Aris dispersion in shear flow (see supplementary material). The magnitude of the dispersion coefficients depends on the coordinate
 $x$ and the electric field direction
 $\varTheta$, while all components of the tensor are non-zero. Also, the off-diagonal elements are either positive or negative, depending on the direction of the electric field.
Non-zero components of the dispersion tensor  ${\boldsymbol{\mathsf{D}}}$ for a striped pattern with varying electric field direction
 $\varTheta$ and vanishing offset
 $s$. The components are given in units of
 $\mu _0^{2} E_0^{2}$ and are calculated for the case of a vanishing phase shift
 $\phi =0$ (a) and a phase shift
 $\phi ={\rm \pi}$ (b–d).

In order to discuss the influence of the modulation amplitudes on the dispersion, we define the ratio  $r = \mu ^{U}_0/\mu ^{L}_0$. In the special case of an in-phase modulation (
 $\phi =0$) with
 $\varTheta ={\rm \pi} /4$ and vanishing offset
 $s$, the resulting components of the dispersion tensor are summarized in table 1. We can see that the dispersion exhibits a minimum at
 $r=1$, since the electroosmotic flow then results in a plug flow profile. With increasing ratio
 $r$, the dispersion increases, as an additional shear flow component gets admixed.
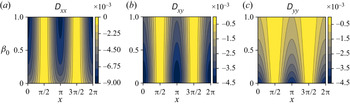
Finally, to highlight the influence of the slip length on dispersion, we set the wall mobility at the lower wall to zero and introduce a constant slip length  $\beta _0$. Since the computation of the flow field follows the same procedure as outlined above, we will omit the mathematical details and only show the resulting dispersion tensor in figure 4 for the case of an electric field with
 $\varTheta ={\rm \pi} /4$, offset
 $s=0$ and phase shift
 $\phi =0$. Interestingly, the magnitude of the dispersion coefficient
 ${\mathsf{D}}_{xx}$ increases with increasing slip length. The velocity profile in the
 $x$-direction results in a plane Couette flow due to electroosmosis, superposed by a pressure-driven backflow. Here, the velocity at the lower wall increases with increasing slip length. As a result, the shear and thus the dispersion increase. The dispersion coefficient
 ${\mathsf{D}}_{yy}$ shows the opposite behaviour, with a decreasing dispersion for increasing slip lengths. The velocity profile in the
 $y$-direction resembles a local plane Couette flow, where every flow profile at a position
 $x_0$ has a corresponding profile of similar form but opposing direction at a position
 $x_0 + {\rm \pi}$. An increasing slip length leads to an increasing velocity at the lower wall, and thus a smaller dispersion. The coefficient
 ${\mathsf{D}}_{xy}$ shows a mixed behaviour, with the dispersion first increasing with
 $\beta _0$, and then decreasing again (e.g. close to
 $x={\rm \pi}$). From this simple flow field it becomes apparent that even a constant slip length can lead to either a higher or lower dispersion, depending on the specific nature of the flow field. More complex interactions can occur when the slip length exhibits a modulation as well.
Non-zero components of the dispersion tensor  ${\boldsymbol{\mathsf{D}}}$ for a striped pattern with varying slip length
 $\beta _0$,
 $\varTheta = {\rm \pi}/4$,
 $\phi =0$ and
 $s=0$. The components are given in units of
 $\mu _0^{2} E_0^{2}$.

Before continuing with numerical computations of less analytically accessible flow fields, it is instructive to summarize the influence of the velocity field on the dispersion tensor. Unsurprisingly, a plug flow due to similar mobilities at the walls leads to no dispersion, as long as no pressure-driven backflow is induced. For the case that a pressure-driven backflow occurs, the dispersion is similar to that of a purely pressure-driven flow in a parallel-plate channel. Upon reversal of the flow field (i.e. the parameters  $A_i, B_i$ in (3.10) change sign), the dispersion tensor remains the same, as can be seen from the fact that only quadratic terms in (3.11) exist. Dispersion increases strongly if the mobilities at opposite walls lead to flow pointing in opposite directions. A shear flow component can either be induced by a phase shift between the patterns on the upper and lower walls, or by a ratio of the wall mobilities
 $r \neq 1$. Also, the off-diagonal elements of the dispersion tensor can take positive as well as negative values. The slip length can either increase or decrease the dispersion, depending on the local flow field. In case of a purely pressure-driven or electroosmotically driven flow field, it acts to reduce the dispersion, but in case of superposed pressure-driven and electroosmotically driven flow fields, it can lead to higher dispersion.
5. Comparison between 3-D and 2-D numerical computations
In this section, we will apply the derived dispersion model to several Hele-Shaw flow fields. The first and second test cases include stationary and oscillatory flow fields. For comparison, we compute the full 3-D solution for the concentration field with a particle-tracking approach. Also, the equivalency of dispersion due to stationary and oscillatory flow will become apparent. As a third test case, we compute the mass transport in a more complex flow configuration, where we illustrate the mixing of a fluidic lamella in a rotating flow field, reminiscent of the well-known blinking vortex principle (Aref Reference Aref1984).
5.1. Numerical methods
Among others, the dispersion model is motivated by the need to reduce the dimensionality of the problem, so that concentration fields in Hele-Shaw flows can be computed efficiently. Numerical simulations including all three dimensions require a sufficient resolution to resolve the processes on the small scale (over the cell height), thus rendering the computational problem much more expensive. In order to evaluate the accuracy of the dispersion model, we compare concentration fields obtained with this model with fields resulting from a particle-tracking method in a 3-D domain using Comsol Multiphysics 5.5. For the 3-D computations, a particle approach is used rather than a continuum method, since it is less prone to discretization errors at high Péclet numbers (numerical diffusion). For the presented test cases, we extract the concentration distributions obtained with both approaches and compare them to assess the validity of the dispersion model.
5.1.1. Implementation of the particle-tracking method
We utilize the model implemented in Comsol Multiphysics 5.5, where particle trajectories are obtained under the influence of Brownian motion and the drag force acting on a particle (Kim Reference Kim2004; Comsol Multiphysics 2019). The equation of motion is solved for each particle, where we have chosen the particle parameters to yield a molecular diffusion constant  $D = 1\times 10^{-10}$ m
 $^{2}$ s
 $^{-1}$, representative of a dye molecule in water. Details on the implementation of the particle-tracking method as well as a convergence study of the time-stepping scheme can be found in Appendix D.
In order to be able to compare the 3-D simulation results with the 2-D dispersion model, we convert the 3-D particle distribution into a normalized concentration distribution averaged over the cell height by defining a  $x$–
 $y$-mesh in the computational domain and counting the particle number in each mesh cell. In order to determine the initial normalization factor, we extract the initial particle number in a cell from the initial particle distribution corresponding to the known concentration from the 2-D computations. Then, we normalize the particle count and thereby generate a normalized concentration field which we can compare with the 2-D simulations.
Additionally, we require a background fluid velocity to model the dispersion of particles. We supply the flow field from the corresponding 2-D model instead of recalculating the flow field. Thereby, we ensure that possible differences between the 3-D and 2-D simulations are purely due to the dispersion model.
5.1.2. Implementation of the 2-D dispersion model
For the 2-D dispersion model, we utilize (3.5)–(3.9) for the flow field. In addition to the boundary conditions at the two parallel plates, we specify boundary conditions at the perimeter of the Hele-Shaw cell, either a specific pressure or no-penetration boundary condition (see supplementary material for details). All equations are implemented into Comsol Multiphysics 5.5, which is based on the finite element method. Details on the implementation such as the numerical scheme, computational mesh and convergence performance can be found in the supplementary material.
Solving equations (3.5)–(3.9) generates a flow field solution ( $\boldsymbol {\nabla }_\parallel \bar {p}, \boldsymbol {\nabla }_\parallel p', \bar {\boldsymbol {u}}_\parallel , \boldsymbol {u}^{\prime }_\parallel$), which we use to calculate the dispersion coefficients according to (2.29) for the macrotransport equation. Furthermore, we utilize (2.24) as the defining equation for
 $\boldsymbol {a}$ and (2.25) as the defining equation for
 $\boldsymbol {b}$. The solutions for
 $\boldsymbol {a}(x,y)$,
 $\boldsymbol {b}(x,y,t)$ are based on the local flow field.
After extracting the coefficients for the macrotransport equation, we compute the time evolution of the concentration field by solving equation (2.29) for a 2-D domain. The concentration fields are normalized by the initial concentration, and equivalent initial conditions are used in the 3-D simulations.
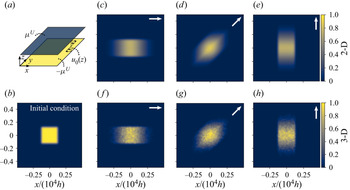
5.2. Test case A: dispersion due to a stationary flow field
In order to validate the stationary part of the dispersion model, we analyse a steady-state flow field with zero average flow velocity. We achieve that by imposing wall mobilities with opposite signs ( $\mu ^{U} = -\mu ^{L}$) at the upper and lower walls of the cell, without any external pressure gradient. By imposing periodic boundary conditions, the resulting flow field is a shear flow, as indicated in figure 5(a). It is worth pointing out that due to the absence of a height-averaged velocity, the only remaining contributions in the macrotransport equation (2.29) are the time derivative of the concentration field and the effective diffusivities on the right-hand side. The dispersion coefficients are calculated according to the governing equations described in § 2.3.
Test case A: comparison of hydrodynamic dispersion inside a Hele-Shaw cell as obtained with the 2-D dispersion model (c–e) and 3-D particle-tracking simulations (f–h). (a) The system consists of a Hele-Shaw cell with wall mobilities of opposite sign at the bounding walls, leading to a shear flow with zero average flow velocity. (b) An initial concentration distribution is dispersed over time, and the resulting concentration distributions are shown after a time span of  $70.59 \,T_{dif,h}$ (c–h). The direction of the electric field is indicated at the top-right corner of each panel.

The parameters chosen for the calculations are shown in table 2. We compute the dispersion for three cases with the same magnitude of the electric field but different directions, while maintaining the mobility at the walls and the initial concentration distribution. This allows probing of the off-diagonal components of the dispersion tensor. The initial concentration distribution is of square shape, where the edges were smoothed using an error function, as described in the supplementary material.
Parameter values used in the calculations of test cases A and B, as indicated in figures 5 and 6. Additional information on the initial conditions is presented in Appendix D and the supplementary material.

In figure 5, the resulting concentration distributions from the 2-D dispersion model (c–e) and the 3-D particle simulations are shown (f–h). In the upper right corner, the direction of the electric field is indicated. First, we would like to discuss the 3-D simulation data, which are less smooth than the 2-D results. The concentration field is extracted on a mesh of  $60\times 60$ cells, and the initial concentration inside the rectangle corresponds to 142 particles per cell. We have chosen not to smooth the data, in order to prevent an artificial broadening of the mixing zones. Apart from local inhomogeneities, the agreement between the 2-D and the 3-D calculations is evident. In the direction of the flow, dispersion enhances mass transport. To quantify the extent of the mixing regions and compare how well the dispersion model reproduces the 3-D simulations, we take the case of an electric field in the
 $x$-direction as an example (figure 5c,f). We define the boundary of the concentration distribution as the value
 $x_0$ where
 $c(x_0)=0.1$. The size of the region for the dispersion model is denoted by
 $x_{0,2D}$, and for the particle simulations by
 $x_{0,3D}$. The size of the concentration field broadened by dispersion exhibits a relative error of
 $(x_{0,2D}-x_{0,3D})/x_{0,3D} = 7.4\,\%$ on average inside the central region (
 $\vert y \vert < 0.1$). In the
 $y$-direction (perpendicular to the electric field), the relative error yields 2.5 % on average. The extent of the zones broadened by dispersion agrees well between the calculations, and in the direction normal to the flow velocity, molecular diffusion is much weaker, leading to a much smaller diffusive broadening. These results show that the dispersion due to a stationary flow field is captured by the 2-D model.
5.3. Test case B: dispersion due to a oscillatory flow field
In order to validate the oscillatory part of the dispersion model, we analyse a similar case as in the preceding section, resulting in a shear flow field with zero average flow velocity. However, we modify the velocity by multiplying it with a factor  $\sin (2 {\rm \pi}f t)$, as indicated in figure 6. As a result, the flow field becomes oscillatory, where both
 $\langle \bar {\boldsymbol {u}} \rangle$ and
 $\bar {\boldsymbol {u}}$ vanish.
Test case B: comparison of dispersion inside a Hele-Shaw cell due to oscillatory flow obtained from the 2-D dispersion model (c–e) and 3-D particle-tracking simulations (f–h). (a) The wall mobilities are of opposite signs and the flow is actuated by an oscillatory electric field oriented along the  $x$-axis, leading to a shear flow with zero time average. (b) Initial concentration field as used for the computations. (c–h) The resulting concentration distributions are shown after a time span of
 $70.59 \,T_{dif,h}$. The oscillation frequency is indicated inside each panel.

Before discussing the resulting concentration distribution, we would like to outline some analogies between the dispersion due to oscillatory flow and due to stationary flow. As evident from the macroscale transport equation, for each stationary term (denoted by some function of the time averaged flow field  $\boldsymbol {u}$ and
 $\boldsymbol {a}$), a corresponding oscillatory term exists (denoted by some function of the oscillatory flow field
 $\boldsymbol {u}'$ and
 $\boldsymbol {b}$). That is, dispersion can either be driven by a flow field that is non-uniform over
 $z$ but stationary, or by a flow field non-uniform over both
 $z$ and
 $t$.
Solving the boundary value problem for  $\boldsymbol {b}$ is more complex than the analogous stationary problem for
 $\boldsymbol {a}$ outlined in the preceding section, since
 $\boldsymbol {b}$ exhibits a time dependence, but it is straightforward and can be done numerically. In figure 7, we show the resulting dispersion coefficient
 $\langle \overline {u' \boldsymbol {b}}\rangle$ for varying oscillation frequencies (which are non-dimensionalized by the inverse diffusive time scale). The dispersion coefficient exhibits a behaviour previously reported (Chatwin Reference Chatwin1975; Vedel & Bruus Reference Vedel and Bruus2012; Chu et al. Reference Chu, Garoff, Przybycien, Tilton and Khair2019). For the case of slow oscillations (
 $f \xrightarrow {} 0$), it approaches half of the value obtained for the case of a stationary flow with the same amplitude, as we obtained for test case A. For the case of fast oscillations (
 $f \gg 1$), the dispersion coefficient approaches zero. The limit for slow oscillations is mathematically determined by an integral over one period of oscillation of a product of two sine functions. If the oscillatory signals exhibited a different time dependence than a harmonic one, the ratio of the oscillatory dispersion tensor components to the steady-state dispersion tensor components would differ from
 $1/2$, as we discussed in § 3. In the limit of fast oscillations, however, the limiting value remains
 $0$, since the flow oscillation occurs on time scales much faster than the diffusion time scale over the channel height.
Test case B: dependence of the dispersion coefficient on the oscillation frequency. In the limit of fast oscillations, the dispersion coefficient tends to zero, in the limit of slow oscillations, it converges to one half of the value obtained for a stationary flow of the same magnitude.

Since we have already demonstrated in test case A that the directional dependence of the dispersion tensor on the electric field can be captured by the model, we focus solely on the variation of the oscillatory frequencies while keeping the direction of the electric field constant. The resulting concentration fields for three different oscillatory frequencies ( $\,f = 0.1, 1, 10$) are depicted in figure 6, where the electric field is aligned with the
 $x$-axis. The dispersion decreases with increasing frequency. At
 $f=0.1$, the dispersion is most pronounced, and for
 $f=10$, it is of the same order of magnitude as the molecular diffusion. Using the same relative error as in test case A, we characterize the extent of the concentration distributions. The resulting relative error between the 3-D and 2-D simulations is 7.6 % for
 $f=0.1$, 3.9 % for
 $f=1$ and 7.9 % for
 $f=10$. Again, there is a good agreement between the 2-D and the 3-D calculations, considering the local inhomogeneities of the particle simulations.
Apart from that, additional conclusions can be drawn from these results. Dispersion due to oscillations will only dominate over steady-state dispersion if the amplitude of  $\boldsymbol {u}'$ is larger than that of the steady-state component
 $\bar {\boldsymbol {u}}$ and if additionally, the oscillation period is of the order of the diffusive time scale or larger. In other cases, the steady-state dispersion will dominate. For realistic systems devoted to flow shaping, such as reported by Paratore et al. (Reference Paratore, Bacheva, Kaigala and Bercovici2019a), the channel has a height of the order of 10
 $\mathrm {\mu }$m, resulting, in combination with the assumed diffusion constant, on a diffusive time scale of seconds. Typically, such a system is operated at oscillatory frequencies of the order of several Hz, rendering it rather insensitive to dispersion due to oscillations. Motivated by such examples, we will focus on steady-state dispersion in test case C.
5.4. Test case C: inhomogeneous flow field
In this section, we would like to demonstrate the ability of the model to capture dispersion in a complex flow pattern. As outlined in the introduction, our research is motivated by the idea of shaping flows inside a microfluidic device without relying on fixed wall geometries, therefore making it reconfigurable during operation. More specifically, if the flow can be controlled both in space and time, different standard microfluidic operations can be performed consecutively, for example mixing of species and partitioning the flow to various outlet ports. In this test case, we analyse the effect of a complex flow pattern on a Hele-Shaw cell, half of which ( $y>0$) is filled with a dissolved species. The parameters used in this test case are summarized in table 3.
Values of parameter utilized in test case C, as indicated in figure 8. Additional information on the initial conditions is presented in Appendix D and the supplementary material.

In figure 8(a,b), the wall-mobility distribution is shown: at the lower wall we have two regions with the wall mobility  $\mu ^{L}$ differing from zero. The mobility distribution is antisymmetric with respect to the
 $y$-axis. At the upper wall, the wall mobility is of opposite sign relative to the lower wall, with a magnitude reduced by a factor of 0.75 (
 $\mu ^{U} = -0.75\mu ^{L}$). The flow is driven by an electric field in the
 $x$-direction, leading to a rotational average flow field as indicated by the streamlines in figure 8(b). Different from the previous test cases, here the Hele-Shaw cell has an aspect ratio of 4:1 in the
 $x$–
 $y$ plane. We define all mobilities as well as the driving electric field to be time independent, thus the problem is governed by (3.5) and (3.8). Corresponding wall-mobility distributions can be created using different principles, such as chemical patterning (Paratore et al. Reference Paratore, Boyko, Kaigala and Bercovici2019b) or actuation by electrodes (Paratore et al. Reference Paratore, Bacheva, Kaigala and Bercovici2019a; Dehe et al. Reference Dehe, Rofman, Bercovici and Hardt2020). The boundaries at the perimeter of the cell are assumed to be periodic in the
 $y$-direction, with no-penetration boundaries in the
 $x$-direction. The rationale behind choosing such a flow field stems from the well known blinking vortex principle (Aref Reference Aref1984), where the flow field consists of two co-rotating in-plane vortices with an offset between their centres. The term blinking refers to the fact that the two vortices are switched on and off in succession. Based on such flows chaotic mixing can be achieved if the blinking period is chosen appropriately. In our case, it is expected that chaotic mixing efficiently distributes the species over the cell. However, due to computational constraints, we only analyse the initial phase of the advection–diffusion process.
Configuration of test case C. (a) The fluid flow is driven by a wall-mobility distribution both on the top ( $\mu ^{U}$) and bottom walls of the fluidic cell (
 $\mu ^{L}$), where the mobilities are of opposing signs at opposing walls, and an electric field in the positive
 $x$-direction. The mobility at the upper plate has a magnitude of 75 % of that on the lower plate. (b) Resulting circulating flow field, depicted by streamlines of the averaged flow velocity
 $\langle \boldsymbol {u}_\parallel \rangle$. (c–e) The flow field leads to a dispersion tensor, where the dispersion in
 $x$-direction is strongly enhanced in the region of the mobility patch, while in the
 $y$-direction it is comparable to the molecular diffusion.

In figure 8(c–e), we depict the components of the dispersion tensor. For the dispersion coefficient in the  $x$-direction, it is visible that it is strongly enhanced above the non-zero wall-mobility regions. Here, the flow has a strong shear component. Outside, molecular diffusion is the driving mechanism. The off-axis components of the dispersion matrix are much smaller than the molecular diffusion, thus having little influence. In the
 $y$-direction, the flow is driven by pressure gradients created by the wall mobility, but since the average flow velocity is smaller than the wall velocity in the shear region, the dispersion coefficient is close to that of molecular diffusion.
We computed the time evolution of the concentration field with the particle-tracking method in three dimensions, the dispersion model in two dimensions and additionally without dispersion, only considering molecular diffusion. In figure 9 we show the concentration field for three different points in time. At first glance, the concentration fields are comparable to each other, due to the fact that the dominant transport mechanism in this system is advection with the mean velocity. However, when comparing in detail, certain differences become apparent. Before entering the region with strong shear flow (and thus enhanced dispersion), the mixing regions between the regions with high and low concentration are nearly identical. After passing this region, the extension of the mixing zones between the yellow and blue regions is increased for the case that dispersion is included, both visible in the 2-D and 3-D data. This difference increases with time. In order to quantify the ability of the dispersion model to capture the growth of the mixing zones over time, we compute the area of the mixing zones for each time step. The area is defined as the regions depicted in figure 9, where the concentration takes the values  $0.1< c<0.5$. Using only those regions that exhibit a relatively small concentration, we exclude errors due to numerical fluctuations in regions with high concentration, visible in figure 9(d,g,j), from affecting this integral measure. For the instances shown in figure 9, the dispersion model slightly overpredicts dispersion, leading to an increase of the mixing regions compared with the 3-D simulations of 6.1 %, 4.4 % and 2.1 %, respectively. If only molecular diffusion is taken into account, the mixing regions are 2.1 %, 23.6 % and 26.9 % smaller than in the 3-D simulations. In the supplementary material, we provide an image where the spatial distribution of the mixing zones is depicted. It is also worth noting that concentration gradients outside of the regions of enhanced dispersion and in the
 $y$-direction are largely preserved. This is prominently visible at later times for the gradients close to the perimeter of the cell. The main effect of advection, which dominates the overall structure of the concentration field, is similar in all three cases. However, the effects due to dispersion become important and are represented better by the dispersion model compared with the model accounting only for molecular diffusivity. Similar to the previous test cases, there is a good agreement between the results of the 2-D dispersion model and the 3-D particle-tracking simulations
Comparison of dispersion inside a Hele-Shaw cell as computed with 3-D particle simulations (a,d,g,j), the 2-D dispersion model (b,e,h,k) and purely 2-D molecular diffusion (c,f,i,l). The resulting concentration fields of the 3-D particle simulations and the dispersion model show good agreement. At early times, the dispersion model and the molecular diffusion generate similar concentration profiles. Once the lamella passes the regions of enhanced dispersion, the size of the mixing zones varies.

Lastly, we would like to present the concentration distribution for a flow field where dispersion dominates the species transport. By following the concentration development in the same flow cell as before, but applying a wall mobility at the upper wall of  $\mu ^{U} = -0.95\mu ^{L}$, we reduce the average flow velocity and increase the relative importance of dispersion compared with advection. However, we can only present the computational results for the 2-D models, since the 3-D particle simulations were too demanding on the existing hardware. As depicted in figure 10, the concentration distribution is strongly influenced by dispersion, and mixing is strongly enhanced for the case of dispersion. These results nicely illustrate why correctly accounting for hydrodynamic dispersion can be crucial. Also, the fact that 3-D computations were too demanding to generate meaningful results outlines the need for a reduced, yet accurate dispersion model.
Comparison of the same model as in figure 8, but with an upper wall mobility of  $\mu ^{U} = -0.95\mu ^{L}$. The concentration distribution at
 $t = 4693 \, T_{dif,h}$ is shown for the dispersion model (b) and purely 2-D molecular diffusion (c).

6. Discussion and conclusion
In the present paper, we have studied the dispersion of a dissolved species in a Newtonian fluid inside a non-uniform flow field in a Hele-Shaw cell in the long-time limit. In particular, by considering the different time scales of the mass transport problem, we used a perturbative approach with a small parameter representing the separation of time scales. Following a multiple-scale perturbation approach, we have derived an effective dispersion model, accounting for dispersion due to stationary and oscillatory flow in a Hele-Shaw cell. The derived multiscale equation shows that the variations of fluid velocity over the channel height (in the steady-state case) and over the channel height and time (for the oscillatory case) are the driving mechanisms for dispersion. By incorporating the effects of mass transport along the height direction into effective coefficients, the model is reduced by one dimension compared with the full 3-D model. This is achieved by solving the additional boundary value problems (2.24) and (2.25) for given flow fields.
In a next step, we have derived the governing equations for the inhomogeneous flow field in a Hele-Shaw cell that is a superposition of electroosmotic flow and pressure-driven flow, accounting for varying wall slip and effective wall mobilities at the upper and lower boundaries. The governing equations for the stationary and the oscillatory flow fields were obtained by height and time averaging the momentum equation. On a side note, we showed that the resulting equations for the vorticity and pressure gradient decouple for constant effective wall slip, and that the equations resemble the form reported by Boyko et al. (Reference Boyko, Rubin, Gat and Bercovici2015). For the oscillatory problem, we allowed arbitrary time-dependent functions for the driving field as well as for the wall mobilities. As we demonstrated in § 3, the driving terms of the resulting oscillatory problem include products of time-dependent functions, thus leading to higher frequencies in the flow field. We also showed that for the long-time asymptotics of the flow field, the oscillatory problem does not need to be solved. For the dispersion problem, however, we require information about the time-dependent behaviour.
It is important to keep the underlying assumptions of the model in mind. First, the flow equations are only accurate as long as the in-plane length scale  $L$ over which the wall properties change is much larger than the channel height
 $h$. In the case of changes on smaller scales, the wall-normal velocity component
 $w$ will become significant (Chu et al. Reference Chu, Garoff, Przybycien, Tilton and Khair2019). Secondly, a similar condition results for the dispersion model from the assumed time scales, as
 $T_{dif,h} \ll T_{adv}$, leading to a condition for the length scales as
 $L \gg Pe \, h$. Effectively, this condition ensures that a concentration field can establish an equilibrium over the channel height before the local flow field changes. If this condition is violated, the dispersion model will not be able to accurately predict the concentration field. The third assumption regards the time scale on which the model makes useful predictions. The model is valid only in the long-time limit compared with the diffusive time scale, requiring
 $t \gg T_{dif,h}$. This also poses a restriction on the ability to switch flow fields. One further restriction stems from the oscillation period. During the derivation of the flow equations, we assumed that an upper limit to the oscillation frequency is posed by the diffusive time scale. In the case of faster oscillations, the factor
 $\epsilon St Re$ in (B2) may become important. However, as we have seen for the dispersion model, oscillations much faster than the inverse of the diffusive time scale have little influence on dispersion. The influence on the dispersion of fast oscillations is therefore negligible. Lastly, we also neglected any coupling of the concentration field to the flow field. Therefore, the dissolved species cannot change the viscosity of the background fluid, the conductivity of the liquid, or any wall properties. For real-world applications, one has to check that these conditions are sufficiently satisfied.
In order to outline the general characteristics of the dispersion model, we have revisited the flow field in a cell with parallel surfaces and sinusoidally varying wall mobility, with an electrical field pointing at an angle  $\varTheta$ inside the cell. For specific situations, we derived closed-form expressions for the resulting dispersion tensor, and demonstrated the influence of the different model parameters on dispersion. Especially the role of the wall slip is noteworthy, as it can both lead to increased and decreased dispersion, depending on the specific nature of the flow field.
In order to validate the dispersion model, we have considered several test cases. We have numerically implemented the full 3-D equations utilizing a particle-tracking approach, as well as the 2-D model, using the finite element software Comsol Multiphysics 5.5. First, we considered stationary, unidirectional shear flow with vanishing average flow velocity. By that, we could verify the ability of the model to correctly predict the dispersion corresponding to stationary flow.
In a next step, we considered the same set-up, but with oscillatory shear flow. We demonstrated that the dispersion due to oscillatory flow is compatible with behaviour reported in the literature. For the limit of slow sinusoidal excitation, the dispersion coefficient converges to half of the numerical value for stationary flow with the same amplitude. In the limit of fast oscillations, the dispersion coefficient converges to zero, since the diffusive transport over the channel height can no longer respond to the velocity differences over the channel. In this context, note that dispersion due to oscillatory behaviour can only be the dominating effect in the case of oscillation amplitudes much larger than the average flow velocity, as well as sufficiently slow oscillations (compared with the diffusive time scale over the channel height).
Finally, we considered the hydrodynamic dispersion in an inhomogeneous flow field, specifically a recirculating flow, inspired by the blinking vortex principle. We could show that local velocity gradients enhance dispersion. Also for this test case the 2-D dispersion model gives results well comparable to the 3-D simulations. In addition, we have demonstrated how the concentration distribution can be affected in the case that dispersion dominates advection with the mean flow velocity, and why modelling the dispersion is crucial in such a case.
To conclude, we believe that the presented model, representing a generalization of the Taylor–Aris model to two dimensions, could find widespread applications in a variety of scenarios where Hele-Shaw-like flow patterns are relevant. The model not only accounts for the superposed electroosmotic and pressure-driven flows forming due to an inhomogeneous electroosmotic mobility at the walls, but also for the inhomogeneities in purely pressure-driven flow due to an inhomogeneous slip length at the walls. Applications for which the model may become relevant include mixing, valving, species separation and sorting and chemical reactions.
Supplementary material
Supplementary materials are available at https://doi.org/10.1017/jfm.2021.648.
Acknowledgements
The authors thank B. Rofman, E. Boyko and M. Bercovici for useful discussions.
Funding
This research was supported by a Grant (Grant No. I-1346-401.10/2016) from the German-Israeli Foundation for Scientific Research and Development (GIF).
Declaration of interests
The authors report no conflict of interest.
Appendix A. Term by term evaluation of second-order perturbation: $\mathit {O} = ( \epsilon ^{2} )$

We continue the derivation outlined in § 2.4 by a term-by-term evaluation. In order to obtain a solution for  $c^{(2)}$, we average equation (2.26) over time and over the channel height. By utilizing (2.21) and (2.23), the second term on the left-hand side can be expressed as
 \begin{equation} \frac{\partial c^{(1)}}{\partial t_1} ={-}Pe^{2} ( \boldsymbol{a} +\boldsymbol{b}) \boldsymbol{\cdot} \boldsymbol{\nabla}_\parallel \left( \langle \bar{u}\rangle \frac{\partial}{\partial x}c^{(0)} + \langle \bar{v}\rangle \frac{\partial}{\partial y}c^{(0)} \right). \end{equation}
Due to  $\langle \boldsymbol {a}\rangle = \langle \bar {\boldsymbol {b}}\rangle = \boldsymbol {0}$, the time and transverse average of this term vanishes.
Continuing the derivation with the fourth term on the left-hand side of (2.26), we insert the solution of  $c^{(1)}$ (2.23) and time average over one oscillation period, resulting in
 \begin{align} Pe \left( \overline{ u \frac{\partial c^{(1)}}{\partial x} }\right) &= Pe^{2} \left( \bar{u} \frac{\partial \boldsymbol{a}}{\partial x} \boldsymbol{\cdot} \boldsymbol{\nabla}_\parallel c^{(0)} +\bar{u} \boldsymbol{a} \boldsymbol{\cdot} \frac{\partial \boldsymbol{\nabla}_\parallel c^{(0)}}{\partial x}\right) \nonumber\\ &\quad + Pe^{2} \left( \overline{u' \frac{\partial \boldsymbol{b}}{\partial x}} \boldsymbol{\cdot} \boldsymbol{\nabla}_\parallel c^{(0)} + \overline{u' \boldsymbol{b}} \boldsymbol{\cdot} \frac{\boldsymbol{\nabla}_\parallel c^{(0)}}{\partial x} \right). \end{align}
In a next step, transverse averaging yields
 \begin{align} Pe \left\langle \overline{ u \frac{\partial c^{(1)}}{\partial x} } \right\rangle &= Pe^{2} \left( \left\langle \bar{u} \frac{\partial \boldsymbol{a}}{\partial x} \right\rangle \boldsymbol{\cdot} \boldsymbol{\nabla}_\parallel c^{(0)} + \langle \bar{u} \boldsymbol{a}\rangle \boldsymbol{\cdot} \frac{\partial \boldsymbol{\nabla}_\parallel c^{(0)}}{\partial x}\right) \nonumber\\ &+ Pe^{2} \left( \left\langle \overline{u' \frac{\partial \boldsymbol{b}}{\partial x}} \right\rangle \boldsymbol{\cdot} \boldsymbol{\nabla}_\parallel c^{(0)} + \langle \overline{u' \boldsymbol{b}}\rangle \boldsymbol{\cdot} \frac{\boldsymbol{\nabla}_\parallel c^{(0)}}{\partial x} \right). \end{align}
In a similar manner, the fifth term on the left-hand side results in
 \begin{align} Pe \left\langle \overline{ v \frac{\partial c^{(1)}}{\partial y} } \right\rangle &= Pe^{2} \left( \left\langle \bar{v} \frac{\partial \boldsymbol{a}}{\partial y} \right\rangle \boldsymbol{\cdot} \boldsymbol{\nabla}_\parallel c^{(0)} + \left\langle \bar{v} \boldsymbol{a}\right\rangle \boldsymbol{\cdot} \frac{\partial \boldsymbol{\nabla}_\parallel c^{(0)}}{\partial y}\right) \nonumber\\ &\quad + Pe^{2} \left( \left\langle \overline{v' \frac{\partial \boldsymbol{b}}{\partial y}} \right\rangle \boldsymbol{\cdot} \boldsymbol{\nabla}_\parallel c^{(0)} + \langle \overline{v' \boldsymbol{b}}\rangle \boldsymbol{\cdot} \frac{\boldsymbol{\nabla}_\parallel c^{(0)}}{\partial y} \right), \end{align}
and the sixth term in
 \begin{equation} Pe \left\langle \overline{w \frac{\partial c^{(1)}}{\partial z} } \right\rangle = Pe^{2} \left( \left\langle \bar{w} \frac{\partial \boldsymbol{a}}{\partial z} \right\rangle \boldsymbol{\cdot} \boldsymbol{\nabla}_\parallel c^{(0)} + \left\langle \overline{w' \frac{\partial \boldsymbol{b}}{\partial z}} \right\rangle \boldsymbol{\cdot} \boldsymbol{\nabla}_\parallel c^{(0)} \right). \end{equation}
Invoking the boundary condition (2.27) shows that the third term on the right-hand side disappears.
Appendix B. Governing equations for the flow
In order to obtain the governing equations for fluid flow, the continuity equation and the Navier–Stokes equation are non-dimensionalized, closely following the work of (Boyko et al. Reference Boyko, Rubin, Gat and Bercovici2015) and § 2. The spatial coordinates are scaled by  $L$ in the
 $x$ and
 $y$-directions and by
 $h$ in the
 $z$-direction, and the velocities by
 $U_{c}$ and
 $W_{c}$, respectively. The characteristic velocity
 $U_{c}$ has to be chosen according to the problem under study. In the case of electroosmotic flow, for example, this velocity scale can be obtained as the product of the electric field scale
 $E_{c}$ and the electroosmotic mobility scale
 $\mu _{EOF,c}$. We leave the typical velocity scale
 $W_{c}$ as well as the pressure scale
 $p_{c}$ and the time scale
 $t_{c}$ unspecified at first. The slip lengths
 $\beta ^{U}, \beta ^{L}$ are normalized by the cell height
 $h$.
Based on the small parameter
 \begin{equation} \epsilon = \frac{h}{L} \ll 1, \end{equation}
the missing scales can be determined consistently. From an order-of-magnitude analysis of the continuity equation, we obtain  $W_{c} = \epsilon U_{c}$, and from the in-plane momentum equation the pressure scale follows as
 $p_{c} = \eta U_{c} / L \epsilon ^{2}$. The non-dimensionalized governing equations are
 $$\begin{gather} 0=\frac{\partial {\hat{u}}}{\partial {\hat{x}}} +\frac{\partial {\hat{v}}}{\partial {\hat{y}}}+\frac{\partial {\hat{w}}}{\partial {\hat{z}}}, \end{gather}$$
 $$\begin{gather}\epsilon Re \mathit{St} \frac{\partial \boldsymbol{\hat{u}}_\parallel}{\partial \hat{t}} + Re \epsilon \left( \hat{u} \frac{\partial}{\partial \hat{x}} + \hat{v} \frac{\partial}{\partial \hat{y}} + \hat{w} \frac{\partial}{\partial \hat{z}}\right) \boldsymbol{\hat{u}}_\parallel{=}{-}\boldsymbol{{\nabla}}_{{\parallel}} \hat{p} + \left( \epsilon^{2} \left( \frac{\partial^{2}}{\partial \hat{x}^{2}} +\frac{\partial^{2}}{\partial \hat{y}^{2}} \right) + \frac{\partial^{2} }{\partial \hat{z}^{2}} \right)\boldsymbol{\hat{u}}_{{\parallel}} , \end{gather}$$
 $$\begin{gather}\epsilon^{3} Re \mathit{St} \frac{\partial \hat{w}}{\partial \hat{t}} + \epsilon^{3} Re \left( \hat{u} \frac{\partial}{\partial \hat{x}} + \hat{v} \frac{\partial}{\partial \hat{y}} + \hat{w} \frac{\partial}{\partial \hat{z}}\right) \hat{w} ={-}\frac{\partial \hat{p}}{\partial \hat{z}} +\left( \epsilon^{4} \left( \frac{\partial^{2}}{\partial \hat{x}^{2}} +\frac{\partial^{2}}{\partial \hat{y}^{2}} \right) + \epsilon^{2} \frac{\partial^{2} }{\partial \hat{z}^{2}} \right)\hat{w}. \end{gather}$$
Here, we have introduced the Reynolds number as  $Re = \rho U_{c} h / \eta$, representing a measure of inertial relative to viscous forces, and the dimensionless Strouhal number as
 ${St = L / U_{c} t_{c}}$, which is the ratio between the advective time scale and the characteristic time scale. In the following, we consider the viscosity-dominated regime, leading to
 \begin{equation} \epsilon Re \ll 1. \end{equation}
With regard to the Strouhal number, note that the characteristic time scale is yet undefined. One reasonable choice would be the inverse oscillatory frequency  $T_{osc} = 1/\,f_{c}$, leading to the expression
 \begin{equation} \epsilon St Re = \frac{\rho h^{2}}{\eta T_{osc}} \ll 1, \end{equation}
if we refer to typical values for oscillatory frequencies reported in the literature (Paratore et al. Reference Paratore, Bacheva, Kaigala and Bercovici2019a; Dehe et al. Reference Dehe, Rofman, Bercovici and Hardt2020). This condition poses an upper limit on the oscillation frequency. Additionally, we work under the assumption that the electric field is uniform over the whole cell, and parallel to the bounding walls. This assumption holds for the case of small surface conductivity compared with the bulk conductivity (Squires Reference Squires2008), and a large dielectric constant of the fluid compared with the wall material.
Again, for the further analysis, we drop the hats for readability, noting that in the following all variables are non-dimensionalized. Taking now the leading order in  $\epsilon$ of (B2b) and integrating it twice with respect to
 $z$, we find an expression for the flow profile of the form
 \begin{equation} \boldsymbol{u}_\parallel{=} \boldsymbol{\nabla}_\parallel p \frac{z^{2}}{2} + \boldsymbol{f} z + \boldsymbol{g}, \end{equation}
where the vector functions  $\boldsymbol {f}$ and
 $\boldsymbol {g}$ are dependent on the in-plane position
 $(x,y)$ and time
 $t$. Accounting for the boundary conditions at the upper and the lower wall (3.1) leads to expressions for the function
 $\boldsymbol {f}$ as
 \begin{equation} \boldsymbol{f} = \frac{\mu^{U} - \mu^{L}}{1+\beta^{U} + \beta^{L} } \boldsymbol{E}_\parallel{+} \frac{-\frac{1}{2} - \beta^{U}}{1+ \beta^{U} + \beta^{L} } \boldsymbol{\nabla}_\parallel p \end{equation}
and for  $\boldsymbol {g}$ as
 \begin{equation} \boldsymbol{g} = \mu^{L} \boldsymbol{E}_\parallel{+} \beta^{L} \frac{\mu^{U} - \mu^{L}}{1+ \beta^{U} + \beta^{L} } \boldsymbol{E}_\parallel{+} \beta^{L} \frac{-\frac{1}{2} - \beta^{U}}{1+ \beta^{U} + \beta^{L} } \boldsymbol{\nabla}_\parallel p. \end{equation}
Both expressions have contributions due to the external electric field and due to the pressure field inside the cell, that may be caused by an applied pressure gradient or by inhomogeneous electroosmotic flow. It is important to keep in mind that the pressure gradient  $\boldsymbol {\nabla }_\parallel p$ is unknown and needs to be determined in subsequent steps.
The transverse average over the flow velocity (B5) results in
 \begin{align} \langle \boldsymbol{u}_\parallel \rangle ={-} \frac{1}{12} \frac{1 + 4 ( \beta^{U} + \beta^{L} ) + 12 \beta^{U} \beta^{L} }{1 + \beta^{U} + \beta^{L} } \boldsymbol{\nabla}_\parallel p + \frac{1}{2} \frac{\mu^{U} + \mu^{L} + 2 ( \beta^{U} \mu^{L} + \beta^{L} \mu^{U}) }{1+\beta^{U} + \beta^{L} } \boldsymbol{E}_\parallel. \end{align}
In order to obtain information about  $\boldsymbol {u}^{\prime }_\parallel$, we can subtract the height-averaged equation (B8) from the full equation (B5). It is important to keep in mind that the pressure gradient
 $\boldsymbol {\nabla }_\parallel p$ is unknown and needs to be determined in subsequent steps.
We derive the governing equations for the pressure field (3.2) by applying the 2-D divergence operator to (B8) and by utilizing (B2a) as well as the no-flux boundary condition. The governing equation for the streamfunction  $\psi$ (3.7), which is defined via
 $\boldsymbol {u}_\parallel = ( \partial \psi / \partial y, -\partial \psi / \partial x )$, can be obtained by applying the
 $z$-component of the curl operator to (B8).
Appendix C. Dispersion tensor due to a striped mobility pattern
The components of the dispersion tensor for the striped mobility pattern presented in § 4 follow from (3.11) as
 \begin{align} {\mathsf{D}}_{xx} &={-}\frac{1}{210}E_0^{2} \cos^{2} ( \varTheta ) ( (\mu^{L}_0)^{2} (1+ 2s^{2}) - 3 s^{2} \mu^{L}_0 \mu^{U}_0 +(\mu^{U}_0 )^{2}(1+ 2s^{2}) \nonumber\\ &\quad + s \mu^{U}_0 ({-}3 \mu^{L}_0 + 4 \mu^{U}_0) \cos(x) +\mu^{U}_0 )^{2} \cos(2x) \nonumber\\ &\quad +\mu^{L}_0 ( (4 s \mu^{L}_0 - 3 s \mu^{U}_0 - 3 \mu^{L}_0 \cos(x)) \cos ( x +\phi) + \mu^{L}_0 \cos (2 ( x +\phi) ) ) ), \end{align}
 \begin{align} {\mathsf{D}}_{xy} &= {\mathsf{D}}_{yx}={-}\frac{1}{1680} E_0^{2} \cos ( \varTheta ) ( 24 s^{2} \mu^{L}_0 \mu^{U}_0 + (7+16 s^{2}) ((\mu^{L}_0)^{2} + (\mu^{U}_0)^{2} ) \nonumber\\ &\quad + 2s \mu^{U}_0 ({-}13 \mu^{L}_0 + 15\mu^{U}_0 ) \cos(x) + 7 (\mu^{U}_0)^{2} \cos( 2x) \nonumber\\ &\quad + \mu^{L}_0 ( (30s \mu^{L}_0 - 26 s \mu^{U}_0 - 28\mu^{U}_0 \cos(x)) \cos(x+\phi) + 7 \mu^{L}_0 \cos(2(x+\phi)) )), \end{align}
and
 \begin{align} {\mathsf{D}}_{yy}&={-}\frac{1}{1680}E_0^{2} \sin^{2}(\varTheta) ( (7-16s^{2})(\mu^{L}_0)^{2} - 24 s^{2} \mu^{L}_0 \mu^{U}_0 + (7+16s^{2})(\mu^{U}_0)^{2}\nonumber\\ &\quad + 28s \mu^{U}_0(-\mu^{L}_0 + \mu^{U}_0 ) \cos(x) +7 (\mu^{U}_0)^{2} \cos(2x) \nonumber\\ &\quad 7\mu^{L}_0 ({-}4(s(-\mu^{L}_0+\mu^{U}_0 ) + \mu^{U}_0\cos(x))\cos(x+\phi) +\mu^{L}_0 \cos(2(x+\phi)) ) ). \end{align}
Appendix D. Additional information related to the 3-D particle simulations
In this section, we provide additional information regarding the implementation of the particle simulations in Comsol Multiphysics 5.5. Settings specific to Comsol are indicated by italic fonts. We make an effort to describe the underlying numerical principles in terms of well-known concepts of the finite element method, for specific settings, however, a detailed description can be found in the Comsol Multiphysics reference guide (Comsol Multiphysics 2019).
We utilize the model implemented in Comsol Multiphysics 5.5, where particle trajectories are obtained under the influence of Brownian motion and the drag force acting on a particle (Kim Reference Kim2004; Comsol Multiphysics 2019). For each particle, the equation of motion is
 \begin{equation} \frac{\mathrm{d}}{\mathrm{d} t} ( m_{p} \boldsymbol{u}_{p} ) = \boldsymbol{F}_{d} + \boldsymbol{F}_{b} = \frac{1}{\tau_{p}} m_{p} ( \boldsymbol{u} - \boldsymbol{u}_{p} ) + \boldsymbol{\alpha} \sqrt{\frac{6 {\rm \pi}k_{B} \mu T d_{p}}{\varDelta t}}, \end{equation}
where  $m_{p}$ is the particle mass,
 $\boldsymbol {u}_{p}$ the particle velocity,
 $\boldsymbol {F}_{d}$ and
 $\boldsymbol {F}_{b}$ the expressions for the drag force and Brownian force, respectively,
 $\boldsymbol {u}$ the surrounding fluid's velocity,
 $\tau _{p}$ the particle's response time defined below,
 $k_{B}$ the Boltzmann constant,
 $\mu$ the dynamic viscosity of the surrounding fluid,
 $T$ the absolute temperature and
 $d_{p}$ the particle diameter. The expression
 $\boldsymbol {\alpha }$ is a vector containing normally distributed random numbers with zero mean and unit standard deviation. The random numbers at different time steps
 $\varDelta t$ are independent (Comsol Multiphysics 2019). The response time of a particle is
 \begin{equation} \tau_{p} = \frac{\rho_{p} d_{p}^{2}}{18 \mu}, \end{equation}
where  $\rho _{p}$ is the mass density of the particle material. The resulting molecular diffusion constant is
 \begin{equation} D = \frac{k_{B} T}{3 {\rm \pi}\mu d_{p}}. \end{equation}
Table 4 shows the choice of parameters used in the particle-tracking simulations. These parameters yield a diffusion coefficient of  $D = 1\times 10^{-10}$ m
 $^{2}$ s
 $^{-1}$, representative for a dye molecule in water. The computed response time of the particle is
 $\tau _{p} = 1.02$ ps, which means that for all practical purposes the particle velocity is identical to the velocity of the surrounding fluid.
Parameter values used in the particle-tracking simulations.

The initial particle distribution is generated by releasing particles from a uniformly spaced grid and equilibrating the particle ensemble over the channel height for times much longer than the diffusive time scale  $T_{dif,h}$. Thereby, we ensure that the initial release from the grid does not produce artefacts and also prevent sharp concentration gradients, which can lead to numerical problems in the 2-D model.
We have used the Newtonian formulation for the particles, as shown in (D1). In that context, a bouncing condition at the domain walls was used, given by
 \begin{equation} \boldsymbol{v} = \boldsymbol{v}_{c} - 2 ( \boldsymbol{n} \boldsymbol{\cdot} \boldsymbol{v}_c)\boldsymbol{n}, \end{equation}
where  $\boldsymbol {n}$ denotes the wall normal and
 $\boldsymbol {v}_c$ the particle velocity when hitting the wall. Since the time-step size is small compared with the diffusive time scale, wall interactions only occur at a small fraction of the time steps.