Introduction
Although advances have been made in our understanding of the pathophysiology of schizophrenia, the heterogeneity of the disorder impedes the effectiveness of biological and clinical research. The large number of cognitive and clinical symptoms within the syndrome and their considerable variability across patients likely reflects the impact of various etiological factors (Jablensky, Reference Jablensky2006). Such variability makes it harder to achieve a comprehensive understanding underlying brain pathology. Investigations using large sample sizes to study symptoms associated with dimensions of behavior that can be measured quantitatively, may advance our understanding of brain–behavior relationships within as well as across diagnostic categories. Investigating distinct symptoms of the disorder as a continuous variable may reveal more specific neurobiological mechanisms in schizophrenia.
Negative symptoms are characterized by flat or blunted affect, inability to experience pleasure (anhedonia), poverty of speech, lack of motivation and interest (avolition/apathy) and lack of desire to form relationships (Andreasen & Olsen, Reference Andreasen and Olsen1982). Patients with predominantly negative symptoms have poor pre-morbid adjustment during childhood or early adolescence and a low employment rate during adulthood, achieve low educational attainment and exhibit considerable cognitive impairment (Milev et al. Reference Milev, Ho, Arndt and Andreasen2005; Rosenheck et al. Reference Rosenheck, Leslie, Keefe, McEvoy, Swartz, Perkins, Stroup, Hsiao and Lieberman2006; Jeppesen et al. Reference Jeppesen, Petersen, Thorup, Abel, Øhlenschlæger, Christensen, Krarup, Jørgensen and Nordentoft2008).
Studies have shown widespread cortical thickness reductions across the brain in patients with schizophrenia compared with healthy controls with frontal and temporal regions being generally more affected than others areas (Nesvåg et al. Reference Nesvåg, Lawyer, Varnäs, Fjell, Walhovd, Frigessi, Jönsson and Agartz2008; Goldman, Reference Goldman2009; Schultz et al. Reference Schultz, Koch, Wagner, Roebel, Schachtzabel, Gaser, Nenadic, Reichenbach, Sauer and Schlösser2010). In line with prior work, Ehrlich et al. (Reference Ehrlich, Brauns, Yendiki, Ho, Calhoun, Schulz, Gollub and Sponheim2012) and Geisler et al. (Reference Geisler, Walton, Naylor, Roessner, Lim, Charles Schulz, Gollub, Calhoun, Sponheim and Ehrlich2015) recently reported marked reductions of cortical thickness in patients with schizophrenia, which were also related to executive functioning.
Executive functioning is often driven by incentives and motivation (Pessoa, Reference Pessoa2009). When we make decisions between options with different (subjective) value or learn from positive or negative feedback, those processes are governed by a neural circuit that centers around structures such as the ventral striatum and the medial orbitofrontal cortex (MOFC) (Schlagenhauf et al. Reference Schlagenhauf, Huys, Deserno, Rapp, Beck, Heinze, Dolan and Heinz2014; Deserno et al. Reference Deserno, Schlagenhauf and Heinz2016). Within this circuit, the MOFC is predominately linked to (subjective) value processing and positive affect (Burgdorf & Panksepp, Reference Burgdorf and Panksepp2006; Peters & Büchel, Reference Peters and Büchel2010; Grabenhorst & Rolls, Reference Grabenhorst and Rolls2011; Liu et al. Reference Liu, Hairston, Schrier and Fan2011; Price & Harmon-Jones, Reference Price and Harmon-Jones2011; Berridge & Kringelbach, Reference Berridge and Kringelbach2015), which is impaired in schizophrenia (Cohen & Minor, Reference Cohen and Minor2010; Kalkstein et al. Reference Kalkstein, Hurford and Gur2010). MOFC lesions in humans relate to deficits in reward-based learning, which can result in apathy and lack of affect (Hornak et al. Reference Hornak, Bramham, Rolls, Morris, O'Doherty, Bullock and Polkey2003; Fellows & Farah, Reference Fellows and Farah2005; Fisher et al. Reference Fisher, Shamay-Tsoory, Eran and Aharon-Peretz2011; Kühn & Gallinat, Reference Kühn and Gallinat2012). Accordingly, functional and structural imaging studies in healthy cohorts have reported associations between MOFC activity (and thickness) and characteristics that are comparable to the negative symptoms observed in schizophrenia (Harvey et al. Reference Harvey, Pruessner, Czechowska and Lepage2007; Ducharme et al. Reference Ducharme, Albaugh, Hudziak, Botteron, Nguyen, Truong, Evans, Karama, Ball, Byars, Schapiro, Bommer, Carr, German, Dunn, Rivkin, Waber, Mulkern, Vajapeyam, Chiverton, Davis, Koo, Marmor, Mrakotsky, Robertson, McAnulty, Brandt, Fletcher, Kramer, Yang, McCormack, Hebert, Volero, Botteron, McKinstry, Warren, Nishino, Almli, Todd, Constantino, McCracken, Levitt, Alger, O'Neil, Toga, Asarnow, Fadale, Heinichen, Ireland, Wang, Moss, Zimmerman, Bintliff, Bradford, Newman, Evans, Arnaoutelis, Pike, Collins, Leonard, Paus, Zijdenbos, Das, Fonov, Fu, Harlap, Leppert, Milovan, Vins, Zeffiro, Meter, Lange, Froimowitz, Botteron, Almli, Rainey, Henderson, Nishino, Warren, Edwards, Dubois, Smith, Singer, Wilber, Pierpaoli, Basser, Chang, Koay, Walker, Freund, Rumsey, Baskir, Stanford, Sirocco, Gwinn-Hardy, Spinella, McCracken, Alger, Levitt and O'Neill2014). For instance, functional connectivity between the orbitofrontal cortex and the dorsolateral prefrontal cortex was found to be dependent on levels of motivation (Szatkowska et al. Reference Szatkowska, Bogorodzki, Wolak, Marchewka and Szeszkowski2008).
Given these findings one could hypothesize that altered brain structure and functioning in the orbitofrontal cortex may represent one of the potential mechanisms underlying negative symptoms in schizophrenia. This is motivated by the idea that (i) neural representations of decision values may not be adequately generated and (ii) reward feedback might not get completely transformed into motivational drive for goal-directed behavior (Barch & Dowd, Reference Barch and Dowd2010; Deserno et al. Reference Deserno, Boehme, Heinz and Schlagenhauf2013).
Several functional imaging studies have assessed the brain-based correlates of negative symptoms in schizophrenia. An early PET (positron emission tomography) study found lower perfusion of several brain regions – including the MOFC – during hedonic judgments of positive and negative visual stimuli in patients with schizophrenia (Plailly et al. Reference Plailly, d'Amato, Saoud and Royet2006). More recent fMRI studies in patients with schizophrenia found neural responses in the medial prefrontal cortex to be exaggerated upon omission of expected reward but blunted upon receipt of unexpected reward (Schlagenhauf et al. Reference Schlagenhauf, Sterzer, Schmack, Ballmaier, Rapp, Wrase, Juckel, Gallinat and Heinz2009). Simon et al. (Reference Simon, Cordeiro, Weber, Friederich, Wolf, Weisbrod and Kaiser2015) showed that neural responses in the ventral striatum during a reward anticipation paradigm were negatively associated with apathy – a core negative symptom; while no associations between ventral striatal responses and positive symptoms were observed. Importantly, they found lower connectivity between the ventral striatum and the MOFC in individuals with schizophrenia compared with controls. Furthermore, in one of the aforementioned studies focusing on receipt of unexpected reward in schizophrenia, medial frontal cortical activation predicted task-related motivation, which in turn predicted anhedonia severity (Segarra et al. Reference Segarra, Metastasio, Ziauddeen, Spencer, Reinders, Dudas, Arrondo, Robbins, Clark, Fletcher and Murray2016). In line with this, another study could show that activity in the orbitofrontal cortex during hedonic processing was negatively correlated with anhedonia severity in people with schizophrenia (Harvey et al. Reference Harvey, Armony, Malla and Lepage2010).
With respect to structural imaging, gray matter density of the orbitofrontal cortex has also been associated with self-fulfillment achievement motivation in healthy individuals (Takeuchi et al. Reference Takeuchi, Taki, Nouchi, Sekiguchi, Kotozaki, Miyauchi, Yokoyama, Iizuka, Hashizume, Nakagawa, Kunitoki, Sassa and Kawashima2014). In patients with schizophrenia, Venkatasubramanian et al. (Reference Venkatasubramanian, Jayakumar, Gangadhar and Keshavan2008) found that lower left MOFC thickness was associated with higher negative symptom severity. Similar findings have been reported by Nenadic et al. (Reference Nenadic, Yotter, Sauer and Gaser2015), providing further evidence for the involvement of medial prefrontal regions in negative symptoms; though some negative findings also exist (Crespo-Facorro et al. Reference Crespo-Facorro, Roiz-Santiáñez, Pérez-Iglesias, Rodriguez-Sanchez, Mata, Tordesillas-Gutierrez, Sanchez, Tabarés-Seisdedos, Andreasen, Magnotta and Vázquez-Barquero2011; Xiao et al. Reference Xiao, Lui, Deng, Yao, Zhang, Li, Wu, Xie, He, Huang, Hu, Bi, Li and Gong2015).
Reasons for these inconsistencies may be twofold. First, most studies conducted to date have had rather moderate sample sizes, investigating on average about a hundred patients. Second, moderating effects of confounders such as antipsychotic medication, illness severity, or duration of illness that may influence the association between thickness and negative symptoms have not been investigated extensively. Analyses of larger samples will increase power allowing to understand prior inconsistencies in findings as well as to study potential moderator effects.
Here we set out to investigate the structural correlates of negative symptoms in a large meta-analysis including almost 2 000 individuals with schizophrenia. Based on previous structural imaging findings, we hypothesized that lower MOFC thickness is associated with negative symptom severity in schizophrenia. As part of an exploratory analysis we also aimed to understand relationships with cortical thickness in other prefrontal brain regions.
Methods
Study samples
The current study includes a total of 1 985 individuals with schizophrenia or schizophrenia spectrum diagnoses (see also SM Section 2.1, subsection s) from 17 research groups around the world as part of the ENIGMA Schizophrenia Working Group as described previously (van Erp et al. Reference van Erp, Hibar, Rasmussen, Glahn, Pearlson, Andreassen, Agartz, Westlye, Haukvik, Dale, Melle, Hartberg, Gruber, Kraemer, Zilles, Donohoe, Kelly, McDonald, Morris, Cannon, Corvin, Machielsen, Koenders, de Haan, Veltman, Satterthwaite, Wolf, Gur, Gur, Potkin, Mathalon, Mueller, Preda, Macciardi, Ehrlich, Walton, Hass, Calhoun, Bockholt, Sponheim, Shoemaker, van Haren, Pol, Ophoff, Kahn, Roiz-Santiañez, Crespo-Facorro, Wang, Alpert, Jönsson, Dimitrova, Bois, Whalley, McIntosh, Lawrie, Hashimoto, Thompson and Turner2015). Schizophrenia diagnosis was based on the Diagnostic and Statistical Manual of Mental Disorders (DSM, editions III-R or IV) or the International Classification of Diseases (ICD, edition 10) criteria using either the Structured Clinical Interview for DSM Disorders (SCID), the Comprehensive Assessment of Symptoms and History (CASH), the Present State Examination (PSE), and/or a review of case files/medical records by trained clinicians. All individuals had negative symptom ratings and structural imaging data available. Mean sample size at each research site was 117 patients (range 23–244). See online Supplementary Table S1 for more details.
Each study sample was collected with participants’ written informed consent approved by local Institutional Review Boards. The authors assert that all procedures contributing to this work comply with the ethical standards of the relevant national and institutional committees on human experimentation and with the Helsinki Declaration of 1975, as revised in 2008. No individual subject imaging or clinical data were shared among the ENIGMA institutions.
Negative symptom measures and score conversion
Negative symptom severity was assessed using the Scale for the Assessment of Negative Symptoms (SANS) (Andreasen, Reference Andreasen1983) and the Positive and Negative Syndrome Scale (PANSS) (Kay et al. Reference Kay, Fiszbein and Opler1987). Negative symptom scores were calculated as follows:
-
(1) Total SANS (composite) score = sum of SANS items 1–7, 9–12, 14–16, 18–21, and 23–24;
-
(2) Global SANS (summary) score = sum of SANS items 8, 13, 17, 22, and 25 (which include affective flattening, alogia, avolition, anhedonia, and attention global rating scores, respectively); or
-
(3) PANSS negative = sum of PANSS items 8–14.
To harmonize scores, we decided to convert all negative scores (i.e. PANSS Negative and Total SANS Composite scores) to Global SANS (Summary) scores following recommendations by Andreasen (Reference Andreasen1983) and using the algorithms published in van Erp et al. (Reference van Erp, Preda, Nguyen, Faziola, Turner, Bustillo, Belger, Lim, McEwen, Voyvodic, Mathalon, Ford and Potkin2014). For additional details see online Supplementary Section 1.1.
Image acquisition and processing
Based on the previous literature (Venkatasubramanian et al. Reference Venkatasubramanian, Jayakumar, Gangadhar and Keshavan2008; Nenadic et al. Reference Nenadic, Yotter, Sauer and Gaser2015) we followed a region-of-interest (ROI) approach, focusing on the MOFC, while 10 other prefrontal regions were considered in additional exploratory analyses (see online SM Section 2.2). Left and right MOFC thickness values – based on the Desikan–Killiany atlas (Desikan et al. Reference Desikan, Ségonne, Fischl, Quinn, Dickerson, Blacker, Buckner, Dale, Maguire, Hyman, Albert and Killiany2006) – were obtained using FreeSurfer (http://surfer.nmr.mgh.harvard.edu) from high-resolution T1-weighted structural brain scans. Details on study type (single site or multisite), scanner vendor/strength/sequence, acquisition parameters and FreeSurfer versions used are provided in online Supplementary Table S1. For quality control, histograms of MOFC thickness values were generated and outliers were visually inspected by overlaying their parcellation on the subjects’ anatomical images. Only parcellations judged to be accurate upon visual inspection were subjected to statistical analyses (see online Supplementary Table S1 for information on outlier removal and online Supplementary Fig. S1 for left and right MOFC thickness descriptives by sample).
Statistical analyses
Within each sample, an association of negative symptoms with left and right MOFC thickness was analyzed using univariate linear regression analysis (R's linear model function lm) predicting mean MOFC thickness by global SANS score. The main analysis included age and gender as covariates. In cases of multi-site studies (FBIRN, MCIC, UMCU, and Osaka) binary dummy covariates were included in the model to account for n−1 sites. For samples where information was available, secondary models were run separately with each of the following covariates: (1) current antipsychotic medication [by medication group: atypical/typical/both/none; and by using chlorpromazine (CPZ) equivalents as described in Woods (Reference Woods2003), available in a subsample of n = 1178], (2) duration of illness, (3) age of onset (defined as onset of symptoms), (4) illness severity (measured using PANSS Total score), and (5) handedness (right/left/ambidextrous). Additional exploratory analyses were carried out to investigate the link between negative symptom severity and cortical thickness in schizophrenia spectrum subtypes and in 10 additional frontal brain regions. Results were ranked according to effect size. In addition, Bonferroni correction was applied to account for multiple testing (see online SM Section 2.2 for more details). Analyses of individual subject data were performed by the site that contributed the sample, using code created within the ENIGMA collaboration.
Meta-analyses
From each sample, standardized regression coefficients were extracted from the main and secondary models as a measure of effect size for the left and right MOFC using the lm.beta function in the lm.beta R package (Behrendt, Reference Behrendt2014). A meta-analysis was conducted over these effect sizes using the rma function in the R package metaphor (Viechtbauer, Reference Viechtbauer2010). We meta-analyzed the estimates across sites by weighting Fisher's r-to-z transformed effect size values by sample size in a random-effects model using the default restricted maximum-likelihood (REML) estimator. The same procedure was used to investigate the effects of age, gender, illness severity and duration of illness on MOFC thickness. For analyses, in which both left and right MOFC were analyzed, the significance threshold was corrected for two tests (p = 0.05/2 = 0.025). Descriptives are weighted by the sample size at each site using the weighted mean procedure in R (R Development Core Team, 2008).
Due to between-site differences in study characteristics such as antipsychotic medication, handedness and single v. multisite status (online Supplementary Table S1), we used moderator analyses to investigate between-sample differences.
Results
Demographics
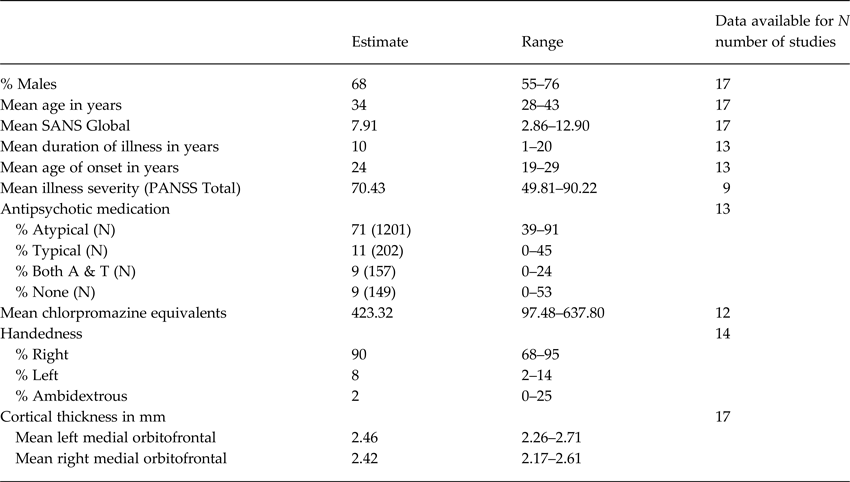
Mean age (weighted by sample-size) across patient samples was 34 years (range 28–43). Mean patient samples were 68% male (range 55–76%). The weighted mean duration of illness across the patient groups was 10 years (range 1–20) and mean age of onset was 24 years (range 19–29). For samples where current antipsychotic type and dose information was available, the weighted percentage of patients on first-generation (typical), second-generation antipsychotics (atypical), both typical and atypical or no antipsychotic medication was 11, 71, 9 and 9%. Ninety percent of patients were right-handed (range 68–95), while only 8% (range 2–14) were left-handed and 2% (range 0–25) were ambidextrous (Table 1 and online Supplementary Table S1).
Demographics

Means are weighted by study sample size.
Meta-analysis
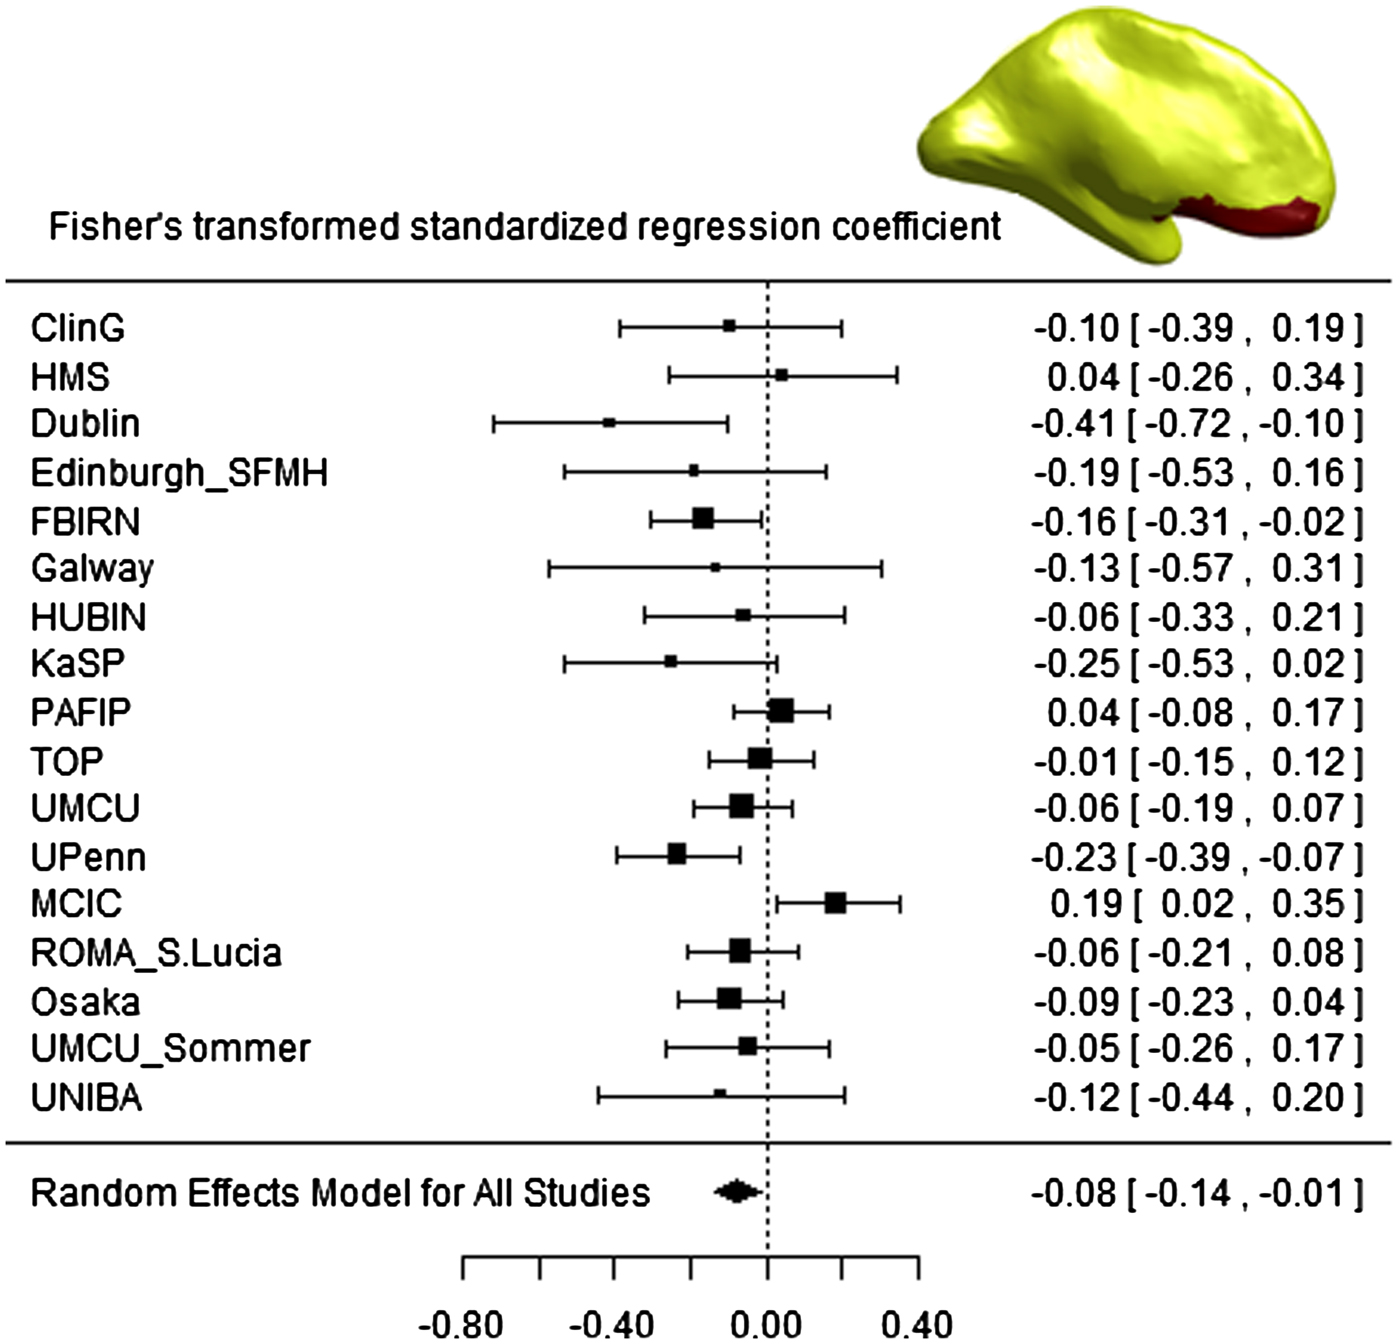
The weighted mean global SANS scores across the samples was 7.91 (range 2.86–12.90). Weighted mean MOFC thickness was 2.46 mm (range 2.26–2.71) in the left hemisphere and 2.42 mm (range 2.17–2.61) in the right hemisphere. Meta-analytical results showed that global SANS scores were negatively associated with left MOFC thickness (β std = −0.075; p SANS = 0.019; Fig. 1) after accounting for age, gender, and number of sites (if applicable). Funnel plot inspection gave no indication of bias (Egger's p = 0.193; online Supplementary Fig. S2). However, effect sizes were found to be heterogeneous [Q(16) = 26.399; p = 0.049; I 2 = 42.38%]. We found only a trend effect (but in the same direction) of global SANS on right MOFC thickness (β std = −0.064; p SANS = 0.055). For detailed results, see online Supplementary Section 2.1, sections a and b.
Forest plot of association between global SANS and cortical thickness in the left MOFC across all 17 study sites, controlling for age, gender and number of sites [if applicable; of note the global SANS-left MOFC thickness relationship did not differ between single v. multisite samples (p = 0.422; see online Supplementary Section 2.1, subsection o)]. Fisher's-transformed standardized regression coefficients are denoted by black boxes. Black lines indicate 95% confidence intervals (CIs). The combined estimate for all sites is represented by a black diamond with the outer edges of the diamond indicating the CI limits.

Effects of covariates and moderator analyses
We carried on investigating both within-sample and moderating between-sample effects of age, gender, illness severity, duration of illness, and age of onset as well as antipsychotic medication, handedness, schizophrenia spectrum subtypes, and multisite status based on samples, for which this information was available (online Supplementary Table S1).
While a meta-analysis of within-sample effects indicated that left MOFC thickness decreased with age (β std = −0.237; p < 0.0001) and was lower in women (β std = −0.090; p < 0.0001), the main association of global SANS and left MOFC thickness remained significant (β std = −0.075; p SANS = 0.019, see main model above and online Supplementary Section 2.1, subsections a, c and d).
Overall illness severity (although correlated with negative symptoms; R 2 = 59.5%) did not associate with left MOFC thickness (p = 0.555) after accounting for age, gender, and site (if applicable), while the global SANS effect in the same model remained significant (β std = −0.113; p SANS = 0.036; see also online Supplementary Section 2.1, subsections e and f).
Duration of illness correlated negatively with left MOFC thickness (Fisher's z = −0.145; p < 0.001), but not with global SANS score (p = 0.190). While duration of illness also correlated strongly with age (Fisher's z = 0.834; p < 0.001), it did not associate with left MOFC thickness above and beyond age in the lower regression models (p = 0.199). However, additionally accounting for duration of illness within each sample also reduced the main effect of SANS on left MOFC thickness (p SANS = 0.068; see online Supplementary Section 2.1, subsections g and h). Similar diminishing effects were observed when investigating the influence of age of onset (which was highly correlated with duration of illness; Fisher's z = −0.658; p = 0.015), antipsychotic medication and handedness within each sample, which themselves did not moderate the global SANS – left MOFC thickness relationship between samples (p AO = 0.737; p med = 0.447; p hand = 0.580; see online Supplementary Section 2.1, sections i, j, and k). Investigating the effects of antipsychotic medication further, we found that mean left MOFC thickness estimates (p = 0.007), but not mean global SANS estimates (p = 0.454) differed by antipsychotic medication type (i.e. percentages of patients in each medication group in each sample, online Supplementary Section 2.1, subsections l and m). Specifically, compared with unmedicated patients, left MOFC reductions were larger at sites with a larger percentage of patients treated with atypical (β std = −0.006; p = 0.002) or typical AP (β std = −0.007; p = 0.003). Proportion of patients, who were treated with both antipsychotic medication types, was not associated with MOFC thickness (p = 0.444; online Supplementary Section 2.1, subsection l). The reductions observed in patients treated with atypical (but not typical) antipsychotic medication remained significant in analyses that included gender, age, or duration of illness as covariates (online Supplementary Section 2.1, subsections n and o). Current medication in CPZ units was not linked to left MOFC thickness (p CPZ = 0.170), while the main effect of negative symptom severity remained significant (β std = −0.095; p SANS = 0.040; online Supplementary Section 2.1, subsections q and r). Our main findings also remained stable (β std = −0.078; p SANS = 0.022), when restricting the analyses to patients with DSM-IV schizophrenia subtypes or schizoaffective/-phreniform disorder only (online Supplementary Section 2.1, subsection s).
Effect on other frontal regions
Exploratory analyses were used to analyse the associations between negative symptoms and 10 other frontal brain regions (separately for the left and right hemisphere), controlling for sex, age and site (if applicable). Regions with effects similar in size to the left MOFC were found in the left pars opercularis (β std = −0.082), the left and right lateral orbitofrontal gyrus (left: β std = −0.076, right: β std = −0.073), and the left superior frontal gyrus (β std = −0.066). After Bonferroni correction for multiple testing, two regions – the left lateral orbitofrontal gyrus (corrected p SANS = 0.034) and left the pars opercularis (corrected p SANS = 0.02) – remained significant (online SM Section 2.2). The direction, size, and lateralization of the effect compared well with our main results.
Discussion
Summary
In this study, we investigated the relationship between MOFC thinning and negative symptom severity in schizophrenia. We found that negative symptoms related inversely to cortical thickness in this brain region, with effects appearing greater in the left hemisphere compared with the right. This finding was independent of general illness severity, age, and gender, but somewhat lessened when covarying for the influence of antipsychotic medication, age of onset, and duration of illness (with the latter two variables being highly correlated). Exploratory analyses identified associations between negative symptoms and thickness in the lateral orbitofrontal gyrus and pars opercularis in the left hemisphere. Our investigation has a number of strengths. First, using a meta-analytical approach, we were able to increase our sample size by a magnitude of 10 compared with previous studies. Second, the large sample allowed for the investigation of potentially influencing, but small effects of age, gender, illness severity, duration of illness, age of onset, antipsychotic medication, and handedness. Third, our sample included diverse patient groups that spans a broad age range allowing for a generalization of our findings.
Cortical thickness in the left MOFC and negative symptoms
Our results are in agreement with two previously published studies. Specifically, the association between MOFC thickness and negative symptoms in the study by Venkatasubramanian et al. (Reference Venkatasubramanian, Jayakumar, Gangadhar and Keshavan2008) was also negative and only present in the left hemisphere. Comparing patient groups with distinct symptom profiles, the study by Nenadic et al. (Reference Nenadic, Yotter, Sauer and Gaser2015) also reported prefrontal reductions (including the MOFC) in patients characterized by predominantly negative symptoms compared with subgroups with predominantly paranoid and disorganized symptoms. However, there have also been reports, which failed to identify an association between MOFC thickness and negative symptoms (Xiao et al. Reference Xiao, Lui, Deng, Yao, Zhang, Li, Wu, Xie, He, Huang, Hu, Bi, Li and Gong2015; Bodnar et al. Reference Bodnar, Hovington, Buchy, Malla, Joober and Lepage2014; Ansell et al. Reference Ansell, Dwyer, Wood, Bora, Brewer, Proffitt, Velakoulis, McGorry and Pantelis2015; McKechanie et al. Reference McKechanie, Moorhead, Stanfield, Whalley, Johnstone, Lawrie and Owens2015). There are several potential explanations for these discrepant findings. First, all previous studies were based on rather small samples (between 40 and 130 patients) and hence potentially underpowered to detect the weak, but robust association, we were able to identify in our study based on almost 2000 patients. Furthermore, previous samples differed substantially in important characteristics such as illness chronicity and mean age. Of note, all studies that accepted the null hypothesis consisted of young (<25 years), first-episode patients, while studies which reported effects, such as by Venkatasubramanian et al. (Reference Venkatasubramanian, Jayakumar, Gangadhar and Keshavan2008) and Nenadic et al. (Reference Nenadic, Yotter, Sauer and Gaser2015), included older (>30 years), chronic patients. Similarly, mean age across our samples ranged from 28 to 43 years while mean duration of illness was 10 years, indicating that the association between negative symptoms and MOFC thickness might be more apparent when patients are older or in later stages of the disorder.
Animal and human studies suggest that neurons in the MOFC encode the subjective value of expected reward (Furuyashiki & Gallagher, Reference Furuyashiki and Gallagher2007; Roesch & Olson, Reference Roesch and Olson2007), providing evidence that the MOFC mediates processes associated with the learning and retrieval of (subjective) value information, which guides decision-making and goal-directed behavior (Bechara et al. Reference Bechara, Damasio, Damasio and Anderson1994, Reference Bechara, Tranel and Damasio2000). Several studies suggest that negative symptoms in schizophrenia are associated with reinforcement learning abnormality (Waltz et al. Reference Waltz, Frank, Robinson and Gold2007; Strauss et al. Reference Strauss, Frank, Waltz, Kasanova, Herbener and Gold2011). Gold et al. (Reference Gold, Waltz, Matveeva, Kasanova, Strauss, Herbener, Collins and Frank2012) observed that patients with high-negative symptoms were less able to take expected reward values into account during decision-making processes. As a result, patients fail to learn actions that lead to positive outcomes, while they outperform controls in avoiding punishing outcomes, showing that the findings were not indicative of general learning deficits, but of deficits in reward-related learning. Such findings may help to explain the high prevalence of avolition and anhedonia in schizophrenia, two core dimensions of negative symptomatology. In line with this, aberrant neural responses to reward feedback was observed in medial prefrontal areas of patients with schizophrenia (Schlagenhauf et al. Reference Schlagenhauf, Sterzer, Schmack, Ballmaier, Rapp, Wrase, Juckel, Gallinat and Heinz2009), although results from this and several other studies also emphasize the relevance of ventral striatal pathways pointing towards an involvement of a wider striatal–prefrontal network in reward feedback (Schlagenhauf et al. Reference Schlagenhauf, Huys, Deserno, Rapp, Beck, Heinze, Dolan and Heinz2014; Mørch-Johnsen et al. Reference Mørch-Johnsen, Nesvåg, Faerden, Haukvik, Jørgensen, Lange, Andreassen, Melle and Agartz2015; Radua et al. Reference Radua, Schmidt, Borgwardt, Heinz, Schlagenhauf, McGuire and Fusar-Poli2015).
The involvement of additional frontal brain regions is also supported by the results of our study, as exploratory analyses showed further associations of negative symptoms with the left lateral orbitofrontal gyrus and left pars opercularis. In line with our initial hypothesis, the lateral orbitofrontal gyrus is also predominantly involved in value processing (Kringelbach & Rolls, Reference Kringelbach and Rolls2004; Zald et al. Reference Zald, McHugo, Ray, Glahn, Eickhoff and Laird2014). The pars opercularis is mainly linked to language processing (Belyk & Brown, Reference Belyk and Brown2014), which might relate to poverty of speech. An association of comparable effect size to our main finding, but not significant after Bonferroni correction, was also identified in the superior frontal gyrus [including the pre-supplementary motor area that is involved in volition (Haggard, Reference Haggard2008; Bracht et al. Reference Bracht, Schnell, Federspiel, Razavi, Horn, Strik, Wiest, Dierks, Müller and Walther2013)], which might be associated with the lack of ability for spontaneous, self-generated action that relates strongly to the avolition subdomain of negative symptoms.
We observed a significant association between gray matter thickness and negative symptoms only in the left hemisphere. This aligns well with several other reports of significant gray matter reductions in frontal regions of the left hemisphere (but not the right hemisphere) in patients with schizophrenia (Suzuki et al. Reference Suzuki, Nohara, Hagino, Kurokawa, Yotsutsuji, Kawasaki, Takahashi, Matsui, Watanabe, Seto and Kurachi2002; Kawasaki et al. Reference Kawasaki, Suzuki, Nohara, Hagino, Takahashi, Matsui, Yamashita, Chitnis, McGuire, Seto and Kurachi2004, Reference Kawasaki, Suzuki, Takahashi, Nohara, McGuire, Seto and Kurachi2008; Honea et al. Reference Honea, Crow, Passingham and Mackay2005). Moreover, cerebral lateralization of patients with schizophrenia tends to be less leftward lateralized and may even be rightward lateralized rather than symmetric. While some have argued that this might possibly reflect perturbations in the lateralization process underlying left cerebral dominance for language (Kawasaki et al. Reference Kawasaki, Suzuki, Takahashi, Nohara, McGuire, Seto and Kurachi2008), others believe that this atypical lateralization represents a greater involvement of the right hemisphere, which may relate to a broader, more diffuse semantic network (Grabner et al. Reference Grabner, Fink and Neubauer2007). With respect to value processing, the left prefrontal cortex has been linked stronger to motivation and positive affect than the right (Davidson, Reference Davidson2004; Price & Harmon-Jones, Reference Price and Harmon-Jones2011). Hence, structural abnormalities in this region could link to deficits in the capacity to experience positive affect, a hallmark feature of negative symptoms.
In sum, our finding of a negative association between left MOFC thickness and negative symptoms underline the importance of this region in motivational and executive functioning, which is commonly impaired in schizophrenia patients (Barch & Dowd, Reference Barch and Dowd2010).
Potential moderators
Illness severity
We found that the effect of negative symptoms on left MOFC thickness was independent of general illness severity. That is, the MOFC might be specifically involved in motivational and executive aspects of schizophrenia as opposed to general schizophrenia psychopathology. Two other cortical thickness studies also failed to identify a significant correlation between illness severity (as measured using PANSS total scores) and thickness in any cortical region (Rimol et al. Reference Rimol, Hartberg, Nesvåg, Fennema-Notestine, Hagler, Pung, Jennings, Haukvik, Lange, Nakstad, Melle, Andreassen, Dale and Agartz2010; Oertel-Knöchel et al. Reference Oertel-Knöchel, Knöchel, Rotarska-Jagiela, Reinke, Prvulovic, Haenschel, Hampel and Linden2013). Furthermore, van Haren et al. (Reference van Haren, Schnack, Cahn, van den Heuvel, Lepage, Collins, Evans, Hulshoff Pol and Kahn2011) identified an association between poor functional and symptomatic outcome [derived using a factor analysis on GAF (Global Assessment of Functioning), the Camberwell Assessment of Need scale, and PANSS] and cortical thinning in the superior temporal gyrus, but not in frontal areas. Also in line with this is a functional imaging study by Simon et al. (Reference Simon, Cordeiro, Weber, Friederich, Wolf, Weisbrod and Kaiser2015), who investigated whole-brain activation during a reward anticipation paradigm. The authors observed that negative symptoms (especially signs of apathy), but not positive symptoms, were inversely correlated with activation in the ventral striatum, which at the same time showed reduced connectivity with the MOFC in patients compared with controls, further supporting the role of the MOFC in negative symptoms in schizophrenia.
Duration of illness
Duration of illness correlated strongly and negatively with left MOFC thickness (but not with negative symptom scores), although effects were dependent on age effects on thickness. Negative symptoms no longer predicted thickness significantly when covarying for age and duration of illness (which was highly correlated with age and not predictive of MOFC thickness in the combined model) in the same model. This may indicate that some of the variance in thickness explained by negative symptoms depends on these variables. In this respect and as explained above, it is of interest that studies of first-episode patients did not find an association between symptoms and thickness in the MOFC. Ansell et al. (Reference Ansell, Dwyer, Wood, Bora, Brewer, Proffitt, Velakoulis, McGorry and Pantelis2015) studied very young (mean age of 22 years) psychosis patients, who had been diagnosed for the first time within the last 3 months. The authors found no effects of negative symptoms on thickness in prefrontal areas (although they did report that negative symptoms related to reduced thickness in parietal regions, but only in patients treated with first-generation antipsychotics). Crespo-Facorro et al. (Reference Crespo-Facorro, Roiz-Santiáñez, Pérez-Iglesias, Rodriguez-Sanchez, Mata, Tordesillas-Gutierrez, Sanchez, Tabarés-Seisdedos, Andreasen, Magnotta and Vázquez-Barquero2011) also studied first-episode patients and reported no significant relationship between negative symptoms and lobar cortical thickness. In the light of these previous findings and considering that participants in our study were predominantly older, chronic patients, our results might be more specific to later stages of the disorder.
Antipsychotic medication
Although the relationship between negative symptoms and left MOFC thickness did not vary by antipsychotic medication group in our moderator analysis, some amount of variance in left MOFC thickness was explained through antipsychotic medication effects, with patients treated with atypical antipsychotics showing the most robust reductions. Notably, when we used current medication in CPZ equivalent units as a quantitative measures of antipsychotic medication (at the cost of a reduced sample size), an effect on MOFC thickness was not observed. While past studies predominantly reported volume and thickness deficits in frontal brain regions in patients treated with typical compared with those treated with atypical antipsychotics or unmedicated patients (van Haren et al. Reference van Haren, Schnack, Cahn, van den Heuvel, Lepage, Collins, Evans, Hulshoff Pol and Kahn2011; Lesh et al. Reference Lesh, Tanase, Geib, Niendam, Yoon, Minzenberg, Ragland, Solomon and Carter2015; Vita et al. Reference Vita, De Peri, Deste, Barlati and Sacchetti2015), there have also been many conflicting findings (Cahn et al. Reference Cahn, Hulshoff Pol, Lems, van Haren, Schnack, van der Linden, Schothorst, van Engeland and Kahn2002; Ho et al. Reference Ho, Andreasen, Ziebell, Pierson and Magnotta2011). Attempting to reconcile previous reports, it has been suggested that antipsychotic medication effects on brain structure might be substance specific (Xiao et al. Reference Xiao, Xu, Zhang, Wei, He, Jiang, Li, Dyck, Devon, Deng and Li2008) and might also depend on illness chronicity and the duration of untreated psychosis. Some studies reported that medication effects on frontal brain structures were apparent especially during the early phase of treatment and that the effect size increased with longer durations of untreated psychosis [for a review see (Aderhold et al. Reference Aderhold, Weinmann, Hägele and Heinz2014)]. Genetic predisposition and substance use could also interact with antipsychotic medication (Tregellas et al. Reference Tregellas, Shatti, Tanabe, Martin, Gibson, Wylie and Rojas2007; Hartz et al. Reference Hartz, Ho, Andreasen, Librant, Rudd, Epping and Wassink2010). With respect to our own findings we would like to stress that this is a purely correlational result, which does not in any way imply a causal relationship between antipsychotic medication intake and cortical thinning. Considering that we only investigated the possible effect of current antipsychotic medication, future studies are necessary to investigate this relationship in more detail by studying estimates of cumulative antipsychotic medication such as equivalent dose by time of exposure or treatment intensity in dose-years (Andreasen et al. Reference Andreasen, Pressler, Nopoulos, Miller and Ho2010, Reference Andreasen, Liu, Ziebell, Vora and Ho2013).
Limitations
The results of this study have to be seen in the light of the following limitations. First, our study was strongly hypothesis-driven in that we focused on effects in the MOFC due to its role in value processing. As part of our exploratory analyses we also identified associations of comparable effect size in other brain regions including the pars opercularis and lateral orbitofrontal gyrus. Further studies are needed to investigate whether these associations are driven by processes that are not directly linked to value processing. Secondly, given the cross-sectional design of this study, we were unable to address directional effects. That is, we were not able to determine whether cortical thinning precedes or follows the development of negative symptoms. A range of factors such as measures of cumulative antipsychotic medication or relapse duration (Andreasen et al. Reference Andreasen, Pressler, Nopoulos, Miller and Ho2010, Reference Andreasen, Liu, Ziebell, Vora and Ho2013), which we were unable to investigate, might modulate the observed association and should be investigated in subsequent studies. Third, we included patients within the schizophrenia spectrum and used a measure of global negative symptom severity, but it is possible that effects were driven by schizophrenia subtype or subdimension-specific characteristics.
Conclusion
We investigated the relationship between negative symptoms and cortical thickness in the MOFC in a large cohort of schizophrenia patients, comprising almost 2 000 patients. Negative symptom severity was significantly associated with thickness in this region in the left, but not the right hemisphere. This association was irrespective of age, gender, and illness severity, but possibly modulated by antipsychotic medication and duration of illness. Our findings provide further insight into symptom-related pathophysiological processes of schizophrenia.
Collaborators
Members of the Karolinska Schizophrenia Project consortium (KaSP): Farde L., Karolinska Institutet, Department of Clinical Neuroscience, Centre for Psychiatry Research, Stockholm, Sweden; Flyckt L., Karolinska Institutet, Department of Clinical Neuroscience, Centre for Psychiatry Research, Stockholm, Sweden; Engberg G., Karolinska Institutet, Department of Physiology and Pharmacology, Stockholm, Sweden; Erhardt S., Karolinska Institutet, Department of Physiology and Pharmacology, Stockholm, Sweden; Fatouros-Bergman H., Karolinska Institutet, Department of Clinical Neuroscience, Centre for Psychiatry Research, Stockholm, Sweden; Cervenka S., Karolinska Institutet, Department of Clinical Neuroscience, Centre for Psychiatry Research, Stockholm, Sweden; Schwieler L., Karolinska Institutet, Department of Physiology and Pharmacology, Stockholm, Sweden; Piehl F., Karolinska Institutet, Department of Clinical Neuroscience, Neuroimmunology Unit, Stockholm, Sweden; Agartz I., NORMENT, KG Jebsen Centre for Psychosis Research, Division of Mental Health and Addiction, University of Oslo, and Department of Psychiatric Research, Diakonhjemmet Hospital, Oslo, Norway, and Department of Clinical Neuroscience, Karolinska Institutet, Centre for Psychiatry Research; Victorsson P., Karolinska Institutet, Department of Clinical Neuroscience, Centre for Psychiatry Research, Stockholm, Sweden; Collste K., Karolinska Institutet, Department of Clinical Neuroscience, Centre for Psychiatry Research, Stockholm, Sweden; Orhan F., Karolinska Institutet, Department of Physiology and Pharmacology, Stockholm, Sweden; Malmqvist A., Karolinska Institutet, Department of Physiology and Pharmacology, Stockholm, Sweden; Hedberg M., Karolinska Institutet, Department of Physiology and Pharmacology, Stockholm, Sweden.
Acknowledgements
ENIGMA was supported in part by a Consortium grant (U54 EB020403 to PMT) from the NIH Institutes contributing to the Big Data to Knowledge (BD2K) Initiative, including the NIBIB and NCI. The authors would also like to express their gratitude for the personal support from the Deutsche Forschungsgemeinschaft (Research Fellowship to E.W.; Wa 3635/1–1). For additional support, see online Supplementary Section 3.
Declaration of Interest
None.
Supplementary Material
The supplementary material for this article can be found at https://doi.org/10.1017/S0033291717001283