I. INTRODUCTION
Neutron irradiation of materials in nuclear power plant or experimental reactor induces atomic displacements which lead to significant microstructural evolutions, ranging from crystalline-to-amorphous phase transformation of secondary phases to the introduction of large concentrations of point defects which could assist diffusion processes or the formation of solute aggregates in crystalline lattices. These microstructural evolutions bring significant modifications of the physical and mechanical properties of the irradiated material. Reference Onimus, Béchade, Konings, Allen, Stoller and Yamanaka1 Because of the sample activation, only few studies have been performed after neutron irradiation. A large part of the literature about irradiation effects on matter for nuclear applications makes use of charged particles Reference Was, Averback, Konings, Allen, Stoller and Yamanaka2 which allow to study a wide range of conditions (temperature, various flux, and/or fluence, for instance). Nevertheless, these irradiations are not always representative of neutron irradiation and only few micrometers depth are affected by irradiation. Here, we focus on neutron-irradiated materials using synchrotron x-ray based techniques.
To characterize the microstructure of neutron-irradiated materials, various experimental tools are available at the present time in nuclear environment, especially at Commissariat à l’Energie Atomique et aux énergies alternatives (CEA). The devices are always introduced in glove-box or hot-cells to avoid irradiation and/or contamination of operators: the microstructural evolutions induced by neutron irradiation can be followed mainly using not only scanning electron microscopy, transmission electron microscopy (TEM), atom probe tomography (APT), but also nuclear microprobes (Rutherford backscattering spectrometry or nuclear reaction analysis). However, these techniques are local probes and bring information for an extremely limited sample volume which could be not representative of the whole volume. Therefore, a good statistic can only be obtained by performing many examinations which are very time consuming. To address this issue, diffraction analysis using neutron facilities, or diffraction and absorption analyses using synchrotron sources is of utmost interest. As demonstrated in previous experiments, x-ray diffraction (XRD) measurements from synchrotron source are appropriated to detect and finely characterize the secondary phases even the smallest ones dispersed in rather low volume fraction of material. Reference Béchade, Menut, Lescoat, Sitaud, Schlutig, Solari, Llorens, Hermange, de Carlan, Ribis and Toualbi3,Reference Béchade, Menut, Doriot, Schlutig and Sitaud4 On one hand, diffraction patterns allow us to identify the structural changes of precipitates from line-profile analyses of diffraction peaks; on the other hand, x-ray absorption fine structure (XAFS) spectroscopy is particularly useful for studying, at the atomic scale, the local structure around a specific absorbing atom within the material that possesses short-range (up to about 6 Å) or no translational order (amorphous structure). XAFS spectroscopy provides a practical and simple way to study elements of minor and even trace contents (down to hundreds of few parts per million), giving a unique and direct measurement of chemical and physical states of dilute species over the whole sample volume. Thus, the interpretation of XAFS data for industrial material where the absorbing atom studied is located in various secondary phases (showing different compositions, structures, densities, and grain sizes down to few nanometers), even in the matrix, is more challenging than for a quite homogeneous and “pure” material, where target species are clearly located in a specific phase. For this reason, information from other techniques such as APT, TEM, and XRD may be useful to help in analyzing the XAFS data.
In this paper, two nuclear materials, both designed for the fuel assembly cladding, are analyzed by synchrotron x-ray based techniques (XRD and XAFS) to characterize finely the crystallographic evolution under neutron irradiation of the secondary phases (especially the nanostructured ones): (i) oxide dispersion strengthened (ODS) alloys for GEN IV reactors and (ii) M5™ Zr-based alloys for GEN II–III reactors. Results obtained are discussed and enriched with TEM observations performed on the same samples. Reference Doriot, Verhaeghe, Béchade, Menut, Gilbon, Mardon, Cloue, Miquet, Legras, Comstock and Barberis5–Reference Doriot, Gilbon, Béchade, Mathon, Legras, Mardon, Rudling and Kammenzind8
ODS ferritic/martensitic steels are promising cladding materials for fuel assembly of new generation nuclear reactors such as sodium-cooled fast reactor and structural component of fusion reactors (first wall material). Reference Ukai, Konings, Allen, Stoller and Yamanaka9 Ferritic body-centered cubic (BCC) steels have good swelling resistance up to very high neutron doses, but bad mechanical creep properties especially at high temperature. Because of the reinforcement by a homogeneous dispersion of stable nanosized particles (size of the smallest <3 nm), the mechanical properties of ODS alloys have been largely improved. Many studies have been conducted to follow the evolution of these nanosized dispersed particles during fabrication process in terms of nature, composition, distribution, or size. The strong development of R&D programs, especially in France, United States, and Japan, Reference Doriot, Verhaeghe, Béchade, Menut, Gilbon, Mardon, Cloue, Miquet, Legras, Comstock and Barberis5,Reference Dubuisson, de Carlan, Garat and Blat10–Reference Tavassoli, Diegele, Lindau, Luzginova and Tanigawa12 led to large improvement of ODS alloys. However, due to very few irradiation opportunities, the knowledge of the evolution of these nanosized particles during neutron irradiation is limited. Indeed, on the one hand, APT and TEM studies show that nanometric oxides are stable at high temperature during neutron irradiation. Reference Ribis and Lozano-Perez13,Reference Yamashita, Akasaka, Ukai and Ohnuki14 On the other hand, according to the recoil resolution phenomena, Reference Frost and Russell15 ballistic ejection at high irradiation doses could lead to the precipitation of new nanosized particles at the vicinity of the large oxides. Thus, nanometric oxide behavior under irradiation has to be studied by using a more statistical approach which can be obtained due to synchrotron radiation.
Zirconium-based alloys are widely used in GEN II & III light water reactors due to their excellent properties for in-service conditions at ∼350 °C. Reference Onimus, Béchade, Konings, Allen, Stoller and Yamanaka1,Reference Béchade, Menut, Doriot, Schlutig and Sitaud4 The current challenge, in that case, is to improve the nuclear fuel assemblies' performance, mainly with regard not only to corrosion resistance but also to mechanical behavior under irradiation (creep, growth). This is why AREVA proposed a new Zr–1 wt% Nb–O alloy, named M5™ (M5™ is a trademark of AREVA NP), in replacement of Zircaloy-4 (Zy–4, a Zr–1.3 wt% Sn alloy). Many examinations have already underlined the microstructural and microchemical stability of the M5™ alloy under neutron irradiation, Reference Doriot, Gilbon, Béchade, Mathon, Legras, Mardon, Rudling and Kammenzind8 since the most important microstructural change related is the irradiation-enhanced needle-like precipitation. These niobium-rich particles were found, by TEM observation, to be about 4–6 nm in length and 1.5 × 10²² m−3 in number density. Reference Béchade, Menut, Doriot, Schlutig and Sitaud4,Reference Doriot, Verhaeghe, Béchade, Menut, Gilbon, Mardon, Cloue, Miquet, Legras, Comstock and Barberis5,Reference Doriot, Gilbon, Béchade, Mathon, Legras, Mardon, Rudling and Kammenzind8 However, this precipitation under irradiation is suspected for leading to a noticeable decrease in niobium content in the matrix, which may have an influence on the alloy thermal creep behavior. To complete and refine microstructural investigations of β-Nb precipitates (not only irradiation-enhanced precipitates but also native precipitates) a more statistical approach using XRD with excellent resolution (using synchrotron source) is necessary.
II. MATERIALS STUDIED AND EXPERIMENTAL FACILITIES
A. Materials studied
For both ODS and M5™ materials, x-ray analyses have been performed on the thin foils already used for TEM observations before and after neutron irradiation. Reference Doriot, Verhaeghe, Béchade, Menut, Gilbon, Mardon, Cloue, Miquet, Legras, Comstock and Barberis5–Reference Doriot, Gilbon, Béchade, Mathon, Legras, Mardon, Rudling and Kammenzind8 Small strips are machined from fuel cladding to obtain 3 mm disks, punch out leading to a final thickness of 100 µm after mechanical polishing, then jet-polished with a TENUPOL device, bringing a hole in the center of the thin foil for TEM observation. Irradiated samples were prepared in hot cells at CEA (SEMI).
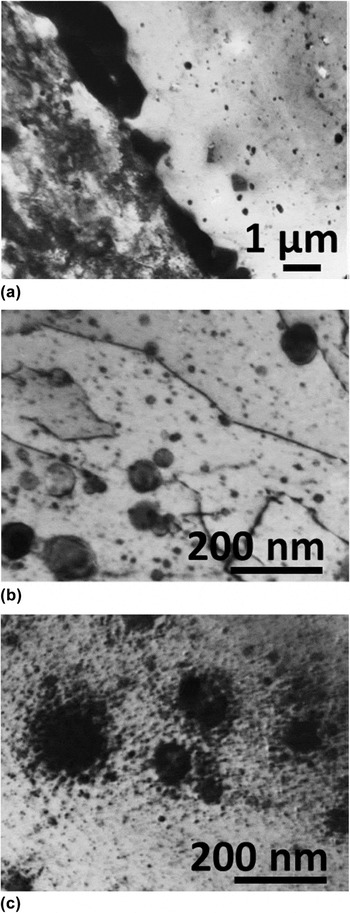
The ODS ferritic steel named DY (or also named DT2203Y05; chemical composition in weight percent (wt%): Fe–12.9Cr–1.46Mo–0.08Mn–0.03Si–2.03Ti–0.45Y) has been developed in the early seventies by CEN-SCK Mol (Belgium). Reference De Bremaecker16 It has been made by mechanical alloying from elementary metallic elements and Y2O3 and TiO2 powders, then solution annealed at 1050 °C for 15 min and aged at 800 °C for 24 h. The microstructure is formed of two different types of grains. Reference Dubuisson, Schill, Hugon, Grislin, Seran, Nanstad, Hamilton, Garner and Kumar6,Reference Monnet, Dubuisson, Serruys, Ruault, Kaitasov and Jouffrey7,Reference Zakin, Prioul and Francois17 The first ones are elongated in the extrusion direction with a high tangled dislocation density. The second ones are recrystallized grains containing few dislocations. Except for a few oxide-free bands parallel to the extrusion direction, the oxide dispersion is homogeneous throughout the grains and no difference in oxide distribution has been observed between the two types of grains. Reference Dubuisson, Schill, Hugon, Grislin, Seran, Nanstad, Hamilton, Garner and Kumar6,Reference Monnet, Dubuisson, Serruys, Ruault, Kaitasov and Jouffrey7,Reference Zakin, Prioul and Francois17 Figure 1 gives an overview of the sample microstructure before neutron irradiation [Figs. 1(a) and 1(b)].
Microstructure of the DY ODS ferritic steel. (a) The two types of grains and the χ-phase at the grain boundary. (b) Oxide distribution in a recrystallized grain. (c) After neutron irradiation at 803 K up to a fluence of 78.8 dpa.

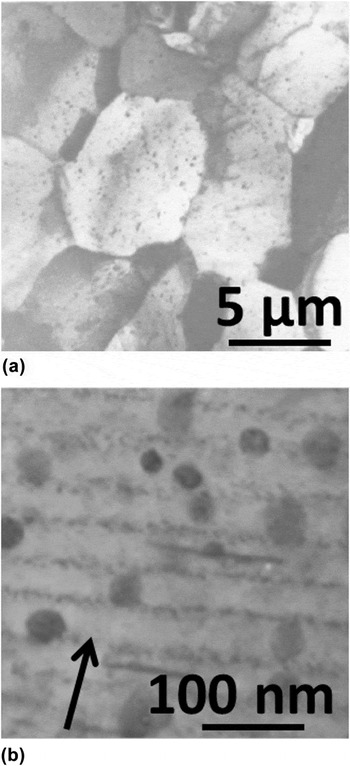
The M5™ microstructure (chemical composition in wt%: Zr–0.97Nb–0.02Fe–0.11O–0.003Cr and <0.003Sn) is characterized by a homogeneous highly refined dispersion of β-Nb native precipitates (ranging about 45 nm) in fully recrystallized equiaxed grains of 5 µm-average mean size [Fig. 2(a)].
Microstructure of the M5™ (a) before and (b) after neutron irradiation (the arrow indicates the diffracting vector <00.2> used to image the radiation-enhanced β-Nb precipitates).

B. Neutron irradiation conditions
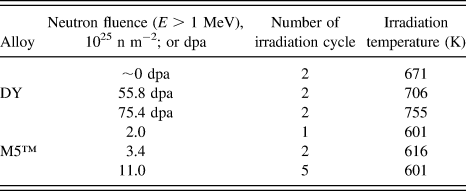
Concerning the ODS alloy, fuel pin claddings made from DY were irradiated in an experimental capsule placed in a special subassembly in the central part of the PHENIX reactor core (France). The maximum dose (E > 1.0 MeV) reached corresponds to 81 dpa. The irradiation temperatures are ranged from 671 to 851 K, depending on the position along the fuel column. The irradiation conditions are given in Table I. It is important to underline that the maximum dose was reached in two steps. After a first dose of 72.7 dpa, the fuel pins remained in the reactor core for about 2400 h at a temperature kept to a minimum of 671 K. Then, a second neutron irradiation was performed, adding a dose of 8.3 dpa. After this second irradiation, the fuel pins remained about 600 h at a temperature kept to a minimum of 671 K.
Irradiation conditions: for ODS in the PHENIX sodium-cooled fast neutron reactor and M5™ in PWR power plants.

M5™ alloys were irradiated in pressurized water reactor (PWR) power plants. The neutron fluence (E > 1 MeV) and irradiation temperature were deduced from the local fuel burnup. The irradiation conditions are given in Table I.
C. Experimental procedure
1. X-ray analyses at the multi-analysis on radioactive samples (MARS) beamline of synchrotron SOLEIL
MARS beamline is dedicated to the study of radioactive matter in multidisciplinary fields: physics, chemistry, and biology, by means of multi-technique equipment. This beamline aims at extending the possibilities of synchrotron-based x-ray characterization toward a wider variety of radionuclides with activities up to 18.5 GBq per sample. Thus, a specific and innovative infrastructure has been developed to carry out analyses on all types of emitters (α, β, γ, and neutron) by including shielding elements around the endstations to respect the public dose rate outside the beamline. The beamline facility is more extensively described elsewhere. Reference Sitaud, Solari, Schlutig, Llorens and Hermange18
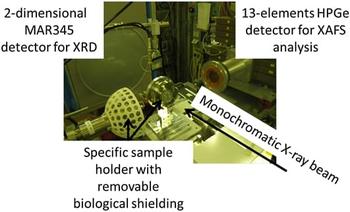
Because of the sample activity, the analyses discussed in this paper are performed with a specific sample holder. This sample holder is equipped with a removable biological shielding allowing radioactive sample transportation and handling at the MARS beamline. Figure 3 gives a general view of the experimental setup.
Experimental setup operated on the CX3 end-station at the MARS beamline. XRD in transmission and XAFS analyses in fluorescence mode could be performed sequentially on a highly radioactive sample.

a. Procedure for XRD analyses
For both ODS and M5™, XRD analyses are performed in transmission mode just below the Y-K edge at 16.5 keV (equivalent to a wave length of 0.751515 Å), and with a collimated beam of 100 × 100 µm². A two-dimensional imaging plate MAR345 is used to collect the diffraction patterns. Final XRD patterns are obtained by averaging 10 acquisitions. Samples are positioned on an 8-axis motorized stages manipulator (6 translations, 2 rotations with a sphere of confusion of 10 µm). Calibration parameters are determined from diffraction pattern of a LaB6 standard powder (NIST SRM 660, a = 4.15695 Å). After corrections, the Debye–Scherrer diffraction rings are unwrapped and integrated versus the azimuthal angle to produce normal one-dimensional diffraction pattern. LaB6 powder reference is also used to determine the instrumental peak shape and resolution because of the expected negligible material contribution. The line-profile refinement is described by a pseudo-Voigt function Reference Wertheim, Butler, West and Buchanan19 (linear combination of a Lorentzian and a Gaussian peak-shape function with a mixing parameter η which gives the amount of Lorentzian character). The refinement of the full width at half maximum (FWHM) is described by the expression of the Caglioti polynomial. Reference Caglioti, Paoletti and Ricci20
For ODS materials, the MAUD software package (release 2.46) Reference Lutterotti21 is used to correct 2D diffraction patterns, and thus to perform line profile refinement and microstructural analysis. For M5™, Fit2D Reference Hammersley, Svensson, Thompson, Graafsma, Kvick and Moy22 software is used to calibrate the 2D diffraction patterns and produce one-dimensional diffraction pattern. The line profile refinement is done using Fullprof Reference Rodriguez-Carvajal23 and TOPAS P (Bruker) Reference Coelho24 softwares.
In both cases, full-pattern profile matching method Reference Le Bail25 is used as it is well fitted considering multiphases and highly textured materials. It does not require any structural information except an approximate unit cell estimate and the instrumental resolution parameters. Line intensities are individually refined according to all hkl values as permitted by the space group considered and microstructural parameters (i.e., coherently diffracting domains and microstructural distortions) evaluated. Least-square algorithm is used to minimize the chi-square function between the observed and the calculated data.
b. Procedure for x-ray absorption fine spectroscopy analyses
XAFS measurements have been done only on ODS alloys. These experiments are performed at room temperature in fluorescence mode at the Y-K edge by using a 13-element high-purity germanium (HPGe) detector. The fluorescence detector is placed at 90° to the incident beam in the horizontal plane, with sample at an angle of 45° with respect to the beam. So, the position of the detector is selected to minimize the elastically scattered radiation, which is a significant source of noise in fluorescence XAFS, by exploiting the polarization of the x-ray beam. Such a configuration was chosen because Y is the major constituent of the nanosized particles and XRD experiments could be performed just below the edge with a large d-spacing domain accessible without modifying the beamline setup. The spot size of the monochromatic x-ray beam is about 300 × 300 µm² (H × V). The energy calibration is carried out with a metallic yttrium foil and the maximum of the first derivative of the absorption edge is set to 17.038 keV; the scanned energy range is optimized from 16.7 to 17.9 keV. Thus, Y metal, cubic-Y2O3, cubic pyrochlore-type Y2Ti2O7, orthorhombic-Y2TiO5 are chosen as extended XAFS (EXAFS) and x-ray absorption near edge spectroscopy (XANES) standards. Spectra are obtained by adding the data acquired from 10 detectors among the 13, and merged over 10 acquisitions. To extract normalized XANES and EXAFS oscillations from the absorption spectra, background and data merging are done with ATHENA software. Reference Ravel and Newville26 Background is then removed by using a pre-edge linear function. Moreover, atomic absorption is simulated with an order 2 polynomial function and experimental EXAFS spectra are Fourier transformed by using a Hanning window over the k-space ranging from 3.2 to 12.0 Å−1 with a k-weight of 3. The R-space cutoff for background subtraction is chosen about 1.1 Å. Curve fitting of the EXAFS spectra is performed using ARTEMIS Reference Ravel and Newville26 for R-value in the range of 1.0–6.0 Å. The known crystallographic information of the standard oxides given above is used as data inputs to build the first, second, and third shell models around the Y atoms. Amplitudes and phases for the interatomic scattering paths are calculated by the ab initio code FEFF 8.20. Reference Ravel and Newville26
III. RESULTS AND DISCUSSIONS
A. ODS alloys: Before and after irradiation in fast breeder reactor
1. XRD analysis results
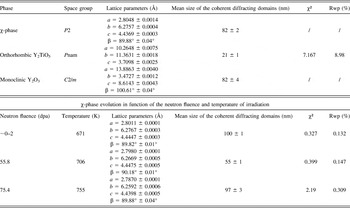
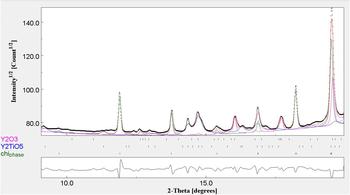
Full-pattern profile matching results on the DY nonirradiated reference sample are summarized in Table II and shown in Fig. 4. The intermetallic χ-phase is indexed with a slight lattice distortion from the orthorhombic to the monoclinic symmetry with a mean size of about 82 nm. However, TEM observations reported a size of the χ-phase precipitates estimated to 1 µm in width and 10 µm in length with many defects inside as antiphase boundaries. Reference Zakin, Prioul and Francois17 The coherently diffracting domain determined from the XRD line broadening of the pattern is the average distance between two defects or antiphase boundaries in the precipitates. Lattice parameters for this phase do not evolve with the increasing neutron fluence (Table II) without any significant evolution of the coherently diffracting domains of the particles as the irradiation temperature remains below 773 K. However, TEM analysis shows an increase in Cr and Mo contents and a decrease in Ti content, both appearing to be correlated with the irradiation temperature rather than with the irradiation dose. Antiphase boundaries observed in these precipitates could explain the size drop of the sample irradiated up to 55.8 dpa.
Refinement parameters of the ODS DY alloy reference (nonirradiated) sample and, χ-phase lattice parameter evolution versus fluence.

XRD full-pattern profile matching analysis for nonirradiated DY reference sample: black dots are the experimental data, the red line is the fitting result. Peak location indexes (from top to down) are reported to monoclinic-Y2O3 (purple), orthorhombic-Y2TiO5 (blue), and χ-phase (green). The difference pattern is represented in the lower part of the figure. A R weighted profile value of 8.98% (χ² = 7.17) is reached at the end of the fitting procedure for a R expected weighted profile value of 6.14. A goodness of fit about 1.46 is reached.

Moreover, XRD characterization of the nonirradiated sample suggests that two types of Y–Ti–O enriched particles exist: the monoclinic-Y2O3 and orthorhombic-Y2TiO5 oxides (Fig. 2 and Table II). XRD analysis of the monoclinic-Y2O3 pattern shows a mean particle size of about 80 nm. For the orthorhombic-Y2TiO5, the mean size is about 21 nm. However, these results do not completely match with TEM observations on the same sample.
Reference Dubuisson, Schill, Hugon, Grislin, Seran, Nanstad, Hamilton, Garner and Kumar6,Reference Monnet, Dubuisson, Serruys, Ruault, Kaitasov and Jouffrey7
TEM observations report two oxide populations. The first one is a homogeneous distribution of fine oxides (<50 nm), mainly composed of yttrium oxides (85Y–10Al–<5Ti, O; wt%), which could correspond not only to our monoclinic-Y2O3, but also of yttrium–titanium oxides (70Y–25Ti–5Al, O; wt%), whose composition gets closer to the orthorhombic-Y2TiO5 one. The second one is a population of larger oxides (50 nm–1 µm) composed of yttrium–titanium oxides (70Y–25Ti–5Al, O; wt%) and large titanium oxides (>90 TiO; wt%). It is important to note that, because of the d-spacing investigated, large titanium oxides could not be clearly identified by using our diffraction results. Nevertheless, XRD results (mean sizes and nature of precipitates) are in rather good agreement with many studies.
Reference Mathon, Perrut, Zhong and de Carlan27–Reference Klimiankou, Lindau, Moslang and Schroder30
Especially, Sakasegawa et al.
Reference Sakasegawa, Chaffron, Legendre, Brocq, Boulanger, Poissonnet, de Carlan, Béchade, Cozzika and Malaplate28
report that the nanoparticle size depends on the chemical composition. Thus, titanium enrichment will decrease the particle size. Moreover, even if the pure cubic-Y2O3 phase (space group
 $Ia\bar 3$
, BCC bixbyite-type structure) is the most thermodynamically stable for this chemical composition, the monoclinic-Y2O3 (space group C2/m) distortion may exist if particle size decreases to nanometer scale.
Reference Katagiri, Ishizawa and Marumo29,Reference Klimiankou, Lindau, Moslang and Schroder30
Elsewhere, after neutron irradiation, we observe a rather complex evolution of diffraction peaks with increasing neutron fluence: diffraction lines broadened and vanished as the volume fraction and mean size of the precipitates decrease. These observations probably relate to the recoil resolution phenomena Reference Frost and Russell15 of larger oxides due to ballistic ejection of metallic atoms by impinging neutrons. Thus, a halo of tiny oxide precipitates at the vicinity of larger ones has been observed by TEM [Fig. 1(c)]. Reference Dubuisson, Schill, Hugon, Grislin, Seran, Nanstad, Hamilton, Garner and Kumar6,Reference Monnet, Dubuisson, Serruys, Ruault, Kaitasov and Jouffrey7 These particles showed a depletion of Al more than Ti and Y. It should be stressed that oxides in DY were not only pure Y–Ti–O compound but also included Al. Similar TEM observations were performed on 1DS (Fe–10.98Cr–0.40Ti + 0.31Y; wt%) and 1DK (Fe–12.7Cr–0.57Ti + 0.27Y; wt%) alloys after neutron irradiation. Reference Yamashita, Oka, Ohnuki, Akasaka and Ukai31 APT analyses, for ODS Eurofer (Fe–8.92Cr–0.41Mn–0.33V + 0.24Y, wt%) irradiated in the fast neutron research reactor BOR-60 (Russia), were reported concerning the local chemical composition. Reference Rogozhkin, Aleev, Zaluzhnyi, Nikitin, Iskandarov, Vladimirov, Lindau and Moslang32 Since the concentration of elements was increased after irradiation, both in nanometric oxides and in the surrounding matrix, one can suppose that this increase resulted from dissolution of larger yttria particles (>10 nm). Nevertheless, it is important to note that these larger yttria particles could not be observed by such APT analyses. Reference Rogozhkin, Aleev, Zaluzhnyi, Nikitin, Iskandarov, Vladimirov, Lindau and Moslang32 Thus, all these XRD, TEM, and APT analyses suggest that larger oxides may not be stable under irradiation and, at least, partly dissolved increasing the matrix concentration of solutes.
2. XAFS analyses at the Y-K edge results for ODS alloys
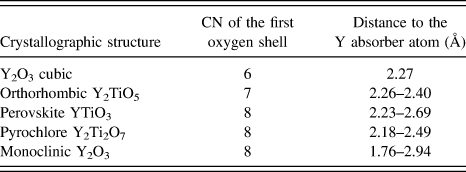
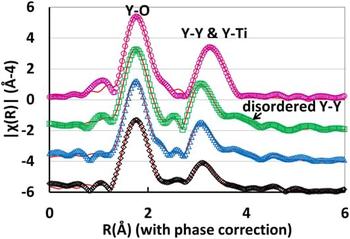
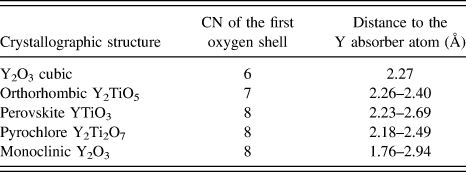
Concerning XAFS analysis, several structures can be used for the data analysis of Y–Ti–O oxides at the Y-K edge, such as cubic-Y2O3, orthorhombic-Y2TiO5, perovskite-YTiO3, pyrochlore-Y2Ti2O7, and monoclinic-Y2O3. Due to the extremely rich types of nanostructures experienced in ODS, none of them can be excluded a priori. About the EXAFS at the Y-K edge, all the Y–Ti–O structures show that, in the first shell around Y (Table III), there are only oxygen atoms which are located at several distances, ranging from 2.18 to 2.69 Å, with the exception of cubic-Y2O3 where the 6 oxygen atoms are distributed at one distance (2.27 Å). Monoclinic-Y2O3 is the only structure showing an oxygen atom at a distance lower than 2.0 Å. Nevertheless, all these first shell Y–O distances are rather similar. As a consequence, considering that orthorhombic-Y2TiO5 and monoclinic-Y2O3 are evaluated to be good candidates by XRD analysis, first Y–O shell of the Fourier transform for the EXAFS spectra of the nonirradiated reference sample is fitted with these two structures (Fig. 5).
CN and distance of the first oxygen shell of Y–Ti–O crystallographic structures used for the EXAFS fitting.
Fourier transform of the Y-K edge EXAFS oscillation (from the upper part to the lower part): DY reference sample (purple), DY neutron irradiated up to 55.8 dpa (green), DY neutron irradiated up to 75.4 dpa (blue), DY thermal aging at 671 K (black). EXAFS data fitting is plotted in red continuous line.

The fit of the first shell points out that a contribution of oxygen at low distance is extremely important. This contribution is observed in all samples independently of the neutron fluence. Concerning the second nearest neighbor contribution, qualitatively, all neutron-irradiated samples show a similar peak, whereas the reference sample is definitely different (Fig. 5). Moreover, in reference sample, the second peak is symmetric, which means that the contribution is most likely due to a small amount of patterns, whereas in all neutron-irradiated samples, the second peak has an asymmetric shape. Both two peaks are analyzed because the change of the second peak is a fingerprint of the phase change. The fittings point out that for nonirradiated DY, with exception of the contributions at the lowest distance, the orthorhombic-Y2TiO5 structure is most likely the predominant structure for both the first and second shells. Monoclinic-Y2O3 is also adjusted. The analysis of neutron-irradiated samples highlights that the contribution of the orthorhombic-Y2TiO5 is limited to the first shell, and the second peak fits well with the monoclinic-Y2O3. The second coordination shell demonstrates a contribution of Y–O that experiences various distances. Moreover, Ti contribution vanishes. The first shell amplitude fit using Y–O paths yields a bond distance of approximately 2.3 Å and Debye–Waller factors (σ2) ranging from 0.005 Å2, for the nonirradiated sample, to 0.008 Å2 for the highest neutron irradiation dose. This increase of the Debye–Waller factor is consistent with a disordering increase in the crystallographic structures used to model the EXAFS oscillations. The fitting parameter for the first shell coordination numbers (CNs) is lying between 7.5 and 8 oxygen atoms as nearest neighbors. CNs are consistent with XRD analyses that evidence a mix of complex oxides with CN equal to 8. Thus, Y forms a mixture of various species and the dispersed high-order shells in the Fourier transform of the Y-K edge EXAFS oscillation make it difficult to perform a proper analysis of the main species present in the alloy. Reference Béchade, Menut, Lescoat, Sitaud, Schlutig, Solari, Llorens, Hermange, de Carlan, Ribis and Toualbi3,Reference Degueldre, Conradson and Hoffelner33–Reference Liu, Odette and Segre35
However, Dubuisson et al. Reference Dubuisson, Schill, Hugon, Grislin, Seran, Nanstad, Hamilton, Garner and Kumar6 and Monnet et al. Reference Monnet, Dubuisson, Serruys, Ruault, Kaitasov and Jouffrey7 reported TEM analysis indicating that, before irradiation, DY oxide dispersion is composed of Ti oxides and two types of Y-based oxides, both including a small Al content. After in-pile irradiation, all the oxides have lost their Al content and only two types of oxides are evidenced: (i) a Ti-based oxide; (ii) an Y-based oxides with no more than 15 wt% of Ti instead of up to 25 wt% previously. The oxides seemed to lose more Al and Ti atoms than Y atoms, which is in rather good agreement with the XAFS analyses performed in this study.
B. M5™ before and after irradiation in PWR power plants
XRD analyses performed on M5™ allow to clearly identify the α-Zr matrix, Zr(Fe, Nb)2 Laves phase, and native β-Nb (Table IV). Reference Béchade, Menut, Doriot, Schlutig and Sitaud4,Reference Doriot, Verhaeghe, Béchade, Menut, Gilbon, Mardon, Cloue, Miquet, Legras, Comstock and Barberis5 However, for the Laves phase, only the (200) diffraction line related to the <a> lattice parameter, despite of its weak intensity, is adjusted. The mean size of the coherently diffracting domains is about 57 ± 23 nm which is similar to the size observed by TEM before neutron irradiation. As early as 1 PWR cycle of neutron irradiation, the Laves phase vanished in the diffuse background of the XRD pattern. This could correspond to the Laves phase transformation into β-Nb particles reported by Shishov in Zr–Nb alloys. Reference Shishov, Rudling and Kammenzind36 Nevertheless, the author reports that such a transformation occurs only after 3 PWR irradiation cycles (∼10 dpa). Thus, our XRD observation could be explained by the broadening of diffraction line due to the nanocrystallization of such very scarce particles. That way, after irradiation, prior Laves phase could add a contribution to the XRD profile of the β-Nb phases. Though, their contribution should be very small due to very small volume fraction of Laves phase particles.
Full-pattern profile matching for XRD analyses on M5™ before neutron irradiation.

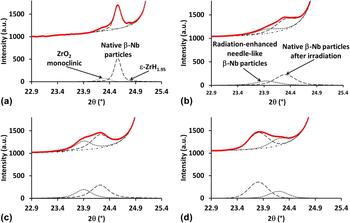
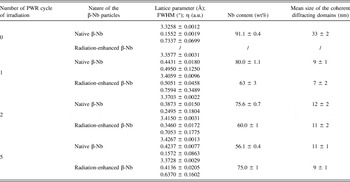
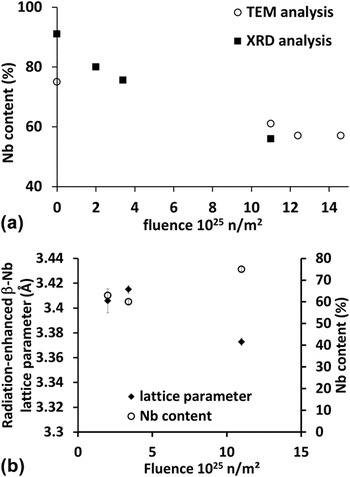
For the β-Nb phase, after neutron irradiation, the XRD line profile must be deconvoluted taking into account two different contributions (Fig. 6 and Table V). The full-pattern profile matching results with two BCC phases that agree with β-Nb particles with different lattice parameters. Reference Béchade, Menut, Doriot, Schlutig and Sitaud4,Reference Doriot, Verhaeghe, Béchade, Menut, Gilbon, Mardon, Cloue, Miquet, Legras, Comstock and Barberis5 By comparison with TEM observations [Fig. 2(b)], we made the assumption that a first contribution showing broadened peaks is attributed to the radiation-enhanced needle-like β-Nb particles (nanostructured particles), whereas the second contribution, showing sharper peaks, is related to the native β-Nb particles. On nonirradiated sample, XRD measurement of diffraction lines related to the native β-Nb particles confirms TEM observations showing that the precipitates are crystalline and have a size of about 35 nm in mean diameter. However, as early as 1 PWR cycle, the diffraction lines shift toward higher d-spacing. This line shift increases linearly up to 5 PWR cycles. Besides this phenomenon, the Nb content in the native β-Nb particles can be deduced with a Vegard's law Reference Cuello, Fernandez Guillermet, Grad, Mayer and Granada37 (Table V). Thus, the Nb content decreases with the increasing irradiation fluence until an equilibrium-like value of about 55 wt%. This result is in good agreement with TEM analyses on thin foils on extraction replicas Reference Liu, Odette and Segre35 which assume that, after neutron irradiation, Nb content in the β-Nb particles is close to 55 wt%. Thus, XRD analyses enable to confirm TEM results with a better accuracy while the weight fraction error is <1 wt% [Fig. 7(a) and Table V]. Moreover, the line broadening increases by a factor of 3 after 1 PWR cycle of irradiation and does not evolve any more up to 5 PWR cycles. Thus, because of the highly faulted aspect of these native precipitates, the mean size of the coherently diffracting domains drops from 33 ± 2 to 11 ± 1 nm. This result is also consistent with TEM observations which report a high defect density in the native β-Nb precipitates.
Comparison of the full-pattern profile matching decomposition of the β-Nb (200) diffraction line of M5™: (a) nonirradiated, (b) after 1 cycle, (c) 2 cycles, and (d) 5 cycles of irradiation in PWR power plant.

Evolution of lattice parameters and Nb content (wt%) of native β-Nb precipitates and radiation-enhanced β-Nb particles versus the number of cycle of irradiation in PWR from XRD analysis.

(a) Comparison of Nb content (wt%) of native β-Nb precipitates under irradiation by TEM chemical x-ray analysis and XRD analysis, (b) Nb content (wt%) of radiation-enhanced β-Nb precipitates under irradiation that can only be obtained by XRD after decomposition of the (200) diffraction line.

After neutron irradiation, as early as 1 PWR cycle of irradiation, XRD confirms the appearance of a new BCC phase that agrees with the β-Nb particles which have an enlarged lattice parameter. Reference Béchade, Menut, Doriot, Schlutig and Sitaud4,Reference Doriot, Verhaeghe, Béchade, Menut, Gilbon, Mardon, Cloue, Miquet, Legras, Comstock and Barberis5 The mean size of the coherently diffracting domains is about 10 ± 2 nm and remains constant with the increasing neutron fluence. Thus, our experimental geometry and conditions do not allow us to suggest a model of particle's shape as done by TEM and small angle neutron scattering (SANS) analysis. Reference Doriot, Verhaeghe, Béchade, Menut, Gilbon, Mardon, Cloue, Miquet, Legras, Comstock and Barberis5,Reference Doriot, Gilbon, Béchade, Mathon, Legras, Mardon, Rudling and Kammenzind8 Moreover, the Nb contents deduced from the lattice parameters appear to be about 60 wt% up to 2 PWR irradiation cycles [Fig. 7(b)]. The higher Nb contents determined for 5 PWR cycles, higher than the Nb content of the native β-Nb, has to be confirmed with complementary measurements especially at higher doses (up to 7 PWR cycles, study in progress). Thus, to obtain all the information regarding β-Nb radiation-enhanced precipitates XRD measurements have to be complete by TEM observations.
IV. CONCLUSIONS
The results obtained for various ODS alloys irradiated in nuclear reactors using XRD and XAFS (EXAFS and XANES) experiments are rather consistent with the results obtained using TEM on DY alloy. Oxide stability determining factors were believed to be irradiation temperature and/or type of complex oxide rather than irradiation fluence. Thus, the phenomenon of recoil resolution of larger oxides, which have no coherency with the matrix, is evidenced while a finer distribution of complex Y–Ti–O oxides still exists after irradiation. The coherency of the finest Y–Ti–O particles with the matrix observed in ODS material, combined with the effect of a low interfacial energy, is the relevant parameter regarding the oxide stability under irradiation and their active role as sinks for irradiation point defects. Reference Ribis and Lozano-Perez13,Reference Yamashita, Akasaka, Ukai and Ohnuki14,Reference Ribis and de Carlan38,Reference Ribis, Lescoat, Zhong, Mathon and de Carlan39 Nevertheless, the interpretation of x-ray based data for industrial material where various secondary phases showing different compositions, structures, and grain sizes down to few nanometers, is more challenging than for more local probes. For M5™, radiation-enhanced precipitation of β-Nb precipitates has been evidence and the crystallographic structure (lattice parameter and Nb content) is reported for the first time using the MARS beamline at synchrotron SOLEIL.
We highlighted that synchrotron radiation is an extremely useful tool for obtaining detailed microstructural information on irradiated materials. These analyses allowed us to validate the sample preparation methodologies and the dedicated sample-holder with removable biological shielding, and thus enabled us to perform the first experiments with samples with radioactive values over the French exemption limits on the MARS beamline. Consequently, this opens up the possibility of performing, for the same specimen irradiated in nuclear reactors and prepared in hot cells, studies by TEM, APT, and SANS at CEA-Saclay, XRD and XAFS at Synchrotron SOLEIL.
Future work will include other irradiation doses to attest the trends shown here. Moreover, by making use of the HR-XRD setup of the MARS beamline, line profile analyses are also planned to follow irradiation defects (loops, point defects, deformation, etc.) in the α-Zr matrix, for instance. The speciation and local environment of metal atoms in the second phase precipitates might be the key information to more deeply understand how these environments evolve under irradiation. However, clear comparisons with reference materials are generally difficult since, in alloys, metal atoms experience a complex range of local environments. Thus, the interpretation of XAFS data is more challenging in alloys than for a homogenous material or when species are clearly partitioned into a specific phase.
ACKNOWLEDGMENTS
The authors would like to thank AREVA NP and EdF for the financial support concerning the zirconium-based alloy study. We acknowledge SOLEIL for provision of synchrotron radiation facilities. We are also grateful to the staff of CEA/SEMI for the preparation of thin foils on radioactive materials, and S. Doriot and I. Monnet for the TEM observations on Zr and ODS alloys, respectively. The units in charge of radioactive material transportation and handling at CEA Saclay, CEA/SEMI, and the safety staff of SOLEIL are also gratefully thanked for their essential help.