


1. Introduction
The coronavirus disease 2019 (COVID-19) experience in Belgium has been very similar to that in other European countries. Two features, however, are special. First, Belgium has ranked at the top in many published league tables on the number of COVID-19 infections and on the mortality per capita. International press spoke of the ‘champion of coronavirus’ or of the ‘Belgian corona riddle’ (VRT, 2020). The natural question to ask is then: why was Belgium hit so hard? This may partly be explained by a second feature which is typical for Belgium: its complex institutions and the particular political situation of a minority government at the time of a major public health crisis. In this paper we focus on these two elements.
We first give a brief overview of the Belgian institutional structure and of the facts of the corona lockdown. We then discuss plausible explanations for the high reported infection and mortality rates in Belgium. In a final section, we go a bit deeper into the governance of the crisis and the complex relationship between scientists and politicians in determining adequate policy measures. This has been an issue in all countries, but the Belgian political structure created a specific situation.
2. A brief overview of the facts
2.1 The Belgian institutional structure
In recent decades, Belgium has seen a gradual development in the direction of decentralization of power from the Belgian federal state to its constituting regions and communities, also in the health (care) sector (Gerkens and Merkur, Reference Gerkens and Merkur2020). Broadly speaking, health insurance and the provision of curative health care are still organized at the federal level. Long-term care and prevention have been devolved to the decentralized level. This means, for instance, that nursing homes are organized by the decentralized communities, whereas hospital care is financed and organized at the federal level. Regulation and reimbursement of medicines is a federal competence, whereas the practical organization of the vaccination campaign is decentralized. All this has led to a complicated decision structure with a non-transparent division of power between the federal government and the decentralized entities. For instance, across these governments, there are eight ministers responsible for some aspect of public health and it is not clear how the division line of responsibilities runs exactly between these mandates. Moreover, unlike in many other federal states, Belgium does not have a state-of-emergency legislation that recentralizes command under exceptional circumstances, meaning that at all times the distribution of powers must be strictly respected.
On top of this complex state structure came a confused political situation. Since the elections of May 2019 the two largest parties at both sides of the linguistic border (the Flemish Nationalists and the Socialists at the French-speaking side) had not yet been able to reach an agreement to form a stable government at the federal level. At the regional level, however, majority governments were in place. During the weekend of 15 March 2020, an attempt to form a representative federal government to fight the corona crisis, failed. The main parties, however, agreed (without much enthusiasm but pressured by the exceptional circumstances) to continue with the minority government and to give it special powers. During the first wave (and until the end of September) there was therefore a temporary, minority government at the federal level, with less credibility to take drastic and unpopular decisions. Only from 1 October onwards, a new majority government was formed. All this has led to a complex interaction between politicians, who were bound by a complex and unstable political situation, and epidemiologists who wanted quick and stringent preventive measures.
2.2. A brief overview of policy measures
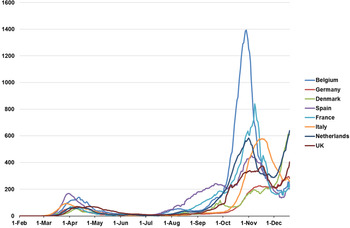
Figure 1 shows the daily number of confirmed COVID-19 cases per million people for Belgium and a selected set of European countries from the onset of the pandemic to December 2020. It shows the well-known pattern with two waves (and for Belgium a slight upsurge in August). Compared to the other countries, Belgium reached a high peak both in the first and in the second wave. However, the reported number of infections is difficult to interpret over a longer period, let alone to compare across countries, because of differences and changes in testing policy. In Belgium, there was a huge increase in the number of people tested over time. Therefore, we will further in this section focus on the number of hospitalizations and the number of deceased.
Daily confirmed COVID-19 cases per million people (rolling 7-day average).
Source: Data obtained from the European Centre for Disease Prevention and Control (ECDC)

Let us first briefly describe the facts. The first confirmed COVID-19 infection in Belgium occurred on 3 February 2020 in an expat who was repatriated from Wuhan, China. The main warning given to the Belgian population at that moment was to take basic behavioural precautions, mostly to wash hands regularly. In the weeks after 10 March, the day the first Belgian COVID-19 death became a fact (a 90-year old woman), the sense of urgency was more widespread and Belgium moved gradually in the direction of a complete lockdown. In a first stage, the government introduced some soft restrictive measures, including a recommendation to not organize large public events. Stricter measures were imposed on 12 March: restaurants, bars and schools were closed, there was a complete ban on mass events and teleworking became recommended as the norm. Flights from or to Belgium were cancelled. This was the moment when it became clear that the efforts to form a federal majority government had failed and that special powers were given to the minority government. On 17 March, social distancing measures were strengthened, e.g. by banning all outdoor gatherings and closing all the shops except essential ones for food and medicines. On 20 March, the Belgian borders were closed for all non-essential travel. However, the government made it clear that people were allowed to bike, walk or run – with maximum two persons and respecting social distance. This was seen as important for the mental and the physical health of the population. On 27 March and again 15 April, the containment measures were extended, until at least 3rd May. Anyone breaching the rules risked an on-the-spot fine of 250€. Overall, containment strategies were followed up reasonably well by a large majority in the population (De Coninck et al., Reference De Coninck, d'Haenens and Matthijs2020; Vanhamel et al., Reference Vanhamel, Meudec, Van Landeghem, Ronse, Gryseels, Reyniers, Rotsaert, Ddungu, Manirankunda, Katsuva, Peeters Grietens and Nöstlinger2021).
In addition to the public health measures, the government introduced a series of measures to mitigate the economic consequences of the restrictions. We will not discuss these (and later) economic compensations in this paper. Here also the picture in Belgium is similar to that in other European countries. On average, the income shocks were largely cushioned by the government through the formal social insurance system or through new measures (National Bank of Belgium, 2021). However, some weaker socio-economic groups who were less well integrated in the formal protection mechanisms slipped through the safety net (Capeau et al., Reference Capeau, Decoster, Vanderkelen and Van Houtven2021).
Already before the government had taken any measures, hospitals had been reorganizing to increase the number of beds in the intensive care unit (ICU), to restructure their emergency care units, to prepare staff (and volunteers) for the increase in COVID-19 patients (Van de Voorde et al., Reference Van de Voorde, Lefèvre, Mistiaen, Detollenaere, Kohn and Van den Heede2020). Less urgent elective procedures were postponed or cancelled. Patient visits became restricted. A system was set up to guide people with symptoms first to their GP with telephonic consultations. GP's would then decide to direct patients to emergency or not.
In this first wave, an important cause of concern was the shortage of medical material (masks and testing material). It is difficult to evaluate how much of the shortage was due to the situation on the international market, and how much was due to government failures. Yet at least one government mistake was clear: the government had not sustained the strategic stock of masks that was built up after previous epidemics. A second cause of concern was the situation in nursing homes, where mortality was very high. In the next section, we will come back to the situation in the nursing homes.
The lockdown measures succeeded in ‘flattening the curve’ (Coletti et al., Reference Coletti, Wambua, Gimma, Willem, Vercruysse, Vanhoutte, Jarvis, Van Zandvoort, Edmunds, Beutels and Hens2020). From 10th April onwards, all the main epidemiological indicators started to decline. From mid-May until the second half of July, there was a more or less stable incidence of around 100 new cases per day.
At the beginning of April, preparations started for the second stage: the gradual ‘exit strategy’. On 7 April, a Group of Experts for an Exit Strategy (GEES), composed of 10 medical experts, economists and topmanagers, was set up to advise the government. There were increased concerns about the mental health of the population in lockdown, especially of people living on their own (singles, elderly, etc.) and families with young children. Educational scientists pointed to the disastrous consequences of the school closures. Economic pressure from closed sectors (bars and restaurants, shops, culture, events, etc.) mounted to reopen the economy. 1.25 million individuals across Belgium (about one in three of the workforce) signed on for temporary unemployment benefits during the first wave. The government then launched a plan to relax the containment measures from 5th May onwards. Businesses and shops were allowed to reopen (of course respecting physical distancing). People could meet again with a restricted number of persons and there was a partial reopening of the schools.
In general, the Belgian population more and more had the optimistic impression that Belgium was over the hump. Yet, the number of new cases started again increasing from mid-July onwards, this time concentrated in densely crowded communities in the cities. The system of contact tracing and isolation of new infections, largely relying on telephone calls and people's recollection of their previous contacts, appeared to be largely deficient. National politicians reacted slowly and had to be pushed by the civil society, by local mayors and by the academic world to take stricter measures, but these did not go very far. A (near universal) duty to wear masks in public spaces was imposed and social contacts (without mask) were restricted. Clients in pubs and restaurants had to register so that possible loci of infection could be better defined, but the resulting information was rarely used for contact tracing. In the severely hit province of Antwerp, a curfew was imposed to avoid gatherings of larger groups of (mostly young) people outside pubs and after parties. This started a discussion (largely absent in the first wave) about the ‘proportionality’ of the measures, more specifically about their proven effectiveness and whether they are not an unacceptable infringement on personal rights. The discussion about the curfew was the starting point of a broader debate about the legal and constitutional basis for the special powers for the government, that allowed it to largely bypass the parliament, but the legal setup was not changed during 2020.
The growing awareness that there was not yet an effective system of contact tracing and isolation in place, reduced the resistance against the introduction of a mobile phone app that can list past contacts of infected persons. A mobile application (‘Coronalert’) was launched in September – at the end of 2020 more than 2 million people (about 20% of the population) had downloaded it.
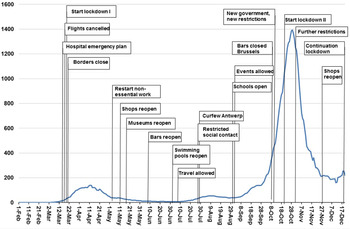
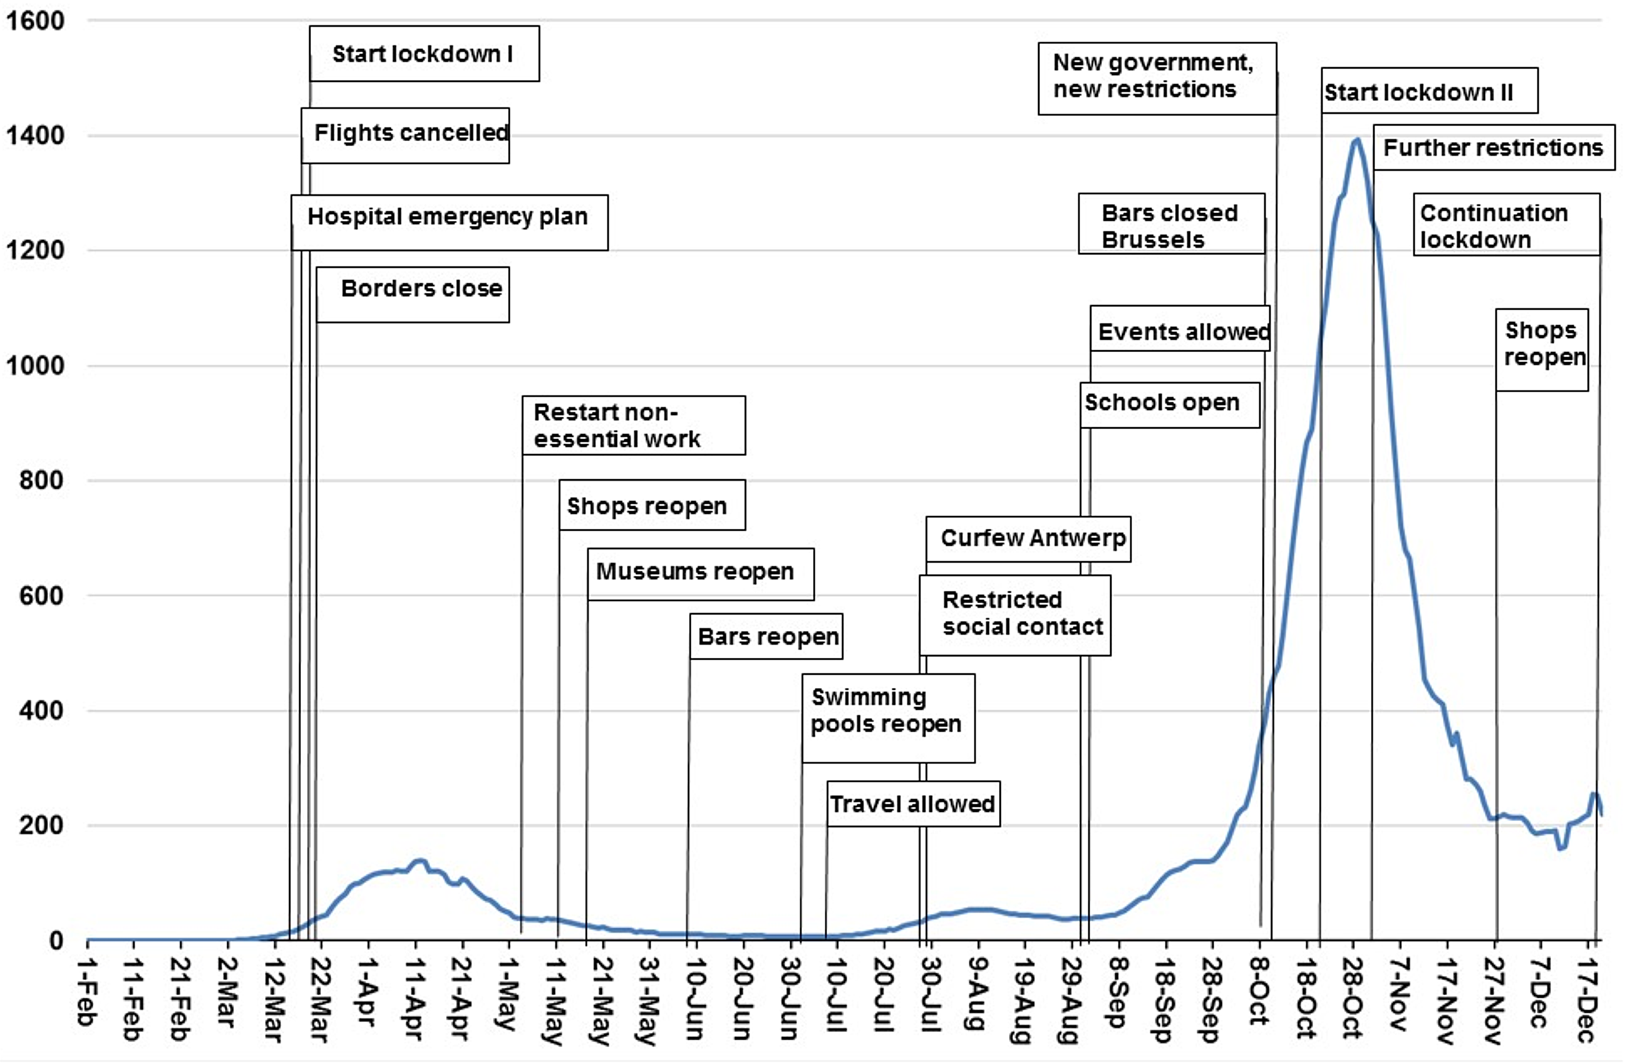
In September, the epidemiologists were warning that the situation became very worrying again. Although the absolute number of cases remained low, there were signs that the exponential growth process was regaining impetus. A similar development was observed in many European countries, but specific features in Belgium were the return of tourists from highly affected countries, such as Spain, and the reopening of the universities (with commuting students from all over Belgium). Moreover, the restrictive measures were much less respected, since a large fraction of the population clinged to the wishful thinking that the worst stage of the pandemic was over. Despite the warnings from virologists, wishful thinking was also dominating within the government. In fact, the composition of the GEES was changed and some epidemiologists and virologists, who were critical about relaxing measures, were discarded. The government basically put aside the warnings about the resurgence of the epidemic and relaxed the measures further, e.g. with respect to the number of personal contacts and the organization of culture or sports events. As Figure 2 shows, the consequences became clear very soon (Hens et al., Reference Hens, Faes and Gilbert2020). An exponential increase in the number of infections, a rapid increase in the number of hospitalized patients and a soaring number of patients in ICU catapulted Belgium to the top of all European league tables. The pressure on hospitals was more acute in the South than in the North of the country: patients had to be transferred to ICU departments in other Belgian hospitals, and even to Germany.
Policy measures and number of daily confirmed cases in Belgium.
Source: Data obtained from the European Centre for Disease Prevention and Control, and Belgian Federal Government
On 1 October finally a majority government came in power and it set out for a different style. The composition of the advisory board (now the GEMS) was adapted again. The government almost immediately reintroduced stricter measures, basically boiling down to a slightly softened version of the first lockdown. Restaurants, bars and non-essential shops were closed. Teleworking was first advised, but a week later made compulsory. Public events were forbidden. People could only have personal contacts (without mask) with one person that is not a household member (except for singles, who could have two personal contacts). Outside the households, one could only meet in groups of maximally four persons and with respect for the physical distancing rules. If physical distancing was impossible, mask wearing was compulsory. Contrary to the first wave, primary and secondary schools were not closed, but the autumn holiday was prolonged and some restrictions were imposed for older pupils. The measures were introduced until mid-December but the government had announced repeatedly that the aim now was to really ‘crush’ the curve, rather than flatten it, and that it was likely that the restrictions would remain in place until 2021, beyond the Christmas period.
Overall, the acceptance of the measures in the population improved again (compared to the situation in the summer), but there was still more resistance than in the first wave. More severe enforcement policies were enacted. Figure 2 shows the effects of the new lockdown. As in the first wave, the restrictive measures proved to be very effective in getting the virus under control, even more effective than projected by the epidemiological models.
In the second half of December, the epidemic was gaining strength again in Belgium as elsewhere in Europe. Yet the government decided not to impose stricter measures but to focus on more stringent enforcement. The justification for this decision was that the measures in place are already as strict as the ones introduced in other European countries while the Belgian situation was now among the best in Europe. There were hardly any relaxations concerning social contacts in the Christmas period, however, and this certainly contributed to keep the spread of the virus under control until the beginning of 2021.
3. (Why) is Belgium hit so severely?
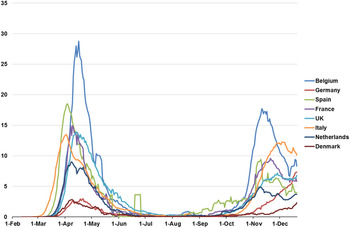
Let us now return to the question of why Belgium seems hit so severely. Figure 3 shows that Belgium did not only have a high number of confirmed cases (as shown in Figure 1) and which can (partly) be the result of increased testing, but that it also has a relatively high mortality rate of COVID-19. To explain this, some obvious hypotheses have been put forward. Belgium is very densely populated [second highest in Europe, 377 inhabitants/km2 (Worldbank, 2020)] and, due to its central location, an important transit zone for all kinds of traffic that can spread the virus. It can better be compared with large cities (e.g. Stockholm) than with sparsely populated countries (e.g. Sweden). Within the country there is a lot of mobility, with people commuting long distances for work and university students travelling each weekend between the university and their home town. International travel also played an important role: in the first wave the virus was imported by tourists coming back from Italy, in the second wave one observes a strong spread of the Spanish variant of the virus. Of course, this latter phenomenon can also be ascribed to deficient policies, as it would have been possible to control better the infection status of returning citizens as well as their subsequent quarantine. Some have argued that cultural and behavioural factors also played a role in Belgium's high rankings: that Belgians do not easily abide by ‘the rules’ and that they exploited inevitable loopholes in the restrictive measures as a kind of national sport. However, international comparisons of the degree to which restrictive measures are respected do not indicate that Belgium is an outlier in this respect (see, e.g., Fetzer et al., Reference Fetzer2020) – and it seems highly unlikely that they are an important explanatory factor of the relatively high infection rate.
Daily new confirmed COVID-19 deaths per million people (7-day rolling average).
Source: Data obtained from the European Centre for Disease Prevention and Control.

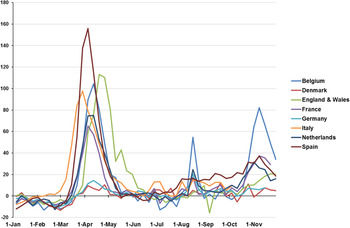
A more important explanation is that international comparisons are hampered by measurement issues. Measurement issues are certainly relevant in comparisons of the number of casualties. Most countries report deaths as COVID-19 related if there has been a positive test. Belgium has also included casualties without a positive COVID-19 test, if COVID-19-related symptoms were listed on the death certificate. The scientists kept claiming that this was the correct way to do, and despite some political pressure (politicians did not like Belgium's position in the mortality rankings), they refused to change their way of counting. An analysis afterwards showed that the registered COVID-19 deaths indeed explained 96% of the excess mortality that was observed during the first wave (Bustos Sierra et al., Reference Bustos Sierra, Bossuyt, Braeye, Leroy, Moyersoen, Peeters, Scohy, Van der Heyden, Van Oyen and Renard2020). The diverging way of counting in Belgium has huge implications for the evaluation of the situation in the nursing homes: whereas in hospitals all deaths are tested, this is not the case in nursing homes and in Belgium all ‘suspected’ deaths were recorded in the statistics. After correcting for these differences in counting, Belgium would probably no longer be an outlier in mortality tables. Figure 3 shows the number of confirmed COVID-19 deaths, with Belgium clearly leading the charts in terms of mortality. Figure 4 however shows the excess mortality in Belgium: the number of deaths from all causes per week in 2020, as compared to the average number of total deaths in the same week in the previous five years before COVID-19. This shows a somewhat different picture. In the first wave, Belgium performs similarly to England and Wales or Italy, slightly worse than the Netherlands and better than Spain. This illustrates the measurement and coding differences between the Belgian COVID-19 mortality statistics and those of other countries. Many of the deaths that were labelled COVID-19 deaths in Belgium (and that caused the spikes in Figure 3) occurred in other countries as well but were not labelled as such. However, the figure also shows that the second wave was more severe in Belgium than in other countries. There was also a spike in excess mortality in August, but that is also partly due to the exceptional heat wave that occurred at that time.
Excess mortality during COVID-19: deaths from all causes compared to previous years, all ages. Excess mortality is expressed as the percentage difference between the number of total deaths per week in 2020 and the average number of deaths in that same week in the previous five years (2015–2019).
Source: Data obtained from Our World in Data and the Human Mortality Database.

Overall, even after these corrections, the death toll in Belgium remains high compared to similar countries (e.g. Germany or Denmark) (Bustos Sierra et al., Reference Bustos Sierra, Bossuyt, Braeye, Leroy, Moyersoen, Peeters, Scohy, Van der Heyden, Van Oyen and Renard2020, and for socio-economic inequalities, Decoster et al., Reference Decoster, Minten and Spinnewijn2020). This poor performance is probably not due to a malfunctioning hospital sector, although there were large differences in the outcomes of different hospitals (Silvio Taccone et al., Reference Silvio Taccone, Van Goethem, De Pauw, Wittebvole, Blot, Van Oyen, Lernout, Montourcy, Meyfroidt and Van Beckhoven2021). Many people's care appointments were indeed postponed or even cancelled by providers, and there are concerns that large groups of patients postponed essential medical care because of fear of corona, or because of a wish not to burden the health system any further (Bertier et al., Reference Bertier, Luyten and Tubeuf2021; RIZIV, 2021). At this stage, the long-run health effects of this postponement are not yet clear but medical specialists fear a future spike in avoidable mortality (e.g. via undetected cancers). However, the collapse of the health system has certainly been avoided. ICUs were never fully occupied, although some transports have been needed. This good result can partly be explained by the fact that, already before the outbreak of the pandemic, Belgium had a larger number of ICU beds (per capita) than, e.g. Italy or the Netherlands (see, e.g., the comparative analysis in Rhodes et al., Reference Rhodes, Ferdinande, Flaatten, Guidet, Metnitz and Moreno2012). As a matter of fact, a reasonable hypothesis is that the large number of patients in Belgian intensive wards has been codetermined by this large capacity, in that the selection of patients to be admitted in ICU is less severe than in other countries. This is another illustration of the fact that international comparisons may be tricky.
However, the situation in the nursing homes is less positive and in the first wave it was really dramatic. As the result of policies that support informal care in order to keep the elderly as long as possible in their own homes, Belgian nursing homes have a very frail population. The average age is 83 and the mean length of stay (until death) is less than three years (Socialistische Mutualiteiten, 2020). Moreover, the nursing staff is less well trained than the one in the hospitals and the shortage of protective material was very outspoken in the first wave, since nursing homes were not seen as a priority sector. In the first stage of the epidemic, the policy reactions with respect to the nursing homes were much slower than those with respect to the hospitals. This was definitely a policy mistake. After a while, the situation improved and (at least in some regions) there was more collaboration with the hospitals. During the second wave (at least until now), the situation in the nursing homes is better under control. Yet, the need of a better organization of the care homes and of a better coordination between care and health care is one of the main lessons of this crisis. It remains to be seen whether the realization that the care sector is severely underfinanced, will remain after the pandemic is over.
A second explanation why Belgium was hit so hard is that it had an exceptionally high second wave of the pandemic. There are many possible reasons for this (some of which will be further discussed in the next section). A central question is how effective central command was in enforcing the necessary containment measures in time.
4. The changing relationship between politicians and scientists
In broad lines, it makes sense to distinguish three stages in the interaction between policy makers and medical experts. In the first wave, the latter awakened a weak, minority government and communicated directly with the citizens. In the relaxation period, the government went faster than the advice of the medical experts and at some point the relations became tense, with the experts declining all responsibility for the policies. From October onwards (in the second wave) a new, representative government was formed and virologists and epidemiologists started playing again an essential advisory role, but this time more behind the scenes.
4.1 First wave: the scientists awaken
In the first wave, the lockdown measures followed closely (albeit not perfectly) the advice of the epidemiologists and virologists. The developments were closely monitored with daily briefings by the scientists about the severity of the situation, and the scientists referring to epidemiological models. Overall, the response of Belgian policy makers was rational and not panicked. Of course, with hindsight, in the beginning the severity of the pandemic has been underestimated, but given the information available at that time decisions were rational (we believe) and measures were introduced rather quickly. They were gradually strengthened, with the deliberate purpose to reach an equilibrium between medical needs, economic costs and public support for the measures.
It is striking that these strict lockdown measures were introduced by a provisional government. Indeed, somewhat paradoxically, the relative weakness of the government may explain to some extent the important role played by virologists and epidemiologists. Scientific insights created the social consensus that was needed to introduce restrictive measures. On the other hand, while the hospital sector is a competence of the federal government, the nursing homes are a competence of the regional governments, and these regional governments were indeed in place. It seems that the slow policy reaction in the nursing homes is at least partly due to the lack of coordination between the regions and between the regions and the federal government.
The strong influence of the ‘scientists’ had very good effects at this stage, but at the same time may also have been a danger, in that the political opposition (more or less silenced in the political game because of the special powers) got an incentive to attack scientists who looked like policy makers, although they did not take the final decisions.
This raises interesting questions about the position of scientists in policy debates. Of course, scientific knowledge is not 100% certain, and even less so with a new disease as COVID-19. Policy advice is always partly based on intelligent judgment, rather than hard facts only – and judgment is likely to be more intelligent when backed by scientific knowledge. For the general population, however, this is not easy to understand, and it gets even more difficult if scientists are strongly involved in policy communication.
4.2 Exit and relaxation measures in September: the lobbies strike back
Almost all specialists warned that lockdown is easy, but exit from lockdown is difficult. Economic and other interests play a more important role, political differences are more outspoken, feelings among the population are stronger and there is less compelling scientific guidance with regards to which measures to relax first. It is almost unavoidable that some policy choices are perceived by a part of the population as arbitrary or biased in favour of lobby groups. The pressure on government is then growing rapidly and one can hypothesize that a weaker and more divided government will give in more quickly and will be more inclined to please public sentiments. This is exactly what we observed in Belgium: the exit went fast, with public life re-opening sooner and the allowed numbers of contacts higher than what the medical experts considered appropriate. The weakness of the minority government and the complicated structure of the Belgian political system, with its various regional layers and diffused responsibilities, increased the difficulty of taking effective decisions and communicating them in a transparent way.
From an epidemiological perspective, things went really wrong in September. As described previously, epidemiologists warned explicitly that the epidemic was gaining force and that more restrictive measures were needed. The government did exactly the opposite and relaxed some essential rules, e.g. the one on the number of personal contacts. In a first stage, even the cries of distress given by health care workers, both in the hospitals and in the ambulatory sector, were largely neglected. The collaboration between politicians on the one hand and the medical experts on the other became very difficult. At some point, the latter, who had played an exceptionally big role in communicating policy measures to the public, even refused to appear in the media because they did not want to be associated with the policy.
The relaxation of the restrictions by the government reflected the craving in society to return to a ‘normal’ life but it neglected basic insights about a pandemic. First, with a highly infectious virus, an exponential spread can seem rather slow in the beginning but then starts going extremely rapidly. Moreover, the number of hospitalized patients, the number of patients in ICU, and the number of deceased start increasing later (and in that order) than the number of infections. It was a common mistake in the debate to point out that the increase in infections was not that worrying, because the testing strategy had changed and, apparently, the number of sick people did not (yet) grow. Second, the economic and psychic costs of the lockdown were exaggerated. Many observers calculated these costs by comparing the situation under lockdown with the ‘business as usual’ without a pandemic. This is a basic mistake: the relevant comparison is between the present situation (a controlled pandemic) and the counterfactual situation of a much stronger pandemic but without restrictive measures. Among economists there is by now nearly consensus that the main cost follows from the pandemic itself, not from the lockdown or other countermeasures (see, e.g., Chetty et al., Reference Chetty, Friedman, Hendren, Stepner and Opportunity Insights Team2020; Goolsbee and Syverson, Reference Goolsbee and Syverson2020). Costs originate rather from the impact that a full-blown pandemic has on the demand side (people being less willing to consume) and the supply side (workers becoming sick) rather than that money is ‘lost’ through the restrictions imposed on economic life (closed shops, bars, etc). And the same can certainly be hypothesized for psychic well-being: would those people who are suffering psychologically from the lockdown be that much happier in a situation where they have to live with a justified fear of being infected themselves? In a situation in which everybody would know infected, sick and deceased people amongst their family and friends? In which patients need to be treated in tents because the ICU is fully occupied?
There was still another, practical, factor explaining the delay in the policy reaction. The agreed term for the minority government came to an end in September and politicians, including members of the government, were either reluctant to take drastic decisions in their final days in power or were actively involved in the attempts to find a majority that could form a new ‘real’ government. These negotiations diverted some attention from the pandemic.
4.3 Second wave: return of the scientists
The new federal government, that took office on 1 October, almost immediately took a different tack. Indeed, the reality of the pandemic basically imposed the reintroduction of restrictive measures, since it was clear that the infection rate was soaring exponentially and that the pressure on intensive care was growing. In addition, the new government stated explicitly that it wanted to respect more carefully the advice of the epidemiologists and virologists. Again, a balance was sought between different social objectives: keep the pandemic (and the pressure on the health care sector) under control, keep the economy working, and keep the schools open. Policy choices involve difficult trade-offs but in formulating the policies the scientists were heard again. However, this time, it were mainly the politicians themselves who justify and defend the choices made towards the public. This does not mean that the political process ran perfectly smoothly since October 2020. The coordination between the federal government and the regional governments kept creating tensions and, partly as a result, the communication about the measures was imperfect.
5. Conclusion
At the level of health policy, Belgium has been facing the same problems as most other countries during the COVID-19 crisis. The raw data suggest that Belgium has had to bear an exceptional infection and mortality toll compared to its neighbours, but this is partly a measurement issue: there were large numbers of tests taken, deaths were counted differently, and perhaps patients were admitted to ICU faster in Belgium because of a larger availability of ICU beds. Expressed in excess mortality, Belgium is less of an outlier in Europe, although it was without doubt hit hard, particularly during the second wave. Whereas some causes for this high disease burden, such as population density, are beyond the reach of policy makers, others are not. This is most clear for the experience in the nursing homes during the first wave and for the initial policy reaction on the second wave. Although the signs were there for those who wanted to see, policy makers failed to act adequately. This was partly due to the complex political situation in Belgium without a strong centralized command. Caution is needed, however: at this stage our understanding of what has happened is not yet deep enough to allow strong conclusions.