

The social and political salience of American Muslims has markedly increased since the September 11th attacks, periodically spiking during recent election cycles (Lajevardi Reference Lajevardi2016). Scholarship on this population, though still relatively sparse, has similarly witnessed an uptick. Research on the general public during this span has elaborated both policy preference and affect toward American Muslims (Davis and Silver Reference Davis and Silver2004; Huddy et al. Reference Huddy, Feldman, Taber and Lahav2005; Davis Reference Davis2007; Kalkan, Layman, and Uslaner Reference Kalkan, Layman and Uslaner2009; Sides and Gross Reference Sides and Gross2013). Relatedly, a smaller set of empirical studies have examined the attitudes and behaviors of American Muslims themselves, highlighting the dynamics of alienation and political incorporation within this community (Jamal Reference Jamal2005; Ayers and Hofstetter Reference Ayers and Hofstetter2008; Patterson, Gasim, and Choi Reference Patterson, Gasim and Choi2011; Oskooii Reference Oskooii2015; Read Reference Read2015). Our project is situated in this latter, still nascent branch of the literature.
Expanding our knowledge of American Muslim attitudes and behaviors is crucial at a time when individuals and organizations are, on the one hand, seeking to amplify the community's collective voice while, on the other hand, rejecting the view of Muslims as a monolithic faith group. In the months following the election of President Donald Trump, record numbers of Muslim candidates have run for local, state, and national public office (Raphelson Reference Raphelson2018). This trend coincides with efforts by groups such as MPower Change and EmgageUSA to register Muslims to vote and encourage their engagement on a broad set of political issues.
Such activity is, of course, in part a by-product of heightened animus from numerous public officials. The rise of rhetoric that questions American Muslims’ commitment to democratic norms—or that explicitly paints them as a collective threat—is well documented since the start of the 2016 presidential campaign (Johnson and Hauslohner Reference Johnson and Hauslohner2017), though it certainly has a longer lineage (SAALT 2014; Coen Reference Coen2017). While such negative depictions necessarily disregard the heterogeneity that exists among American Muslims, it is not uncommon for neutral or even positive commentary to similarly discount this population's diversity. For example, the observation that Republicans had at one time won the “Muslim vote” (Graham Reference Graham2015) belies the experience of African Americans, who constitute a significant portion of the American Muslim population. Indeed, a lament in a 2006 Wilson Center report (Read Reference Read2006, 80) still rings true today:
[O]ur awareness and understanding of the dynamics that contribute to American Muslim political participation remains limited, as does our ability to identify factors that may lead to future differences in their political ideologies and behaviors. A primary reason for the ambiguity surrounding Muslim American political integration is the continued misconception that this is a homogeneous population.
In light of these realities and challenges, we argue in this article that those seeking to better understand the American Muslim experience should do so through the dual lenses of diversity and cohesion. On the one hand, the statistically “typical” American Muslim may not meaningfully represent this population. Muslims are more diverse than any other religious group in the US, with salient linguistic, cultural, and racial differences. Similarly, American Muslims do not subscribe to a singular understanding of Islam; their beliefs and practices fall along a broad spectrum. On the other hand, the intense otherization and discrimination targeting those who even appear to be Muslim has created a sense of group commonality and shared experience across the demographic and theological divides within this community. To be sure, such tensions are not unique to American Muslims. Indeed, scholars of Asian American (Wong et al. Reference Wong, Ramakrishnan, Lee and Junn2011) and Latino/Hispanic political behavior (Arvizu and Garcia Reference Arvizu and Garcia1996) have similarly advocated for more balanced analytical approaches when studying coherent, yet heterogeneous populations of interest.
To paint a fuller picture of American Muslim integration, we utilize survey data that are both particularly well suited to testing core theories of political participation and amenable to subgroup analysis. The Muslim American Public Opinion Survey (MAPOS) dataset not only includes questions on numerous modes of participation (beyond just voting) alongside measures of theoretically relevant determinants, but also features a large-n national sample of this low-incidence population.Footnote 1 The size and scope of this survey thus allows us to disaggregate the data and expose the moderating effect of religious denomination, race/ethnicity, and sex.
The following analysis thus offers two main contributions. First, it complements previous efforts to discern whether theoretical expectations on the determinants of political participation hold when filtered through the experiences and contexts attendant to various minority groups (Leighley and Vedlitz Reference Leighley and Vedlitz1999; Barreto Reference Barreto2010; Wong et al. Reference Wong, Ramakrishnan, Lee and Junn2011). Extending this line of inquiry to an American Muslim sample expands the universe of cases testing key hypotheses on the role of socio-economic resources, religious engagement, immigrant socialization, group consciousness, and political interest in motivating political participation.
Second, in addition to building on the relative dearth of research American Muslims, this study highlights the disparate ways in which key determinants influence political behavior within this community's subgroups. Whether due to the difficulty in obtaining a sizeable sample from this relatively small population (Patterson, Gasim, and Choi Reference Patterson, Gasim and Choi2011; Djupe and Calfano Reference Djupe and Calfano2012),Footnote 2 or simply an implicit decision to limit the analysis to inferences about the sample as a whole (Ayers and Hofstetter Reference Ayers and Hofstetter2008; Jalalzai Reference Jalalzai2009), studies of American Muslim political attitudes and behavior conditioned on key demographic distinctions is, not surprisingly, quite rare (see below for exceptions to this general rule). Altogether absent, however, is a comprehensive assessment of the differential effects attendant to these distinctions. Thus, the findings presented below constitute the first attempt to conjointly compare the ways in which denomination, racial or ethnic background, nativity, and sex influence the determinants of American Muslim political participation. Our results suggest a stratified theoretical and modeling approach is justified given the different patterns of political participation that emerge both within and across key sub-groups.
MODELS OF POLITICAL PARTICIPATION
The five models tested in this study are derived from examinations of both the broader American public and various minority groups. This section sketches these models’ theoretical underpinnings and empirical expectations, with the caveat that the terms and descriptions we use draw on multiple scholarly contributions, and thus may vary from those employed by any one particular author referencing a specific theory.
Socio-Economic Status
One of the strongest and most reliable predictors of political participation is socio-economic status (SES). Early seminal works in the discipline illustrated the general tendency that those with higher SES (most often measured in terms of education and income) are more likely to engage in political activity (Campbell et al. Reference Campbell, Converse, Miller and Stokes1960; Lipset Reference Lipset1960). Later contributions further reinforced this relationship, highlighting, for instance, the comparatively greater propensity of high SES individuals to adopt psychological orientations associated with increased levels of participation (Verba and Nie Reference Verba and Nie1972), and accrue benefits from experientially and informationally rich settings (Nie, Junn, and Stehlik-Barry Reference Nie, Junn and Stehlik-Barry1995; Gimpel, Lay, and Schuknecht Reference Gimpel, Lay and Schuknecht2003).
Yet, despite these consistent findings in the general public, studies on minority political participation have yielded somewhat mixed results on the role of SES. For example, although analyses of African American participation typically evidence the expected positive correlation with SES, generally (Wolfinger and Rosenstone Reference Wolfinger and Rosenstone1980; Verba et al. Reference Verba, Schlozman, Brady and Nie1993; Leighley and Vedlitz Reference Leighley and Vedlitz1999; Logan, Darrah, and Oh Reference Logan, Darrah and Oh2012), a number of studies nonetheless report inconsistent findings with regard to the individual effects of education and income (Dawson, Brown, and Allen Reference Dawson, Brown and Allen1990; Tate Reference Tate1991). In partial contrast, scholars have typically found consistent evidence that SES indicators account for much of the variance in Latino American participation patterns, in general, and those of Mexican Americans, in particular (Lien Reference Lien1994; Citrin and Highton Reference Citrin and Highton2002; Barreto and Segura Reference Barreto and Segura2014). The converse is true for Asian Americans, who despite having the highest income and educational attainment of any racial group in the United States (Pew Research Center 2012) are consistently found to be less politically active than the general public, with numerous studies reporting a negative relationship between SES and political activity within this population (Lien Reference Lien1997; Wong et al. Reference Wong, Ramakrishnan, Lee and Junn2011).
Religious Engagement and Influence
Although SES may very well be the most predictive indicator of political participation, the role of associational life, particularly in terms of religious institutions, arguably has a much more storied lineage in studies of American political behavior (going back at least to Tocqueville (Reference Tocqueville1835)). One of the more seminal contributions in this regard is that of Verba, Schlozman, and Brady (Reference Verba, Schlozman and Brady1995), who find that churchgoers are more likely to participate in various political activities. In terms of mechanisms, these authors posit that it is the skills and knowledge obtained through engagement in religious institutions (and other associations) that facilitate activity in the political sphere: “The acquisition of such civic skills is not a function of SES but depends on the frequency of church attendance and denomination of the church one attends” (Verba, Schlozman, and Brady Reference Verba, Schlozman and Brady1995, 82). This wider analytical scope, which accounts for resources not exclusively linked to SES, has been leveraged to explain why African Americans outperform their predicted level of political activity based on economic and educational indicators alone (Tate Reference Tate1991; Harris Reference Harris1994; Calhoun-Brown Reference Calhoun-Brown1996). Church attendance has also been found to be an impactful variable for Latino Americans (Jones-Correa and Leal Reference Jones-Correa and Leal2001) and Asian Americans (Lien, Conway, and Wong Reference Lien, Conway and Wong2004).
Immigrant Socialization
Given that a majority of Muslims in America are foreign born (Pew Research Center 2011a), circumstances associated with the immigrant experience will likely influence this population's participatory behavior. More specifically, the skills and habits attendant to socialization in American political life (which are linked to high participation rates) may not be as fully developed in those individuals that have only recently settled in the United States. Thus, we include in the analysis factors such as nativity and English-language skills, which previous studies on immigrant populations have shown to be quite predictive of political behavior (Lien Reference Lien1994; Ramakrishnan Reference Ramakrishnan2006; Sanchez Reference Sanchez2006).
Group Consciousness
An all but requisite variable in studies of minority political attitudes and behavior, measures of collective identity are frequently marshaled to explain an individual's propensity to participate in various civic activities. This connectedness to a broader community, alternately referred to as group consciousness (Verba and Nie Reference Verba and Nie1972; Miller et al. Reference Miller, Gurin, Gurin and Malanchuk1981; Bobo and Gilliam Reference Bobo and Gilliam1990) or “linked-fate” (Dawson Reference Dawson1994), is most often associated with African American political identity and participation (Gay and Tate Reference Gay and Tate1998; Chong and Rogers Reference Chong and Rogers2005; Austin, Middleton, and Yon Reference Austin, Middleton and Yon2012). Although scholars caution against merely assuming this mechanism is operative in non-Black minority groups (Junn and Masuoka Reference Junn and Masuoka2008), numerous studies have nonetheless sought to extend this framework to Asian and Latino American political behavior, with mixed results (Leighley and Vedlitz Reference Leighley and Vedlitz1999; Stokes Reference Stokes2003; Sanchez and Masuoka Reference Sanchez and Masuoka2010; Wong et al. Reference Wong, Ramakrishnan, Lee and Junn2011).
Political Interest and Partisanship
Our final set of hypotheses examines the impact of political interest. Chief among the relevant determinants is partisanship—perhaps the most predictive variable in any domain of public opinion or electoral behavior (Campbell et al. Reference Campbell, Converse, Miller and Stokes1960; Verba and Nie Reference Verba and Nie1972; Kinder and Sears Reference Kinder, Sears, Daniel and Lindzey1985; Green, Palmquist, and Schickler Reference Green, Palmquist and Schickler2002). The significance of partisan attachment is borne out of multiple studies showing that “strong partisans are more likely to exhibit the characteristics of the ‘good citizen’ (e.g., attention to public affairs, well-formed policy attitudes, active political participation, and voter turnout) than are self-professed independents” (Jacoby Reference Jacoby and Leighley2010, 264). The findings gleaned from studies of minority groups largely confirm this relationship, with those specific to Asian American demonstrating the greatest instability (Tate Reference Tate1991; Junn Reference Junn1999; Leighley and Vedlitz Reference Leighley and Vedlitz1999). Alongside these inferential findings, however, it is important to note the descriptive reality of low partisanship among these populations and the consequent toll this lack of party identification takes on political participation (Hajnal and Lee Reference Hajnal and Lee2011; Wong et al. Reference Wong, Ramakrishnan, Lee and Junn2011).
AMERICAN MUSLIM POLITICAL PARTICIPATION
There are a limited number of studies that provide some baseline expectations for how the participation models outlined above should perform on a sample of American Muslims. Socioeconomic indicators appear to largely function as predicted, with education attainment being a particularly strong determinant of participation while the influence of income level is more inconsistent (Jamal Reference Jamal2005; Ayers and Hofstetter Reference Ayers and Hofstetter2008; Schoettmer Reference Schoettmer2015). Not surprisingly, various measures of religiosity are present in all studies of American Muslim political attitudes and behavior, however the findings paint a mixed picture with mosque involvement continually found to have a strong positive effect on participation (Jamal Reference Jamal2005; Dana, Barreto, and Oskooii Reference Dana, Barreto and Oskooii2011; Schoettmer Reference Schoettmer2015), while the influence of religion on one's life exhibits a strong effect in the opposite direction (Schoettmer Reference Schoettmer2015).
With one exception (Jamal Reference Jamal2005), the influence of nativity among Muslims in America is largely in line with studies of other largely immigrant communities (Ayers and Hofstetter Reference Ayers and Hofstetter2008; Oskooii Reference Oskooii2015; Schoettmer Reference Schoettmer2015). Although some work has been conducted on the determinants of American Muslim group consciousness (Barreto, Masuoka, and Sanchez Reference Barreto, Masuoka and Sanchez2008), no study considering linked fate or commonality as an independent variable has been conducted to date. Finally, when political interest and partisanship have been included in models of American Muslim political participation, each of these variable exhibits a statistically and substantively significant effect (Ayers and Hofstetter Reference Ayers and Hofstetter2008; Oskooii Reference Oskooii2015).
The remainder of this section provides the intuition for our subgroup analysis, highlighting relevant findings from studies of political participation among the general public, as well as the limited body of quantitative research on the effects specific to American Muslim denomination, race/ethnicity, and sex.
Denomination
Scholars have long noted the secular consequences of distinct theological beliefs and practices among Christianity's two main denominations. Seminal works have argued for the contrasting orientations of Protestants and Catholics toward trade and investment (Weber Reference Weber1930), and (perhaps relatedly) preference for democracy (Lipset Reference Lipset1960). More recent empirical analyses confirm the impact of denominational affiliation on political behavior. Most notably, Verba et al. (Reference Verba, Schlozman, Brady and Nie1993, 481) find that, due to a number of institutional differences that influence the level of lay participation in church activities, Protestants are nearly three times more likely than Catholics to acquire the civic skills that buoy political participation. The authors leverage this result to explain the differences observed in the historically important role that Protestant churches have played in African American mobilization compared to the comparatively muted influence of Catholic Church has had on Latino political behavior in the USA. Subsequent scholarship has both confirmed (Driskell, Embry, and Lyon Reference Driskell, Embry and Lyon2008) and challenged (Jones-Correa and Leal Reference Jones-Correa and Leal2001) the contention that religious affiliation influences one's likelihood to participate in the public sphere. In contrast to this ongoing debate, however, research on denominational differences among non-Christian adherents is sparse with regard to any public opinion domainFootnote 3 and, to our knowledge, altogether non-existent in the realm of political participation.
Race and Ethnicity
Race and ethnic background are two staple (and stable) predictors of political participation that, in studies of non-White populations, are occasionally analyzed in more granular detail. For example, in studies of both Latino and Asian Americans, scholars have disaggregated these pan-ethnic categories to reveal differences between their constituent subgroups. Stokes (Reference Stokes2003), for example, finds that much of the effect demonstrated by Latino pan-ethnic identity on political participation is driven by Cuban Americans while, relatedly, Sanchez (Reference Sanchez2006) finds that Cubans are far more likely than other Latinos to frequently vote.
Although not a pan-ethnic group in the traditional sense, American Muslims nonetheless lend themselves to a similarly nuanced analysis of the ways in which national origin conditions political participation. Typically, such analyses draw on the inclusion of race and ethnicity dummy variables. Schoettmer (Reference Schoettmer2015), for example, finds that Arabs are more politically engaged than Blacks. The only split-sample analysis of the American Muslim political participation was conducted by Jamal (Reference Jamal2005), who presents evidence that at least two key determinants in general models of political participation—education and religious engagement—are only operative among Arabs with no discernible impact among either Blacks or Asians.
Gender
Scholars have highlighted a sex-participation disparity since the earliest behavioral studies, with women trailing their male counterparts (Campbell et al. Reference Campbell, Converse, Miller and Stokes1960). More recently, however, there has been a marked shift in relative rates of participation, with the gap between men and women actually reversing (Gender Differences in Voter Turnout 2015). As with race and ethnicity, the findings specific to female American Muslims are gleaned almost entirely from the inclusion of a dummy variable. These studies largely report no gender effects in terms of general political participation, with occasional mixed results when examining the determinants of specific participatory acts (Ayers and Hofstetter Reference Ayers and Hofstetter2008; Oskooii Reference Oskooii2015; Schoettmer Reference Schoettmer2015). Although focusing on civic rather than political engagement among Arab American Muslims, Read's (Reference Read2015) split sample analysis similarly reveals little behavioral difference between men and women.
DATA AND OPERATIONALIZATION
The MAPOS Survey
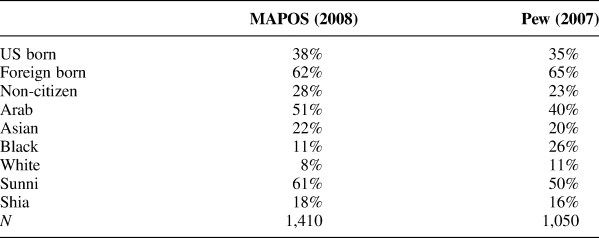
To investigate American Muslim political behavior, we rely on the 2008 MAPOS studyFootnote 4, which is now publicly available.Footnote 5 This dataset is populated with the results of a face-to-face questionnaire administered across 22 locations in 11 cities: Seattle, WA, Dearborn, MI, San Diego, CA, Irvine, CA, Riverside, CA, Los Angeles, CA and Raleigh-Durham, NC, Chicago, IL, Dallas, TX, Houston, TX, Washington, D.C., and Oklahoma City, OK. The sample includes large numbers of Arab, Asian, and African American Muslim respondents, making it quite representative of the overall US Muslim population. In total, 1,410 surveys were completed across all locations, and the sample closely matched that of Pew (2007) along several key metrics.Footnote 6 A demographic comparison of these two surveys, a comprehensive overview of the MAPOS sampling procedure, and the broader theoretical considerations guiding the project's sample collection can be found in Appendix A.
The Dependent Variable
Our dependent variable, political participation, is measured using a tally of several relevant acts that respondents reported taking part in during the previous year. For all individuals in the sample, the following counted toward their total score:
• Attend a community meeting
• Attend a rally or protest
• Write a letter to a public official
• Donate to a political candidate or campaign
This gauge of participation thus ranges in value from 0 to 4 (Figure 1).Footnote 7
Distribution of political participation.

The Independent Variables
We now turn to the variables employed to test the five participation models outlined above. The Socio-economic Status model is examined using two common metrics, Income and Education. Religious Engagement and Influence is operationalized using two scaled measures: Mosque Involvement, ranging along four points from “not at all involved” to “very involved,” and Religious Influence, asking to what extent the respondent's daily life is guided by Quran and Hadith, ranging along four points from “not at all” to “very much.” The Immigrant Socialization model features two dummy variables corresponding to whether a respondent is Native Born and whether they live in a Mostly Non-English Home.
To gauge the impact of Group Consciousness on American Muslim political participation, we turn to two perennial indicators of this construct. The first, Linked Fate, measures along a three-point scale the extent to which respondents believe that what happens to Muslims in America, in general, affect their lives, in particular. The second, Commonality, measures how much respondents believe they have in common with other Muslims in the United States on a four-point scale ranging from “nothing” to “a great deal.” Next, three indicators are used to test the Political Interest model: two of which utilize four-point scales to measure the extent to which respondents follow the news, generally, and the news on the Middle East, in particular (Follow News and Follow ME News, respectively), and one additional dummy variable corresponding to self-reported affiliation with either the Democratic or Republican parties (Partisanship). Finally, a set of demographic variables measuring Age, sex (Female), denomination (Sunni, Shia, Other/Refused), and race/ethnicity (Arab, Asian, Black, Other) round out our specifications. As a matter of course, we also control for citizenship status in each of our models.
RESULTS AND DISCUSSION
Since our dependent variable is a count rather than a scale, we employ Poisson regression instead of ordered logit as our estimation technique (Cameron and Trivedi Reference Cameron and Trivedi2013). To account for overdispersion, we include Supplementary tables as a robustness check in the Supplementary Appendix that estimate our models using negative binomial regression, each of which demonstrates substantively identical results.
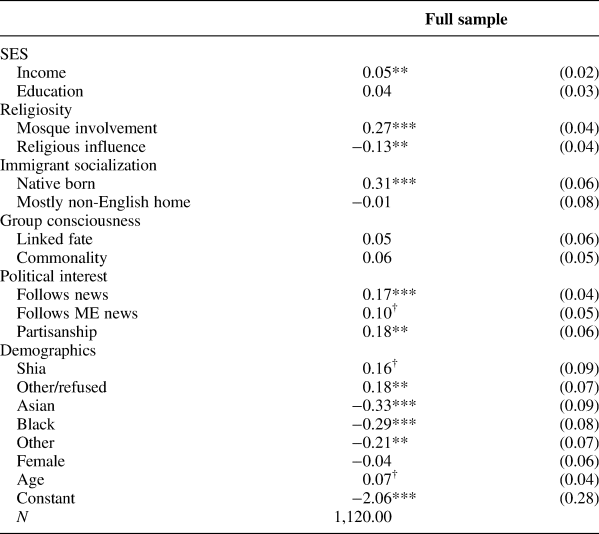
Table 1 presents the effect of key predictors on the full sample's level of political participation. The results offer a mix of expected and exceptional findings. The SES model, for example, demonstrates the positive impact of Income, while Education, typically one of the strongest determinants of political participation, shows no significant influence. Similarly, involvement in one's house of worship exhibits the same strongly positive correlation found in studies of the general public, minority populations, and, specifically, Muslims in America. Conversely, our other measure of religiosity runs counter to general expectations but is actually in line with the results found in prior studies of American Muslim political participation (Ayers and Hofstetter Reference Ayers and Hofstetter2008; Schoettmer Reference Schoettmer2015). This somewhat consistent divergence from a generally stable relationship between religiosity (variably defined) and political engagement is not readily explained through any doctrinal precepts and may be an artifact of one particular segment of the American Muslim community (see Table 3 and discussion below).
Determinants of political participation, full sample

Robust standard errors in parentheses.
†p < 0.101, *p < 0.05, **p < 0.01, ***p < 0.001.
While the results for the Immigrant Socialization and Political Interest models are in lock-step with prior findings, the impact—or, rather, lack thereof—of Group Consciousness is certainly surprising. As a salient minority in a negatively charged socio-political climate, it is a bit perplexing that there would not be a relationship between an enhanced collective identity and increased political participation. One possible explanation could be that the survey was fielded just before the recent upsurge of anti-Muslim sentiment gathered steam with the Park51 controversyFootnote 8 and continued into the 2010 midterm elections (Pew Research Center 2011b).
The full model also demonstrates a number of noteworthy demographic effects. First, Arabs are clearly more politically active than other ethnic groups in the sample. This result is in line with the available (if sparse) analyses on American Muslims. For example, as Jamal (Reference Jamal2005, 524) notes:
Arab Americans have had a stronger tradition of political participation in the United States [than other Muslims]. They have a long history of political activity aimed at both improving their own standing in the United States and influencing US foreign policy in the Middle East.
The absence of any gender effects on American Muslim political activity similarly aligns with results in prior studies. Less expected, however, is the finding that Sunni political activity trails that of Shias and other co-religionists. Some caution is in order here as respondents putting down “Other” or who refused to state their denomination comprise 23% of the MAPOS sample. As such, the denominational effects in our sample are somewhat tempered as, in addition to theological and institutional differences, they partly reflect the attitudinal distinction between those willing and unwilling to report a specific sectarian outlook.
To probe these findings further, we now shift to examining key subgroups within the full sample. The following split sample analyses effectively model the interaction of a binary identifier (in order: denomination, race/ethnicity, nativity, and gender) with each predictor in the full model. This analytical approach is driven by the theoretical expectation that intersecting identities will shift multiple determinants of political participation. Some scholars of race and ethnicity have explicitly employed this methodology based on the same general logic (e.g., Jamal Reference Jamal2005; Chong and Kim Reference Chong and Kim2006), but many others implicitly rely on this technique when drawing inferences from samples composed exclusively of a particular sub-population to determine whether and how they differ from established findings derived from the general public.
Moreover, in their comprehensive assessment of attitudes toward immigration, Masuoka and Junn (Reference Masuoka and Junn2013) vigorously advocate for what they call a “comparative relational” analytical approach when theoretically appropriate. By estimating models for relevant identity groups separately, they argue, a researcher can better represent how lived experiences (particularly those informed by social hierarchies) structure multiple explanatory variables compared to the traditional means of accounting for these identities within a single model and assuming an “equality of individual agency” (32). We concur with these scholars and apply the comparative relational approach to examine the dynamics of political participation among several theoretically relevant identities, supplemented with full sample interaction analyses when comparing directly across these identities.
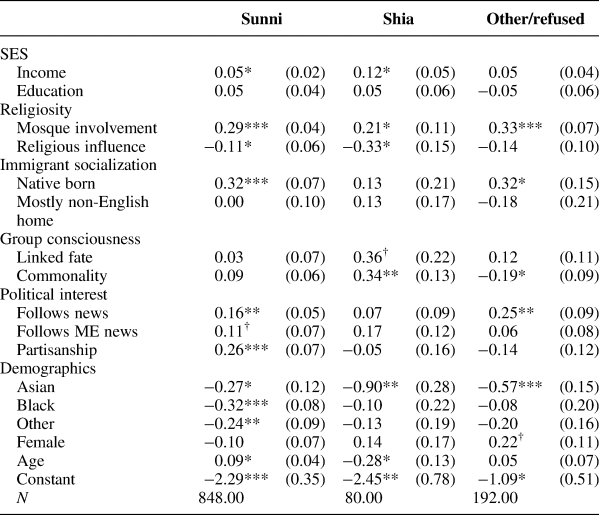
Table 2 reports the meaningful ways in which confessional preference conditions political behavior. Crucially, involvement in mosque activities does not influence Shia political participation despite significantly augmenting the behavior of Sunnis. Indeed, as the interaction plot in Figure 2 demonstrates, the participation gap between Sunnis and Shias disappears at the highest level of mosque involvement.Footnote 9 Possible explanations for these results can be found in Liyakat Nathani Takim's comprehensive work, Shi'ism in America. Takim (Reference Takim2009, 58) reminds us, that many Shia religious institutions remain dominated by a single ethnicity, that they are few in number (even relative to the subgroup's smaller population size), and that, for much of their recent history in America, “Shi'is were excluded from participating in many Sunni institutions” (141). This shortage of effective institutional capacity and lingering intra-religious tension may similarly dampen the expected effect of being native born. As Takim (Reference Takim2009, 123–4) reports:
“Shi'i students complain that they are frequently alienated on university campuses because of their Shi'i affiliations. The meta-minority complex—a minority within a minority—means that Shi'i youth have had to contend not only with being Muslims in America but also with being Shi'is in Sunni organizations.”
Marginal effect of high mosque involvement, by denomination (95% confidence interval (CI)).

Determinants of political participation, by denomination

Robust standard errors in parentheses.
†p < 0.101, *p < 0.05, **p < 0.01, ***p < 0.001.
This alienation is notable in that it is through participation in Muslim Students Associations that many second- and third-generation American Muslim youths first have the opportunity to engage and coordinate with Muslims from different ethnic and theological backgrounds (Chouhoud Reference Chouhoud2011). If it is the case that Shia Muslims do not have equal access to this environment, then that may help explain the disparate findings in our sub-sample analysis.
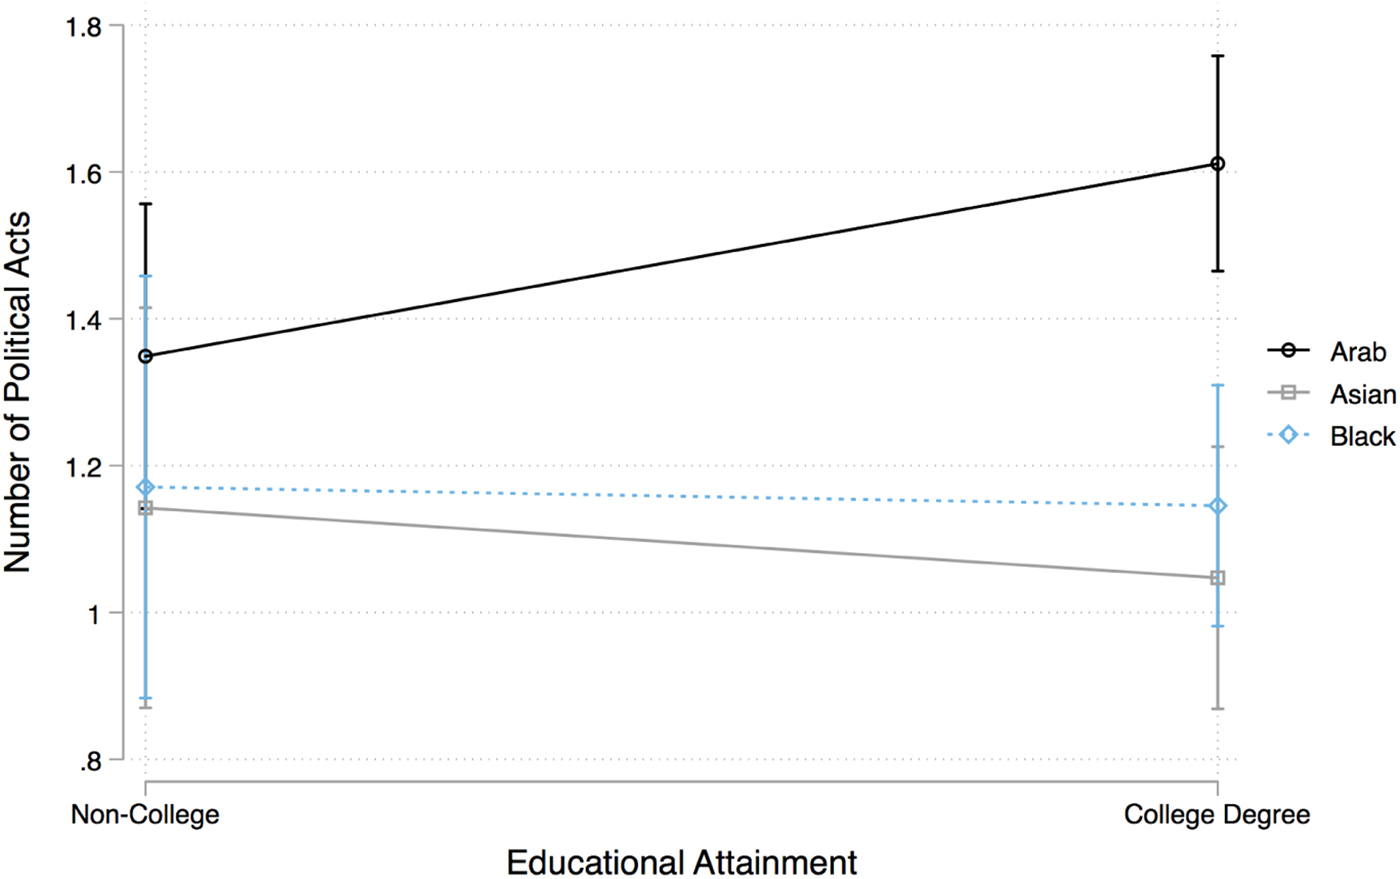
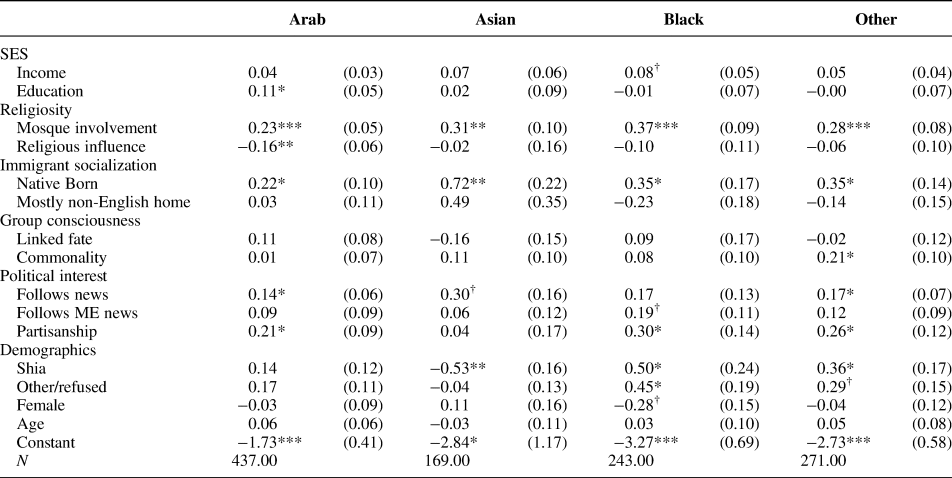
Moving to the effect of race/ethnicity, Table 3 evidences few stark differences on the basis of these identities. Two key exceptions are found among Arab respondents, who are the sole group for which higher levels of education and lower levels of doctrinal religiosity significantly correlate with increased participatory behavior. Figure 3 shows how college education sets Arab Muslims apart from their co-religionists whereas Figure 4 demonstrates the significant participation gap that exists between Arab and non-Arab Muslims at lower levels of religiosity.Footnote 10 These two determinants may, indeed, be linked.
Marginal effect of college education, by race/ethnicity (95% CI).

Marginal effect of religiosity, by race/ethnicity (95% CI).

Determinants of political participation, by race/ethnicity

Robust standard errors in parentheses.
†p < 0.101, *p < 0.05, **p < 0.01, ***p < 0.001.
Arab American political activism has both launched and reinforced several umbrella advocacy groups, such as the American-Arab Anti-Discrimination Committee (ADC) and the Arab American Institute (AAI), and high-profile student organizations, most notably the over 80 branches of Students for Justice in Palestine (SJP) across American college campuses. This latter set of organizations highlights one meaningful way in which the higher educational experience of Arab Muslims can differ from their co-religionists and possibly serve to enhance their levels of overall political participation. Whereas the goal of campus Muslim Students Associations is, broadly speaking, more intramural in scope (e.g., facilitating the religious needs of its members), SJP and similar groups are explicitly rooted in external engagement and activism.
Along these same lines, the finding that less doctrinally religious Arabs are more politically engaged than other Muslims of similar religiosity can also be traced to circumstances particular to the Arab American experience. Specifically, contrary to their public perception, a clear majority of Arabs in the United States are Christian (Arab American Institute 2002). Thus, the issues that animate Arab American politics (whether they be domestic or international) often pull together a religiously diverse constituency and provide ample space for less religiously-inclined Muslims to participate. Moreover, the inter-religious bonds that form as a result of these cross-cutting interests are precisely the type of bridging social capital that Putnam (Reference Putnam2001) underscores as a key driver of democratic engagement.
Any analysis of the role that ethnicity plays in conditioning American Muslim attitudes and behavior would be incomplete, however, without considering the influence of immigration. A recent national poll, for example, found that only half of all Muslims were born in the United States, a tally far below the general public and other major faith groups (Mogahed and Chouhoud Reference Mogahed and Chouhoud2017). The Arab population in America is likewise largely comprised of recent immigrants. In the year 2000, 46% of Arabs in America reported having entered the country in the previous decade, a proportion in line with Hispanic and Asian Americans (Holsinger Reference Holsinger2009). Moreover, the 2011 American Community Survey reported a 47% increase in the Arab population in America over the prior decade (Brown, Guskin, and Mitchell Reference Brown, Guskin and Mitchell2012).
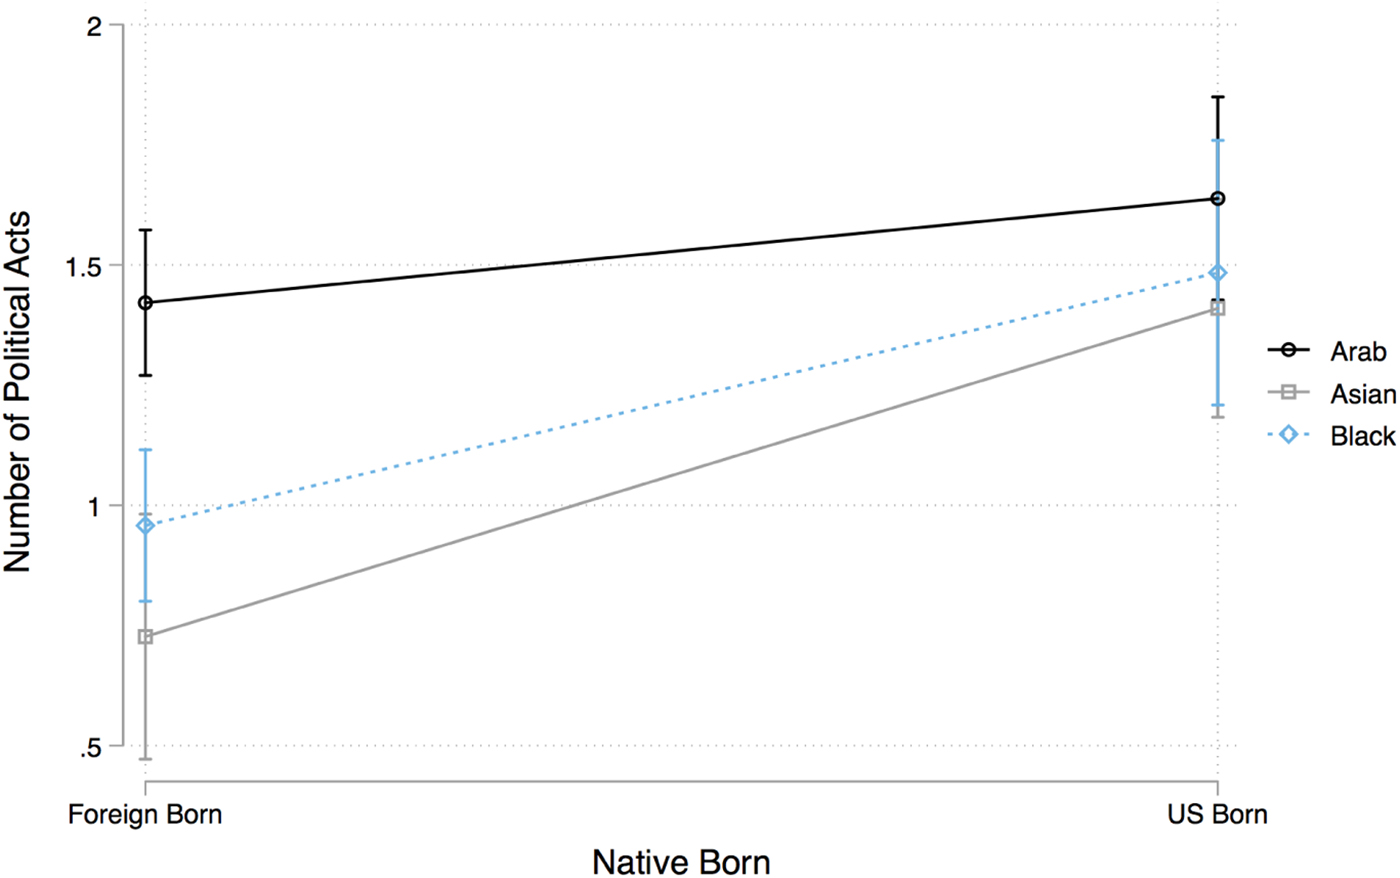
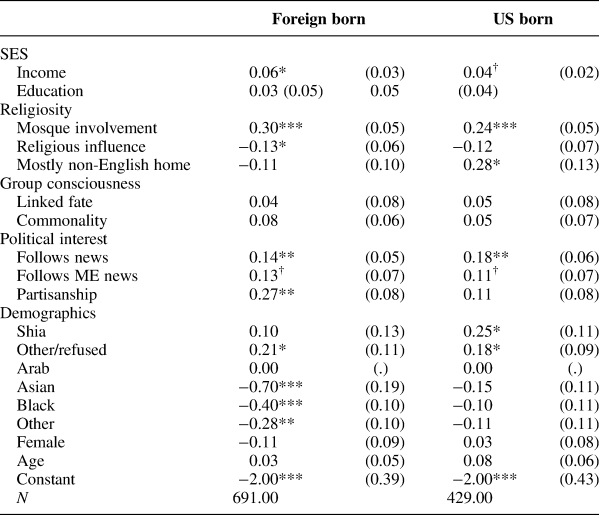
This demographic reality suggests that the wide gap between Arab and non-Arab political participation may be in part a function of nativity. The results in Table 4, which divides the sample into Foreign born and US born respondents, strongly support this hypothesis. Whereas foreign-born non-Arabs are significantly less likely to participate at the same rate as their Arab counterparts, US-born respondents’ level of participation is statistically indistinguishable across racial and ethnic backgrounds. Figure 5, which interacts race/ethnicity and nativity, further underscores this point, showing that the participation gap between foreign-born Arab and non-Arab Muslims is absent among US-born respondents.Footnote 11
Marginal effect of nativity, by race/ethnicity (95% CI).

Determinants of political participation, by nativity

Robust standard errors in parentheses.
†p < 0.101, *p < 0.05, **p < 0.01, ***p < 0.001.
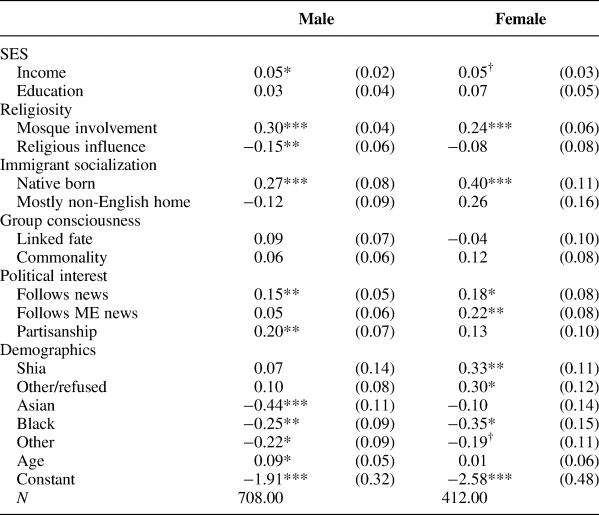
Last, Table 5 exhibits little distinction between the determinants of political participation driving American Muslim men and women. The sole reversal in sign is found in the impact of respondents’ primary language at home. The negative coefficient for men suggests that males who live in a largely immigrant household are less likely to engage politically whereas the opposite is true for females.Footnote 12 The underlying reason(s) for this divergence, given the dearth of insights available from existing studies, offers researchers a meaningful puzzle worthy of deeper exploration. Overall, however, our findings are in line with other studies that conclude little difference between the drivers of male and female American Muslim political participation. Whereas gender parity may be elusive in Muslim-majority states (Donno and Russett Reference Donno and Russett2004; Jamal and Langohr Reference Jamal and Langohr2009; Fish Reference Fish2011), it seems to be more attainable (at least in the domain of political resources) for Muslims in America.
Determinants of political participation, by sex

Robust standard errors in parentheses.
†p < 0.101, *p < 0.05, **p < 0.01, ***p < 0.001.
CONCLUSION
This study analyzed the drivers of American Muslim political participation with a depth atypical to this population. Utilizing data from the MAPOS project, we tested a number of models that scholars have shown to be quite predictive of the general public's political behavior while exhibiting, at times, mixed findings among minority populations. Systematically applying these models for the first time to a sample of American Muslims revealed a number of different pathways to political participation for various subgroups within the community. Those looking to mobilize Shia Muslims in the United States, for example, would likely be best served canvassing non-religious institutions. Along these same lines, those targeting college campuses for engagement will probably find a larger portion of politically active Arab Muslims relative to other races/ethnicities, and the same goes for venues frequented by first-generation immigrants. And while the resources motivating Muslim women's participation are largely in lock-step with those of Muslim men, certain experiences (such as coming from a largely immigrant household) appear to differentially influence political behavior, and possibly the receptivity of political messaging.
As Muslims in America seek to deepen their societal impact and build political coalitions, our research indicates that within-group diversity should be just as centered as communal cohesion. For example, even though American Muslims may be more likely than other religious groups to support Black Lives Matter (Mogahed and Chouhoud Reference Mogahed and Chouhoud2017), the full suite of liberal policy positions may not appeal to all segments of this population. Indeed, Muslims in the USA remain one of the country's more religiously practicing communities (a pattern evident even among the population's younger cohorts (Mogahed and Chouhoud Reference Mogahed and Chouhoud2017)) and a substantial portion remain socially conservative. Thus, a potential tension exists between American Muslims’ identity as a minority group in America, a standing which lends itself to allying with progressive causes, and as a religious community whose beliefs and priorities may not fully align with left-of-center (let alone far-left) agendas.
Returning to a broad perspective, the results highlighted that the determinants of participatory behavior diverge from theoretical expectations with regard to certain variables, most notably those indicating group consciousness. Yet, it could be that mosque attendance is absorbing some of the effect of linked fate and its corollaries. To this end, it is worth underscoring that the most robust finding across all the tests conducted was the positive influence of mosque involvement—a finding in line with previous research (Jamal Reference Jamal2005; Dana, Barreto, and Oskooii Reference Dana, Barreto and Oskooii2011), and one that undermines a core contention of anti-Muslim rhetoric that links religiosity to alienation. To the contrary, across nearly all segments of the Muslim population in the United States, greater mosque involvement predicts greater political engagement.
We encourage future research to continue to untangle the differences and similarities within sub-groups of the American Muslim community. While this population is often “otherized” as a single homogeneous group, the reality is that, just like other composite communities in America, they exhibit myriad demographic distinctions that can help refine social scientific theory and guide practical politics.
SUPPLEMENTARY MATERIAL
The supplementary material for this article can be found at https://doi.org/10.1017/S1755048318000858.
Appendix A The MAPOS Survey
Muslims are a religious group by definition. Distinct from Hispanics, who are considered an ethnic group, or African Americans who are a racial group, American Muslims are most commonly described as a religious group, and thus we can expect to encounter them in religious settings. Similar to American Jews, Muslims also express a wide spectrum in the observance of their religion from orthodox and especially devout, to those who are entirely secular but still consider themselves Muslim (or Jewish). At the point at which individuals completely de-identify with their religion and do not consider themselves Muslim, we should not expect to find them in a scholarly dataset of Muslims. Rather, surveys and studies of communities from the Middle East, North Africa, or South Asia may be more appropriate. But if we as scholars are interested in the public opinions and social attitudes and political behavior of Muslim Americans then we think it is wholly appropriate to focus on those who self-identify as Muslim, as per the MAPOS data (Tables A1 and A2).
Comparison of survey demographics

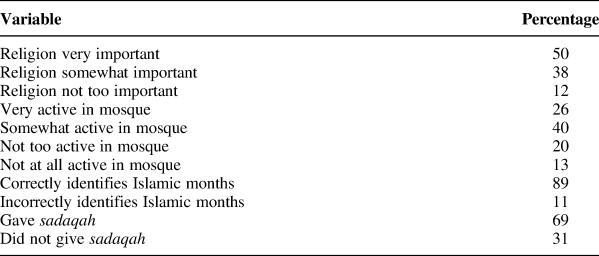
Religious characteristics of MAPOS sample

Scholars familiar with the study of Muslim Americans, know well that little empirical data on this community exists. For a population that is only one-to-two percent of the national population, simple random sample and random digit dial techniques will not work. And given concerns over social desirability and justified fears of surveillance, some may be concerned about the reliability of live-caller telephone surveys based on household lists. With respect to telephone surveys, one conclusion of Barreto and Dana (Reference Barreto, Dana, Nazita and Calfano2019) is that “we need a more efficient approach, and one that is culturally sensitive and aware of its undertaking.”
Unfortunately, there is no existing well-maintained or accurate listing of Muslim households for survey sampling. Moreover, surname sampling has presented many challenges to social scientists as there is no known list to check Muslim “sounding” surnames against the religious identity of those individuals. Thus, scholars studying Muslim Americans have had to rely on other methodologies to acquire an accurate sampling frame from which to draw an eventual sample to interview American Muslims.
The recruitment for MAPOS happened face-to-face, with research assistantsFootnote 13 handing out clipboards to participants who then self-administered the survey. Given heightened concerns over surveillance in the American Muslim community in the post 9/11 era, this survey mode helped avoid social acquiescence and social desirability bias. A considerable amount of research has shown that attitudes on sensitive topics are more truthfully reported in surveys that are conducted in a private and self-administered manner (Krysan Reference Krysan1998; Tourangeau and Yan Reference Tourangeau and Yan2007) and that minorities are likely to moderate their attitudes when being interviewed by non-Whites, the typical method in telephone surveys (Davis Reference Davis1997; Krysan and Couper Reference Krysan and Couper2003).
MAPOS data collection relied on a crowd-based sampling strategy. There is rich literature on sampling respondents in large crowds, whether it is sporting events (Tapp and Clowes Reference Tapp and Clowes2002) or protest marches (Fisher 2014). Of considerable note, Walgrave and Verhulst (Reference Walgrave and Verhulst2011) provide a comprehensive review of crowd-based survey methods and conclude with a list of best practices to yield a reliable sample. Based on the extant literature, MAPOS implemented three practices that were essential to gaining an accurate sample. First, the scholars had a large team of research assistants spread throughout the convention center grounds where Eid celebrations were taking place. Enumerators were positioned in different locations to increase the probability that any attendee of the Eid could be potentially be interviewed. Second, MAPOS put a strong emphasis on cultural awareness and cultural accuracy. Each survey team included one male and one female to recruit potential subjects, and all members of the survey team were themselves Muslim Americans, many of them were bilingual, and they were all dressed according to the customs and practices of the local community. Third, the study relied on random selection of respondents whereby enumerators counted passers-by and recruited every third person to take the survey. By recruiting at large events and at multiple sites using a skip pattern to select respondents, the MAPOS data retain some elements of random selection (Dana and Barreto 2008).
Gathering data at Eid celebrations naturally raises the question of whether or not the sample is “too religious” or if the sample has been primed into a religious mindset. While both Eid's are religious holidays, they also hold great cultural significance. Though not a perfect analogy, some compare them to Christmas and Easter in the Christian faith.Footnote 14 According to Barreto and Dana (2019), “while [the two Eids] certainly have religious orientations, they draw participation from a wide spectrum of those along the religiosity scale. Within the Christian faith, it is not just deeply religious people who attend office Christmas parties or Christmas Eve dinner with friends and family. And Sunday afternoon Easter brunch is certainly not restricted to only the most devout followers of Christianity.” Indeed, just as a large and diverse set of Christians participate in Christmas and Easter celebrations, it is also the case that a wide cross-section of American Muslims participate in Eid. Moreover, because there is such large attendance, traditional mosques are often not used for Eid prayer services and instead organizing committees often opt for the city's convention center or county fairgrounds as a site to host the gathering. This provides an ideal location for sampling a large number of participants at a single location in a single day.
But to the empirical questions we raised above, the resulting sample from MAPOS closely resembles the degree of religiosity reported by Pew, suggesting it is not “too religious.” Moreover, the data reveal that 12% of respondents say they are not at all active in their local mosque while only half report that religion is very important in their life. Still, the MAPOS data do contain some limitations, namely that it is not a statistically representative sample, but rather a cluster sample at 22 locations across the country. While the national coverage is extensive, important sites such as New York and Florida are missing. Further, the survey instrument is rather short and not all variables we may hope for are present. Given the challenge of getting respondents to fill out the self-administered survey, the researchers erred on the side of keeping the survey short and manageable.