


1 Introduction
Flow-induced vibrations (FIVs) of elastic or elastically mounted bluff bodies are common in nature (e.g. plants in wind) and frequently encountered in a great variety of engineering applications (e.g. bridges, riser tubes, offshore and submarine structures and heat exchanger tubes (Naudascher & Rockwell Reference Naudascher and Rockwell1994)). These vibrations can lead to fatigue damage and even catastrophic failure of the structure, such as the collapse of the Tacoma Narrows bridge (Billah & Scanlan Reference Billah and Scanlan1991). To model, predict and suppress the vibrations, a deep understanding of the underlying fluid–structure interaction (FSI) mechanisms is required. In the past half-century, the prevalence and importance of FIV has motivated a large number of researches aiming to characterize the FIV responses, as was comprehensively reviewed by Blevins (Reference Blevins1990) and Païdoussis, Price & de Langre (Reference Païdoussis, Price and de Langre2010). Two particular FIV phenomena, vortex-induced vibration (VIV) and galloping, have received considerable attention for their ubiquity and serious implications in engineering applications. A circular cross-section bluff body is prone to VIV, but not susceptible to galloping. Whereas for non-axisymmetric cylinders, such as square cylinders and D-section cylinders, the FIV response is strongly dependent on the angle of attack relative to the incoming flow. At different angles of attack, VIV, galloping or combined VIV–galloping would occur, respectively (Names et al. Reference Names, Zhao, Jacono and Sheridan2012; Zhao et al. Reference Zhao, Leontini, Jacono and Sheridan2014).
VIV is a kind of self-sustained vibration with limited vibration amplitude. When the natural frequency of the structure approaches the vortex-shedding frequency, the frequency of shedding deviates from the Strouhal relation and synchronizes with the oscillation frequency of the body. At large mass ratio conditions, they are close to the natural frequency of the structure (Bishop & Hassan Reference Bishop and Hassan1964). The phenomenon of wake–body synchronization was referred to as frequency lock-in (Feng Reference Feng1968). Under lock-in, the body often shows large-amplitude vibration over a well-defined reduced velocity range. It is worth noting that at sufficiently low mass ratios, the vibration frequency can deviate substantially from the structural natural frequency due to the variation of effective added mass (Bourguet & Jacono Reference Bourguet and Jacono2014). As a typical FIV phenomenon, VIV has been extensively investigated via the canonical problem of a rigid circular cylinder free to vibrate in the cross-flow direction. Through lots of experiments and numerical simulations, various aspects of VIV (such as response amplitudes, frequency characteristics and wake patterns) have been systematically studied and summarized (Sarpkaya Reference Sarpkaya2004; Williamson & Govardhan Reference Williamson and Govardhan2004; Bearman Reference Bearman2011).
However, it is not until recently that the underlying mechanism of frequency lock-in has been fully revealed and understood, owing to the progress of theoretical analysis methods, such as semi-empirical or semi-analytical models (de Langre Reference de Langre2006), and global linear stability analysis (LSA) approaches (Cossu & Morino Reference Cossu and Morino2000; Meliga & Chomaz Reference Meliga and Chomaz2011; Zhang et al.
Reference Zhang, Li, Ye and Jiang2015a
; Navrose & Mittal Reference Mittal2016; Yao & Jaiman Reference Yao and Jaiman2017). Among them, de Langre (Reference de Langre2006) adopted a linear wake oscillator model with all the nonlinear terms neglected to represent the flow, and then coupled this wake oscillator model with the structure oscillator to form a linear dynamic model for the coupled system. His analysis results indicate that VIV is essentially a kind of coupled-mode flutter. In fact, the concept of flutter has been applied to the study and interpretation of the VIV phenomenon for a long time. The earliest study can be traced back to the work of Nakamura (Reference Nakamura1969), in which he treated the vortex-excited oscillation of a circular cylinder as a binary flutter. In a recent work, Meliga & Chomaz (Reference Meliga and Chomaz2011) investigated VIV of a spring-mounted circular cylinder at low Reynolds numbers by performing an asymptotic analysis of the Navier–Stokes equations. They showed that lock-in as well as the vortex shedding at subcritical
 $Re$
is due to instability of the structure mode (SM). Moreover, they conducted nonlinear approximate analysis in the unstable region and proposed a criterion for lock-in based on the oscillation amplitude of the cylinder. Inspired by the works of de Langre (Reference de Langre2006) and Meliga & Chomaz (Reference Meliga and Chomaz2011), Zhang et al. (Reference Zhang, Li, Ye and Jiang2015a
) investigated the mechanism underlying frequency lock-in via global LSA of the FSI system. The linear dynamic model was constructed by coupling a reduced-order model (ROM) for the wake with the structure motion equation. They showed that the lock-in phenomenon at a low Reynolds number of 60 can be divided into two patterns according to different induced mechanisms, namely the ‘resonance-induced lock-in’ and the ‘flutter-induced lock-in’. For the former case, only the wake mode (WM) is unstable. Lock-in occurs because of the vicinity of the frequency of WM to the natural frequency of the structure. For the latter case, both the WM and the SM are unstable. Lock-in results from the nonlinear interaction between the two unstable modes. In the linear stage, the WM and the SM coexist and a beating phenomenon is observed. However, after enough time, the nonlinearity begins to dominate the wake dynamics and leads to strong competition between the two modes. Ultimately, the SM wins the competition and locks the WM, resulting in the famous lock-in phenomenon. In the present study, we will show that the mode competition mechanism also plays an important role in the inherent dynamics of transverse galloping of a square cylinder at low Reynolds number (
 $Re$
). Recently, Navrose & Mittal (Reference Mittal2016) also investigated the lock-in phenomenon in the laminar flow regime via LSA based on the linearized Navier–Stokes equations. They demonstrated that not all unstable modes result in lock-in; only those modes whose energy ratio is above a certain threshold value can lead to lock-in in the saturated state. In another recent work, Yao & Jaiman (Reference Yao and Jaiman2017) proposed a ROM for the laminar unsteady wake flow using the eigensystem realization algorithm and successfully employed it for stability analysis of VIV. They demonstrated that the flutter and resonance regimes do not always exist during the lock-in process, and the regimes are strongly dependent on the shape of the bluff body, the Reynolds number and the mass ratio. For instance, when the
 $Re$
for VIV of a circular cylinder exceeds 70, the resonance regime disappears and the entire lock-in region is dominated by flutter. Whereas for VIV of a square cylinder at low
 $Re$
, the lock-in is found to be dominated by resonance, without any flutter regime.
Galloping is another classical flow-induced vibration phenomenon. It mainly occurs for non-axisymmetric bluff bodies when the structural natural frequency is sufficiently larger or lower than the vortex shedding frequency. The former is known as low-speed galloping and the latter is called high-speed galloping (Païdoussis et al.
Reference Païdoussis, Price and de Langre2010). In particular, high-speed galloping is a kind of unbounded vibration characterized by a ‘build up’ phenomenon: the vibration amplitude increases vigorously with increasing flow speed when the flow speed is greater than a critical threshold value. A lot of experimental and numerical studies have focused on the dynamic response characteristics of transverse galloping (Bearman et al.
Reference Bearman, Gartshore, Maull and Parkinson1987; Sen & Mittal Reference Sen and Mittal2011, Reference Sen and Mittal2015; Names et al.
Reference Names, Zhao, Jacono and Sheridan2012; Zhao, Cheng & Zhou Reference Zhao, Cheng and Zhou2013; Zhao et al.
Reference Zhao, Leontini, Jacono and Sheridan2014, Reference Zhao, Nemes, Jacono and Sheridan2018; Cui et al.
Reference Cui, Zhao, Teng and Cheng2015; Jaiman, Sen & Gurugubelli Reference Jaiman, Sen and Gurugubelli2015; Gao & Zhu Reference Gao and Zhu2017). Among them, Names et al. (Reference Names, Zhao, Jacono and Sheridan2012) and Zhao et al. (Reference Zhao, Leontini, Jacono and Sheridan2014) carried out systematic experiments in the Reynolds number range
 $Re=1000{-}13\,000$
to investigate the influence of angle of attack on the free transverse vibration of an elastically supported square cylinder. They showed that, depending on the angle of attack, the structure can undergo combinations of VIV and galloping: for
 $\unicode[STIX]{x1D6FC}=0^{\circ }$
the FIV is dominated by transverse galloping; for
 $\unicode[STIX]{x1D6FC}=45^{\circ }$
, the FIV response is dominated by VIV; while for
 $10^{\circ }<\unicode[STIX]{x1D6FC}<22.5^{\circ }$
the underlying FIV phenomenon is very complex and difficult to determine, a new response branch was found that has amplitude larger than the ‘upper branch’ of classical VIVs but has vibration frequency locked onto approximately half of the vortex-shedding frequency for a fixed body. Moreover, they reported that, when the vortex-shedding frequency is in the vicinity of an odd-integer multiple of the galloping oscillation frequency, the vortex shedding frequency may synchronize to the multiple of the galloping oscillation frequency. The synchronization ultimately leads to the ‘kinks’ in the galloping amplitude response for light bodies. Recently, Zhao et al. (Reference Zhao, Nemes, Jacono and Sheridan2018) further investigated the time–frequency characteristics of the FIV response of a square cylinder using continuous wavelet transforms (CWT). Their analysis results revealed the intermittency behaviour of the response at the boundaries of synchronization regions as well as the mode competition at branch boundaries. This work demonstrates the importance of mode competition in FIV problems. In the aspect of numerical simulations, Sen & Mittal (Reference Sen and Mittal2011, Reference Sen and Mittal2015) studied the free response of a square cylinder in the laminar flow regime, and found that with the increase of
 $Re$
, the response can be characterized by three branches: primary lock-in, desynchronization and secondary lock-in. They indicated that the lock-in region of a square cylinder is much narrower than that of its circular cylinder counterpart, and the maximum vibration amplitude only reaches 50 % of the one of the circular cylinder. The second lock-in region denotes the galloping branch because the oscillation amplitude increases proportionally with the reduced velocity and the vibration frequency is locked onto the structural natural frequency. It is important to note that the second lock-in here is essentially different from the traditional frequency lock-in for which the vortex-shedding frequency is synchronized with the vibration frequency. For galloping response, the vortex shedding frequency is not synchronized with but much higher than the vibration frequency (Cui et al.
Reference Cui, Zhao, Teng and Cheng2015).
As described previously, the underlying mechanism of VIV has been studied in depth by various unsteady analysis methods. However, the research on the underlying mechanism of galloping is comparatively rare and has not been thorough. Up to now, most of the relevant works are still limited to quasi-steady analysis. Since the Den Hartog (Reference Den Hartog1932) criterion was proposed, the quasi-steady theory has been widely used for galloping analysis (Parkinson Reference Parkinson1989; Païdoussis et al. Reference Païdoussis, Price and de Langre2010; Mannini, Marra & Bartoli Reference Mannini, Marra and Bartoli2014; Dimitriadis Reference Dimitriadis2017). In particular, some interesting new considerations on the prediction methods based on the quasi-steady assumption are provided in the recent book of Dimitriadis (Reference Dimitriadis2017). The classical quasi-steady model is constructed based on the time-averaged loads measured from stationary structures at different angles of attack, so it cannot take into account the unsteady effects caused by the structural motion as well as the unsteady vortex shedding. Therefore, it is only applicable to the analysis of low-frequency galloping occurring at considerably high reduced velocities, but cannot be used for the analysis of the unsteady galloping or combined VIV–galloping instability that occurs at relatively low reduced velocities close to the vortex-resonance region (Bokaian & Geoola Reference Bokaian and Geoola1985; Bearman et al. Reference Bearman, Gartshore, Maull and Parkinson1987; Bearman & Luo Reference Bearman and Luo1988; Mannini, Marra & Bartoli Reference Mannini, Marra and Bartoli2015). Besides, Mannini, Marra & Bartoli (Reference Mannini, Marra and Bartoli2016) demonstrated that the interference between VIV and galloping produces significant effects even in reduced velocity ranges far apart from the vortex-resonance region.
Due to the ignorance of unsteady effects, the results predicted by quasi-steady analysis often deviate greatly from the true values. Actually, the critical reduced velocity
 $U_{g}^{\ast }$
predicted by the quasi-steady approach diminishes linearly with the decrease of the mass-damping parameter (Scruton number,
 $Sc$
), as demonstrated in Païdoussis et al. (Reference Païdoussis, Price and de Langre2010). Therefore, it is expected that the quasi-steady approach becomes first inaccurate and then inapplicable as the
 $Sc$
decreases. Below a certain value, the effect of unsteady vortex shedding cannot be neglected anymore. For instance, Parkinson & Wawzonek (Reference Parkinson and Wawzonek1981) found that the onset reduced velocity of galloping predicted by quasi-steady models is usually lower than the real starting speed at low
 $Sc$
conditions. Moreover, Joly, Etienne & Pelletier (Reference Joly, Etienne and Pelletier2012) numerically studied the transverse galloping of a square cylinder at low Reynolds numbers. They reported that when the mass ratio is less than a certain critical value, the galloping-type oscillation completely disappears, although the classical quasi-steady model still predicts that galloping will occur. By adding a forced excitation term representing the effect of unsteady vortex shedding to the quasi-steady model, this unexpected phenomenon was well recovered. This indicates that vortex shedding has a great influence on the response characteristics of galloping and must be considered, especially for low-speed galloping.
Many scholars have attempted to propose effective unsteady analysis models, but almost none have gone beyond the theoretical framework of quasi-steady analysis (Gao & Zhu Reference Gao and Zhu2017). For example, Bouclin (Reference Bouclin1977) constructed an unsteady aerodynamic model by simply combining the classical quasi-steady model and the Hartlen & Currie (Reference Hartlen and Currie1970) model for VIV. Corless & Parkinson (Reference Corless and Parkinson1988, Reference Corless and Parkinson1993) further generalized the model by considering the impact of acceleration term on the fluctuating force. Tamura & Shimada (Reference Tamura and Shimada1987) proposed a similar model by combining the wake oscillator model developed by Tamura & Matsui (Reference Tamura and Matsui1979) with the quasi-steady model. Remarkably, the wake oscillator model was conceived based on physical considerations rather than on empirical methods. However, these models have only achieved limited success. Although qualitative agreement between theory and experiment was observed, it is hard for them to acquire quantitative accuracy (Païdoussis et al. Reference Païdoussis, Price and de Langre2010). Recently, Mannini, Massai & Marra (Reference Mannini, Massai and Marra2018) improved Tamura and Shimada’s model by slightly modifying the model formulation and changing the way to determine the crucial parameter. They concluded that the modified model is able to predict the vibrational response with a satisfactory qualitative and to a certain extent quantitative agreement with experimental data.
In fact, both galloping and flutter are well known as fluid-elastic instability phenomena induced by negative aerodynamic damping; there is no essential difference between them from the perspective of the mechanical principle. However, the academic community has always discussed and analysed galloping and flutter separately. Blevins (Reference Blevins1990) attributed this to historical reasons. The scholars in civil engineering were accustomed to using galloping, while the scholars in aerospace engineering have been using flutter to describe these kinds of aeroelastic instability phenomena. The use of different terminologies often leads to confusion, especially for researchers who have just entered the academic field. We deem that the discrepancy is probably due to the lack of an effective unsteady analysis method for galloping. By contrast, the unsteady analysis theory for flutter of streamlined bodies is quite already mature, and has been successfully applied to flutter prediction and the underlying mechanism analysis (Dowell Reference Dowell1980; Gao, Zhang & Ye Reference Gao, Zhang and Ye2016). Through linear stability analysis, the unstable modes leading to flutter and their interaction mechanisms can be revealed. Therefore, it is time to establish more accurate unsteady analysis models to study the unsteady characteristics of galloping, and thereby to establish a clear connection between galloping and flutter.
The motivation for the present study is to reveal the underlying mechanisms of the galloping of a transversely vibrating square cylinder in the laminar flow regime (
 $Re\leqslant 200$
) via linear stability analysis and the direct computational fluid dynamics/computational structural dynamics (CFD/CSD) simulation method. Special attention is paid to the mechanism of mode competition between the fluid and the structure, which is responsible for the interference between VIV and galloping. Moreover, through the combination of these two methods, we hope to bridge the gap between galloping and flutter. The linear dynamic model is constructed by coupling a low-dimensional fluid model with the structure motion equation. The ROM of unsteady wake flow is identified using the autoregressive with exogenous input (ARX) technique based on the Navier–Stokes equations. Compared with previous studies which focus mainly on the saturated galloping response, we are more concerned with the entire evolution process of the coupled system from the equilibrium steady state to the ultimate saturated limit-cycle oscillation. First, the most unstable modes that are relevant to the galloping phenomenon are extracted using LSA. Then, direct numerical simulations are carried out to study the evolution or development of the unstable modes as well as their competition mechanism. As such, we can deeply study the effect of unsteady vortex shedding on galloping responses. Finally, the coherent flow structures for galloping responses are extracted using the dynamic mode decomposition (DMD) method.
2 Numerical simulation method
2.1 Navier–Stokes equations
The compressible Navier–Stokes equations were utilized to simulate the two-dimensional laminar flow past a square cylinder at low Reynolds numbers (
 $Re\leqslant 200$
). The Mach number was set to be
 $Ma=0.1$
. It has been confirmed that the compressible Navier–Stokes equations with Mach numbers less than 0.3 can be used as an efficient alternative to study incompressible flows as well as the flow-induced vibrations of bluff bodies (Wanderley & Levi Reference Wanderley and Levi2002). The Reynolds number, based on the oncoming flow velocity (
 $U_{\infty }$
) and the side length of the square cylinder (
 $D$
), is defined as
 $Re=\unicode[STIX]{x1D70C}U_{\infty }D/\unicode[STIX]{x1D707}$
, where
 $\unicode[STIX]{x1D70C}$
and
 $\unicode[STIX]{x1D707}$
are the density and the dynamic viscosity of the fluid, respectively. To cope with the deforming mesh due to the vibration of the cylinder, the arbitrary Lagrangian–Eulerian form of the Navier–Stokes equations was employed. The non-dimensional governing equations, with all physical variables normalized by
 $U_{\infty }$
and
 $D$
, are given as follows:
 $$\begin{eqnarray}\frac{\unicode[STIX]{x2202}}{\unicode[STIX]{x2202}t}\int \int _{\unicode[STIX]{x1D6FA}}\boldsymbol{Q}\,\text{d}V+\oint _{\unicode[STIX]{x2202}\unicode[STIX]{x1D6FA}}\boldsymbol{F}(\boldsymbol{Q},\boldsymbol{V}_{grid})\boldsymbol{\cdot }\boldsymbol{n}\,\text{d}S=\oint _{\unicode[STIX]{x2202}\unicode[STIX]{x1D6FA}}\boldsymbol{G}(\boldsymbol{Q})\boldsymbol{\cdot }\boldsymbol{n}\,\text{d}S,\end{eqnarray}$$
where
 $\unicode[STIX]{x1D6FA}$
denotes the control surface element,
 $\unicode[STIX]{x2202}\unicode[STIX]{x1D6FA}$
represents the boundary of the control surface element,
 $t$
is the dimensionless time and
 $\boldsymbol{n}$
is the identity normal vector. The vector of conservative variables
 $\boldsymbol{Q}$
, the modified inviscid flux vector
 $\boldsymbol{F}(\boldsymbol{Q},\boldsymbol{V}_{grid})$
and the viscous flux vector
 $\boldsymbol{G}(\boldsymbol{Q})$
are given as follows:
 $$\begin{eqnarray}\boldsymbol{Q}=\left[\begin{array}{@{}c@{}}\unicode[STIX]{x1D70C}\\ \unicode[STIX]{x1D70C}u\\ \unicode[STIX]{x1D70C}v\\ e_{0}\end{array}\right],\quad \boldsymbol{F}_{x}(\boldsymbol{Q},\boldsymbol{V}_{grid})=\left[\begin{array}{@{}c@{}}\unicode[STIX]{x1D70C}(u-u_{grid})\\ \unicode[STIX]{x1D70C}u(u-u_{grid})+P\\ \unicode[STIX]{x1D70C}(u-u_{grid})v\\ e_{0}(u-u_{grid})+Pu\end{array}\right],\end{eqnarray}$$
 $$\begin{eqnarray}\displaystyle & \displaystyle \boldsymbol{F}_{y}(\boldsymbol{Q},\boldsymbol{V}_{grid})=\left[\begin{array}{@{}c@{}}\unicode[STIX]{x1D70C}(v-v_{grid})\\ \unicode[STIX]{x1D70C}u(v-v_{grid})\\ \unicode[STIX]{x1D70C}(v-v_{grid})v+P\\ e_{0}(v-v_{grid})+Pv\end{array}\right], & \displaystyle\end{eqnarray}$$
 $$\begin{eqnarray}\displaystyle & \displaystyle \boldsymbol{G}_{x}(\boldsymbol{Q})=\unicode[STIX]{x1D707}\left[\begin{array}{@{}c@{}}0\\ 2u_{x}-{\displaystyle \frac{2}{3}}(u_{x}+v_{y})\\ v_{x}+u_{y}\\ u\left[2u_{x}-{\displaystyle \frac{2}{3}}(u_{x}+v_{y})\right]+v(v_{x}+u_{y})+{\displaystyle \frac{1}{\unicode[STIX]{x1D6FE}-1}}{\displaystyle \frac{T_{x}}{Pr}}\end{array}\right], & \displaystyle\end{eqnarray}$$
 $$\begin{eqnarray}\displaystyle & \displaystyle \boldsymbol{G}_{y}(\boldsymbol{Q})=\unicode[STIX]{x1D707}\left[\begin{array}{@{}c@{}}0\\ v_{x}+u_{y}\\ 2v_{y}-{\displaystyle \frac{2}{3}}(u_{x}+v_{y})\\ u(v_{x}+u_{y})+v\left[2v_{y}-{\displaystyle \frac{2}{3}}(u_{x}+v_{y})\right]+{\displaystyle \frac{1}{\unicode[STIX]{x1D6FE}-1}}{\displaystyle \frac{T_{y}}{Pr}}\end{array}\right], & \displaystyle\end{eqnarray}$$
where
 $u$
,
 $v$
are the
 $x$
-wise and
 $y$
-wise components of the velocity vector of the flow,
 $u_{grid}$
,
 $v_{grid}$
are the
 $x$
-wise and
 $y$
-wise components of the velocity vector of the deforming grid and
 $e_{0}$
,
 $P$
denote the total energy and pressure, respectively. The subscripts
 $x$
and
 $y$
denote the partial derivatives of the flow velocity;
 $T$
is the temperature,
 $Pr$
is the Prandtl number and
 $\unicode[STIX]{x1D6FE}=1.4$
is the ratio of specific heats.
The computational domain as well as the generated mesh is shown in figure 1. The overall size of the computational domain is
 $60D\times 40D$
, and the centre of the square cylinder is
 $20D$
from the upstream boundary. The unstructured hybrid mesh employed for the present computations consists of 18 741 nodes and 34 408 elements. We refer to this mesh as
 $M1$
. The convergence of
 $M1$
has been verified by a finer mesh in § 2.3. No-slip boundary condition was applied on the velocity of the cylinder surface. The location and velocity of the cylinder were updated at each real-time step. The far field was assigned a non-reflective boundary condition using the Riemann invariants. The entire mesh was deformed at each time step and was updated using the radial base function interpolation method (Boer, Van der Schoot & Bijl Reference De Boer, Van der Schoot and Bijl2007). A compact Wendlands C2 function was chosen as the basis function. The quality of the meshes after deformation is high enough to perform accurate flow calculations.
Computational domain for a square cylinder: (a) hybrid mesh employed in the present study and (b) close-up view of the mesh near the surface of the cylinder.

2.2 Structure motion equation
In this study, we focus on the dynamic response characteristics of an elastically mounted square cylinder subjected to a uniform flow, as sketched in figure 2. The square cylinder is free to vibrate in the transverse direction only. The rigid motion of the body along the Cartesian axes is given by:
 $$\begin{eqnarray}\ddot{Y} +4\unicode[STIX]{x03C0}F_{s}\unicode[STIX]{x1D701}{\dot{Y}}+(2\unicode[STIX]{x03C0}F_{s})^{2}Y=\frac{C_{L}}{2m^{\ast }},\end{eqnarray}$$
where
 $F_{s}=f_{s}D/U_{\infty }$
is the reduced natural frequency in a vacuum related to the natural frequency of a mass–spring system (
 $f_{s}$
);
 $\unicode[STIX]{x1D701}$
is the structural damping ratio and is set to be zero to encourage large-amplitude oscillations;
 $m^{\ast }$
is the non-dimensional mass of the body defined as
 $m^{\ast }=m/\unicode[STIX]{x1D70C}D^{2}$
with
 $m$
the actual mass of the oscillator per unit length;
 $C_{L}$
is the instantaneous lift coefficient acting on the body;
 $\ddot{Y}$
,
 ${\dot{Y}}$
and
 $Y$
denote the acceleration, velocity and displacement of the cylinder in the transverse direction normalized by
 $D$
and
 $U_{\infty }$
. In particular, the reduced velocity is defined as
 $U^{\ast }=1/F_{s}=U_{\infty }/f_{s}D$
.
Schematic diagram of an elastically mounted square cylinder subjected to a uniform flow;
 $m$
,
 $c$
and
 $k$
are the mass, damping and stiffness of the system.

2.3 Numerical scheme and verification
The cell-centred finite volume method was employed to solve the Navier–Stokes equations. Spatial discretization of the inviscid flux terms was accomplished using the second-order AUSM+-up scheme (Liou Reference Liou2006), while the viscous flux terms were discretized by the standard central scheme. A second-order accurate full implicit scheme was used to integrate the equations in time domain, and an implicit symmetric Gauss–Seidel iterative time-marching scheme was applied in the pseudo time step.
A fourth-order hybrid linear multi-step scheme was adopted to solve the nonlinear FSI problems (Zhang, Jiang & Ye Reference Zhang, Jiang and Ye2007). The flow and structural equations were solved separately using a partitioned approach. At each real-time step, the fluid force acting on the square cylinder was obtained from the solution of Navier–Stokes equations; and then the displacement of the inner boundary was updated by solving the structural motion equation, which was necessary for the solution of the flow equations at the next time step. A more detailed process and extensive validations of the numerical method have been documented in our previous works (Zhang et al.
Reference Zhang, Li, Ye and Jiang2015a
; Li, Zhang & Gao Reference Li, Zhang and Gao2018). For completeness, further validations of the numerical method for the flow and VIV of a square cylinder at low
 $Re$
were performed. Mesh dependency and time step convergence study was also carried out.
Firstly, we computed the flow past a stationary square cylinder at
 $Re=100$
. To study the convergence of the time step, four computations were conducted at
 $\unicode[STIX]{x0394}t=0.20$
, 0.10, 0.05 and 0.02 for
 $M1$
. In addition, a finer mesh
 $M2$
with 24 764 nodes and 44 648 elements was generated for the mesh dependency study;
 $M2$
has the same domain size as
 $M1$
but has higher spatial resolution especially close to the surface of the square cylinder. Table 1 shows the comparison of the mean drag coefficient (
 $\overline{C_{D}}$
), root-mean-square (r.m.s.) drag coefficient (
 $C_{D}^{rms}$
), amplitude of lift coefficient (
 $C_{L}^{max}$
), r.m.s. lift coefficient (
 $C_{L}^{rms}$
) and Strouhal number of the vortex shedding (
 $St$
) with the published results in the literature. As can be seen, with the decrease of the time step, the results for
 $M1$
gradually converge and remain almost unchanged when
 $\unicode[STIX]{x0394}t\leqslant 0.05$
. Thus, the time step was set to be
 $\unicode[STIX]{x0394}t=0.05$
for most of the present computations. On the other hand, the results from
 $M1$
and
 $M2$
at
 $\unicode[STIX]{x0394}t=0.05$
are in good agreement and the differences of the values between the two meshes are generally less than 1 %. This indicates that
 $M1$
is adequate for the present study. Besides, our results compare reasonably well with those of other researchers, verifying that the numerical method we adopted is reliable.
Mesh dependency and time step convergence study: comparison of the present calculation results with the published numerical data in the literature for the flow past a stationary square cylinder at
 $Re=100$
.

To further verify our numerical solver, VIV of a square cylinder with two degrees of freedom was simulated. The parameter settings were consistent with one of the numerical cases in Zhao et al. (Reference Zhao, Cheng and Zhou2013), i.e.
 $Re=100$
,
 $m^{\ast }=3$
and
 $\unicode[STIX]{x1D701}=0$
. The square cylinder is free to vibrate in both the transverse and in-line directions. The reduced velocity
 $U^{\ast }$
is varied by changing the reduced natural frequency of the structure
 $F_{s}$
. Since the vibration amplitude in the transverse direction is much larger than that in the in-line direction, we only present the results for transverse vibrations. Figure 3 shows the transverse vibration amplitude of the cylinder varying with
 $U^{\ast }$
. The vibration amplitude in the transverse direction is defined as
 $A_{y}=(Y^{max}-Y^{min})/2$
with
 $Y^{max}$
and
 $Y^{min}$
being the maximum and minimum transverse displacements of the cylinder, respectively. As can be seen, remarkable VIV begins to occur at
 $U^{\ast }=4$
, and the response amplitude increases rapidly in the range
 $4<U^{\ast }<5$
. The maximum vibration amplitude is achieved at
 $U^{\ast }=5$
, approximately, with a value of
 $A_{y}=0.315$
. When
 $U^{\ast }>5$
, the transverse vibration amplitude decreases gradually with the increase of
 $U^{\ast }$
. It is worth noting that the critical reduced velocity for vortex-shedding resonance
 $U_{r}^{\ast }=1/St$
falls in the descending branch of the VIV response. Moreover, as will be shown in figure 8(b), when the mass ratio is further reduced, the response curve of VIV expands on the left-hand side of
 $U_{r}^{\ast }$
. This is opposite to the cases of high Reynolds numbers and high mass ratios, for which
 $U_{r}^{\ast }$
falls at the beginning of the VIV response pattern and the excitation range expands on the right-hand side (Bearman & Obasaju Reference Bearman and Obasaju1982; Nakamura & Matsukawa Reference Nakamura and Matsukawa1987).
Transverse vibration amplitude for VIV of a two-degree-of-freedom elastically mounted square cylinder at
 $Re=100$
,
 $m^{\ast }=3$
and
 $\unicode[STIX]{x1D701}=0$
. The numerical results of Zhao et al. (Reference Zhao, Cheng and Zhou2013) are also plotted for comparison;
 $U_{r}^{\ast }=1/St$
denotes the critical reduced velocity for vortex-shedding resonance.

The present numerical results agree excellently well with those of Zhao et al. (Reference Zhao, Cheng and Zhou2013). This indicates that our numerical method is effective and applicable to study the FIV problems of a square cylinder at low
 $Re$
.
3 Linear stability analysis for FSI system
3.1 Reduced-order modelling of the unsteady wake flow
The model reduction for unsteady flow has been an active area of research in recent years (Lucia, Beran & Silva Reference Lucia, Beran and Silva2004; Ghoreyshi, Jirasek & Cummings Reference Ghoreyshi, Jirasek and Cummings2014; Rowley & Dawson Reference Rowley and Dawson2017). Compared to high-fidelity numerical simulations, reduced-order models (ROMs) can retain the dominant flow dynamics of the original system with significant lower orders, which results in a great improvement of computational efficiency. In this section, we focus on developing ROMs for the unsteady flow past a transversely vibrating square cylinder. The system identification method based on the ARX model was adopted for model reduction. This method has been discussed in detail in our previous works (Zhang et al. Reference Zhang, Li, Ye and Jiang2015a ; Gao et al. Reference Gao, Zhang, Li, Liu, Quan, Ye and Jiang2017; Kou & Zhang Reference Kou and Zhang2019). For completeness, we give a brief introduction of the ROM method here. The linear time-invariant input–output model is given as:
 $$\begin{eqnarray}\boldsymbol{y}_{F}(k)=\mathop{\sum }_{i=1}^{na}\unicode[STIX]{x1D63C}_{i}\boldsymbol{y}_{F}(k-i)+\mathop{\sum }_{i=0}^{nb-1}\unicode[STIX]{x1D63D}_{i}\boldsymbol{u}(k-i),\end{eqnarray}$$
where
 $\boldsymbol{y}_{F}$
is the output vector and
 $\boldsymbol{u}$
is the input vector of the system. For the current single-input–single-output model,
 $\boldsymbol{u}=[Y]$
(transverse displacement) and
 $\boldsymbol{y}_{F}=[C_{L}]$
(instantaneous lift coefficient);
 $\unicode[STIX]{x1D63C}_{i}$
and
 $\unicode[STIX]{x1D63D}_{i}$
are the constant coefficients to be estimated. The least squares method is employed for the estimation procedure;
 $na$
and
 $nb$
are the delay orders determined by the user. By varying
 $na$
and
 $nb$
, we can find the model that minimizes the error between the training data and ROM predictions.
Steady-state base flow of a stationary square cylinder at
 $Re=150$
: (a) streamwise and (b) cross-flow velocity fields.

(a)Time history and (b) fast Fourier transformation of the training signal.

The discrete-time fluid model (3.1) can be further converted into the continuous-time state-space form as:
 $$\begin{eqnarray}\left.\begin{array}{@{}l@{}}\dot{\boldsymbol{x}}_{F}(t)=\unicode[STIX]{x1D63C}_{F}\boldsymbol{x}_{F}(t)+\unicode[STIX]{x1D63D}_{F}u(t),\\ y_{F}(t)=\unicode[STIX]{x1D63E}_{F}\boldsymbol{x}_{F}(t)+\unicode[STIX]{x1D63F}_{F}u(t),\end{array}\right\}\end{eqnarray}$$
where
 $\boldsymbol{x}_{F}$
is the state vector with the order of
 $(na+nb)$
;
 $(\unicode[STIX]{x1D63C}_{F},\unicode[STIX]{x1D63D}_{F},\unicode[STIX]{x1D63E}_{F},\unicode[STIX]{x1D63F}_{F})$
are the system matrices. Once the ROM is established, the stability characteristics of the flow can be quickly obtained by computing the eigenvalues of matrix
 $\unicode[STIX]{x1D63C}_{F}$
in the state-space equation (3.2). It is remarkable that, for the stable flow at subcritical
 $Re$
, the ROM can be directly identified based on the steady flow. However, for the unstable flow at supercritical
 $Re$
, the ROM should be trained based on the unstable steady-state base flow.
Here, we take the unsteady flow modelling of
 $Re=150$
as an example to verify the correctness of the ROM method. The steady-state base flow was computed using a time-filtering method based on the unsteady flow solver (Zhang, Liu & Li Reference Zhang, Liu and Li2015b
), as shown in figure 4. A smoothed chirp signal with an increasing frequency is adopted as the training signal. The time history as well as the fast Fourier transformation (FFT) of the signal is shown in figure 5. As can be seen, the signal has a wide reduced frequency band ranging from 0 to 0.4 approximately, which covers the vortex-shedding frequency of a square cylinder in the laminar flow regime. When the data training is completed, we vary the delay orders to construct an accurate enough model. The identification error used for model-order selection is defined as:
 $$\begin{eqnarray}e=\frac{\displaystyle \mathop{\sum }_{i=1}^{N}|y_{F}(i)-y_{F}^{iden}(i)|}{\displaystyle \mathop{\sum }_{i=1}^{N}|y_{F}(i)|},\end{eqnarray}$$
where
 $y_{F}^{iden}$
denotes the vector of the identified lift coefficient and
 $N$
is the size of the training data. The identified results with various delay orders are compared with those of direct numerical simulation in figure 6. For clarity, only the results for
 $na=nb$
are presented. As can be seen, the identification error gradually decreases with increasing delay orders. The best identification is achieved at
 $na=nb=80$
with an identification error less than 1 %. Hence, for the case of
 $Re=150$
, we set the delay orders equal to
 $na=nb=80$
.
Identified results under the training signal compared with that of direct numerical simulation at
 $Re=150$
.

For further verification, the ARX-based ROM was applied to predict the instability onset of the square cylinder wake flow due to a Hopf bifurcation. The eigenvalues of the first two least-stable modes at various Reynolds numbers are plotted in figure 7. As can be seen, the base flow starts to become unstable at
 $Re_{cr}\approx 45.2$
when the eigenvalue of the leading fluid mode crosses the imaginary axis and moves into the right half of the complex plane, which is consistent with the numerical predictions of Yoon, Yang & Choi (Reference Yoon, Yang and Choi2010), Park & Yang (Reference Park and Yang2016) and Yao & Jaiman (Reference Yao and Jaiman2017). In addition, the eigenvalue of the second fluid mode gradually approaches the imaginary axis as the
 $Re$
increases. This indicates that the second mode tends to be a weak-stable mode (light-damped mode) at large
 $Re$
, and therefore cannot be neglected anymore in fluid-elastic stability analysis. We will show in § 5 that the second fluid mode plays an important role in the fluid–structure coupling mechanism that inherently leads to the galloping-type oscillation of the structure.
Eigenvalue analysis via the ARX-based ROM for the flow past a stationary square cylinder: (a) least-stable fluid mode and (b) second least-stable fluid mode. The flow becomes unstable at the critical
 $Re_{cr}=45.2$
when the eigenvalue of the least-stable fluid mode crosses the imaginary axis and moves into the right half of the complex plane.

3.2 ROM-based FSI model
By defining a structure state vector
 $\boldsymbol{x}_{s}=[Y,{\dot{Y}}]^{T}$
for the present one-degree-of-freedom transversely vibrating square cylinder, the structure motion equation (2.6) can be written in the state-space form as:
 $$\begin{eqnarray}\left.\begin{array}{@{}l@{}}\dot{\boldsymbol{x}}_{S}(t)=\unicode[STIX]{x1D63C}_{S}\boldsymbol{x}_{S}(t)+q\unicode[STIX]{x1D63D}_{S}y_{F}(t),\\ Y(t)=\unicode[STIX]{x1D63E}_{S}\boldsymbol{x}_{S}(t)+q\unicode[STIX]{x1D63F}_{S}y_{F}(t),\end{array}\right\}\end{eqnarray}$$
where
 $\unicode[STIX]{x1D63C}_{S}=\left[\!\begin{smallmatrix}0 & 1\\ -(2\unicode[STIX]{x03C0}F_{s})^{2} & -4\unicode[STIX]{x03C0}F_{s}\unicode[STIX]{x1D701}\end{smallmatrix}\!\right]$
,
 $\unicode[STIX]{x1D63D}_{S}=\left[\!\begin{smallmatrix}0\\ 1\end{smallmatrix}\!\right]$
,
 $\unicode[STIX]{x1D63E}_{S}=\left[\!\begin{smallmatrix}1 & 0\end{smallmatrix}\!\right]$
,
 $\unicode[STIX]{x1D63F}_{S}=\left[\!\begin{smallmatrix}0\end{smallmatrix}\!\right]$
and
 $q=1/(2m^{\ast })$
. By coupling the structural state equation (3.4) with the aerodynamic state equation (3.2), we obtain the state and output equations for the linear coupled system as follows:
 $$\begin{eqnarray}\left.\begin{array}{@{}c@{}}\dot{\boldsymbol{x}}_{FS}(t)=\left[\begin{array}{@{}cc@{}}\unicode[STIX]{x1D63C}_{S}+q\unicode[STIX]{x1D63D}_{S}\unicode[STIX]{x1D63F}_{F}\unicode[STIX]{x1D63E}_{S} & q\unicode[STIX]{x1D63D}_{S}\unicode[STIX]{x1D63E}_{F}\\ \unicode[STIX]{x1D63D}_{F}\unicode[STIX]{x1D63E}_{S} & \unicode[STIX]{x1D63C}_{F}\end{array}\right]\boldsymbol{\cdot }\boldsymbol{x}_{FS}=\unicode[STIX]{x1D63C}_{FS}\unicode[STIX]{x1D66D}_{FS}(t)\\ Y(t)=[\unicode[STIX]{x1D63E}_{S},\unicode[STIX]{x1D7EC}]\boldsymbol{\cdot }\boldsymbol{x}_{FS}(t),\end{array}\right\}\end{eqnarray}$$
where
 $\boldsymbol{x}_{FS}=[\boldsymbol{x}_{S},\boldsymbol{x}_{F}]^{T}$
. The ROM-based linear dynamic model for FIV of a square cylinder is now constructed. The fluid-elastic stability problem is then converted into solving and analysing the eigenvalues of
 $\unicode[STIX]{x1D63C}_{FS}$
, expressed as
 $\unicode[STIX]{x1D706}=\unicode[STIX]{x1D706}_{r}+\text{i}\unicode[STIX]{x1D706}_{i}$
. The real part
 $\unicode[STIX]{x1D706}_{r}$
represents the growth rate of the eigenmodes, while the imaginary part
 $\unicode[STIX]{x1D706}_{i}$
denotes the angular frequency, which is equal to
 $2\unicode[STIX]{x03C0}$
times the eigenfrequency of the eigenmodes. Tracking the eigenvalues varying with structural parameters (
 $F_{s}$
,
 $\unicode[STIX]{x1D701}$
and
 $m^{\ast }$
), we can obtain the stability characteristics of the coupled system. Specifically, in the present study, we investigate the trajectories of eigenvalues by varying the reduced natural frequency of structure
 $F_{s}$
(
 $1/U^{\ast }$
) while maintaining the
 $Re$
,
 $m^{\ast }$
and
 $\unicode[STIX]{x1D701}$
fixed at given values.
4 Overview of the galloping response
In this section, systematic numerical computations were performed to get an overview of the response characteristics of transverse galloping in the laminar flow regime. The reduced velocity
 $U^{\ast }$
is varied by changing the reduced natural frequency of structure
 $F_{s}$
while keeping the
 $Re$
and
 $m^{\ast }$
fixed. The structural damping ratio
 $\unicode[STIX]{x1D701}$
is set to be zero. The focus is on the response amplitudes, frequency characteristics, force coefficients and wake patterns.
4.1 Response amplitude
The transverse vibration amplitudes of the square cylinder as a function of
 $U^{\ast }$
at various
 $(Re,m^{\ast })$
combinations are shown in figure 8. Figure 8(a) shows the results for
 $m^{\ast }=10$
at four representative Reynolds numbers,
 $Re=140$
, 150, 160 and 180. Figure 8(b) shows the results for
 $Re=150$
at four representative mass ratios,
 $m^{\ast }=2$
, 5, 10 and 20. Overall, there exist two typical FIV responses: VIV and galloping. When the structure natural frequency approaches the vortex-shedding frequency of a stationary cylinder in the range
 $4<U^{\ast }<8$
, vortex-excited resonance leads to a relatively large-amplitude vibration of the structure. Compared to its circular cylinder counterpart, the vibration amplitude and lock-in regime for VIV of a square cylinder are much smaller and narrower, which is in agreement with the numerical results of Sen & Mittal (Reference Sen and Mittal2011). This is mainly because VIV of a square cylinder is dominated by resonance without any flutter regime (Yao & Jaiman Reference Yao and Jaiman2017). As demonstrated in Zhang et al. (Reference Zhang, Li, Ye and Jiang2015a
), flutter is the root cause of frequency lock-in, which can lead to larger vibration amplitude of the structure than that induced by resonance. Galloping mainly occurs at relatively large reduced velocities, generally
 $U^{\ast }>10$
. When the reduced velocity is greater than a critical threshold
 $U_{g}^{\ast }$
, the transverse vibration amplitude increases progressively with the increase of
 $U^{\ast }$
. Unlike VIV, which only shows large-amplitude oscillations in the lock-in region, galloping is a kind of unbounded vibration. There exists no upper instability boundary with regard to
 $U^{\ast }$
beyond which galloping will cease.
Transverse vibration amplitude of the square cylinder as a function of
 $U^{\ast }$
for various
 $(Re,m^{\ast })$
combinations: (a) results for
 $m^{\ast }=10$
at different
 $Re$
and (b) results for
 $Re=150$
at different
 $m^{\ast }$
. Note that the results for
 $(Re,m^{\ast })=(150,10)$
are shown in both plots.

For the case of
 $m^{\ast }=10$
, the response amplitude of VIV decreases slightly as the
 $Re$
increases. Moreover, the reduced velocity corresponding to the peak value of vibration amplitude varies little with
 $Re$
and locates at
 $U^{\ast }=5.75$
, approximately. On the other side, the galloping onset
 $U_{g}^{\ast }$
decreases gradually and the galloping vibration amplitude increases monotonically with increasing
 $Re$
. It is noteworthy that there is a kink in the amplitude response of
 $Re=180$
near
 $U^{\ast }=16$
(figure 8
a). This phenomenon has been previously investigated by Zhao et al. (Reference Zhao, Leontini, Jacono and Sheridan2014) and Jaiman, Guan & Miyanawala (Reference Jaiman, Guan and Miyanawala2016), and is attributed to the 1 : 3 synchronization between the vortex-shedding frequency and the body oscillation frequency. With the increase of
 $Re$
, the onset of galloping gradually extends to lower reduced velocities where the unsteady effect is very strong. For the present study in the laminar flow regime, VIV and galloping are always separated with a desynchronization region between them. No combined VIV–galloping phenomenon is observed. It is remarkable that the vibration amplitude of galloping drops suddenly when the Reynolds number is reduced from 150 to 140. This indicates the existence of a critical
 $Re$
below which galloping will not occur. To accurately determine the critical
 $Re$
, further computations were conducted for various
 $Re$
at a sufficiently large reduced velocity
 $U^{\ast }=40$
. Figure 9 shows the vibration amplitude of the cylinder as a function of
 $Re$
. As can be seen, the critical Reynolds number
 $Re_{cg}$
for galloping is approximately 139, which is close to the value of 140 predicted by Joly et al. (Reference Joly, Etienne and Pelletier2012).
Variation of the transverse vibration amplitude with
 $Re$
for
 $m^{\ast }=10$
at a sufficiently large
 $U^{\ast }=40$
.

For the case of
 $Re=150$
, with the decrease of
 $m^{\ast }$
, the resonance peak of VIV gradually increases while the corresponding reduced velocity
 $U^{\ast }$
where the peak is acquired slightly decreases. This indicates that VIV is intensified when the mass ratio is decreased. In contrast, the onset of galloping increases and the galloping vibration amplitude decreases rapidly with decrease in
 $m^{\ast }$
. This is a bit counter-intuitive since the intensity of galloping oscillation is reduced as the mass ratio decreases. More specifically, the galloping-type oscillation completely vanishes for
 $m^{\ast }=2$
. This indicates that there exists a critical mass ratio below which galloping completely disappears and the response will be dominated by VIV only. This phenomenon was first reported by Joly et al. (Reference Joly, Etienne and Pelletier2012) and then confirmed by Sen & Mittal (Reference Sen and Mittal2015) through numerical simulations. However, as far as we know, the primary cause that leads to this strange phenomenon has not been thoroughly investigated and discussed until now. In this study, we try to give an explanation for this peculiar phenomenon from the point view of mode competition between the fluid and the structure, as will be shown in § 5.
4.2 Frequency characteristics and lift force
Here, we take the case of
 $(Re,m^{\ast })=(150,10)$
as an example, to further study other aspects of galloping response. Figure 10 presents the vibration amplitude
 $A_{y}$
, frequency ratios of vibration and vortex shedding
 $F^{\ast }=F/F_{s}$
, amplitude of lift coefficient
 $C_{L}^{max}$
and phase angle
 $\unicode[STIX]{x1D719}$
between the lift coefficient
 $C_{L}$
and transverse displacement
 $Y$
, as a function of
 $U^{\ast }$
. Figure 11 shows the time histories of the lift coefficient and transverse displacement as well as their power spectral densities (PSDs) at three typical
 $U^{\ast }$
. As can be seen, the response can be divided into three branches by two critical reduced velocities (
 $U^{\ast }=5.75$
and
 $U^{\ast }=17$
): the initial branch (
 $U^{\ast }\leqslant 5.75$
), the lower branch (
 $5.75<U^{\ast }<17$
) and the galloping branch (
 $U^{\ast }\geqslant 17$
). The first two branches belong to VIV. In the initial branch, the vibration amplitude increases rapidly with increasing
 $U^{\ast }$
, and the maximum vibration amplitude is acquired at
 $U^{\ast }=5.75$
with a value of 0.138. In the lower branch, the vibration amplitude decreases gradually with increasing
 $U^{\ast }$
. When the galloping is triggered at
 $U_{g}^{\ast }=17$
, the vibration amplitude increases monotonously again with increasing
 $U^{\ast }$
.
FIV response of a transversely vibrating square cylinder as a function of
 $U^{\ast }$
for
 $(Re,m^{\ast })=(150,10)$
: (a) the vibration amplitude of cylinder
 $A_{y}$
, (b) the amplitude of lift coefficient
 $C_{L}^{max}$
, (c) the dominant frequency ratios of cylinder vibration
 $F_{y}^{\ast }$
and lift coefficient
 $F_{C_{L}}^{\ast }$
, and (d) the phase angle
 $\unicode[STIX]{x1D719}$
between
 $C_{L}$
and
 $Y$
at the vibration frequency. The frequency ratio is defined as
 $F^{\ast }=F/F_{s}$
with
 $F_{s}$
being the reduced natural frequency of the structure.

Time histories of transverse displacement and lift coefficient, and their power spectral densities for
 $(Re,m^{\ast })=(150,10)$
at three representative reduced velocities: (a,b)
 $U^{\ast }=6$
, (c,d)
 $U^{\ast }=10$
and (e,f)
 $U^{\ast }=20$
. The power spectra are normalized by peak values.
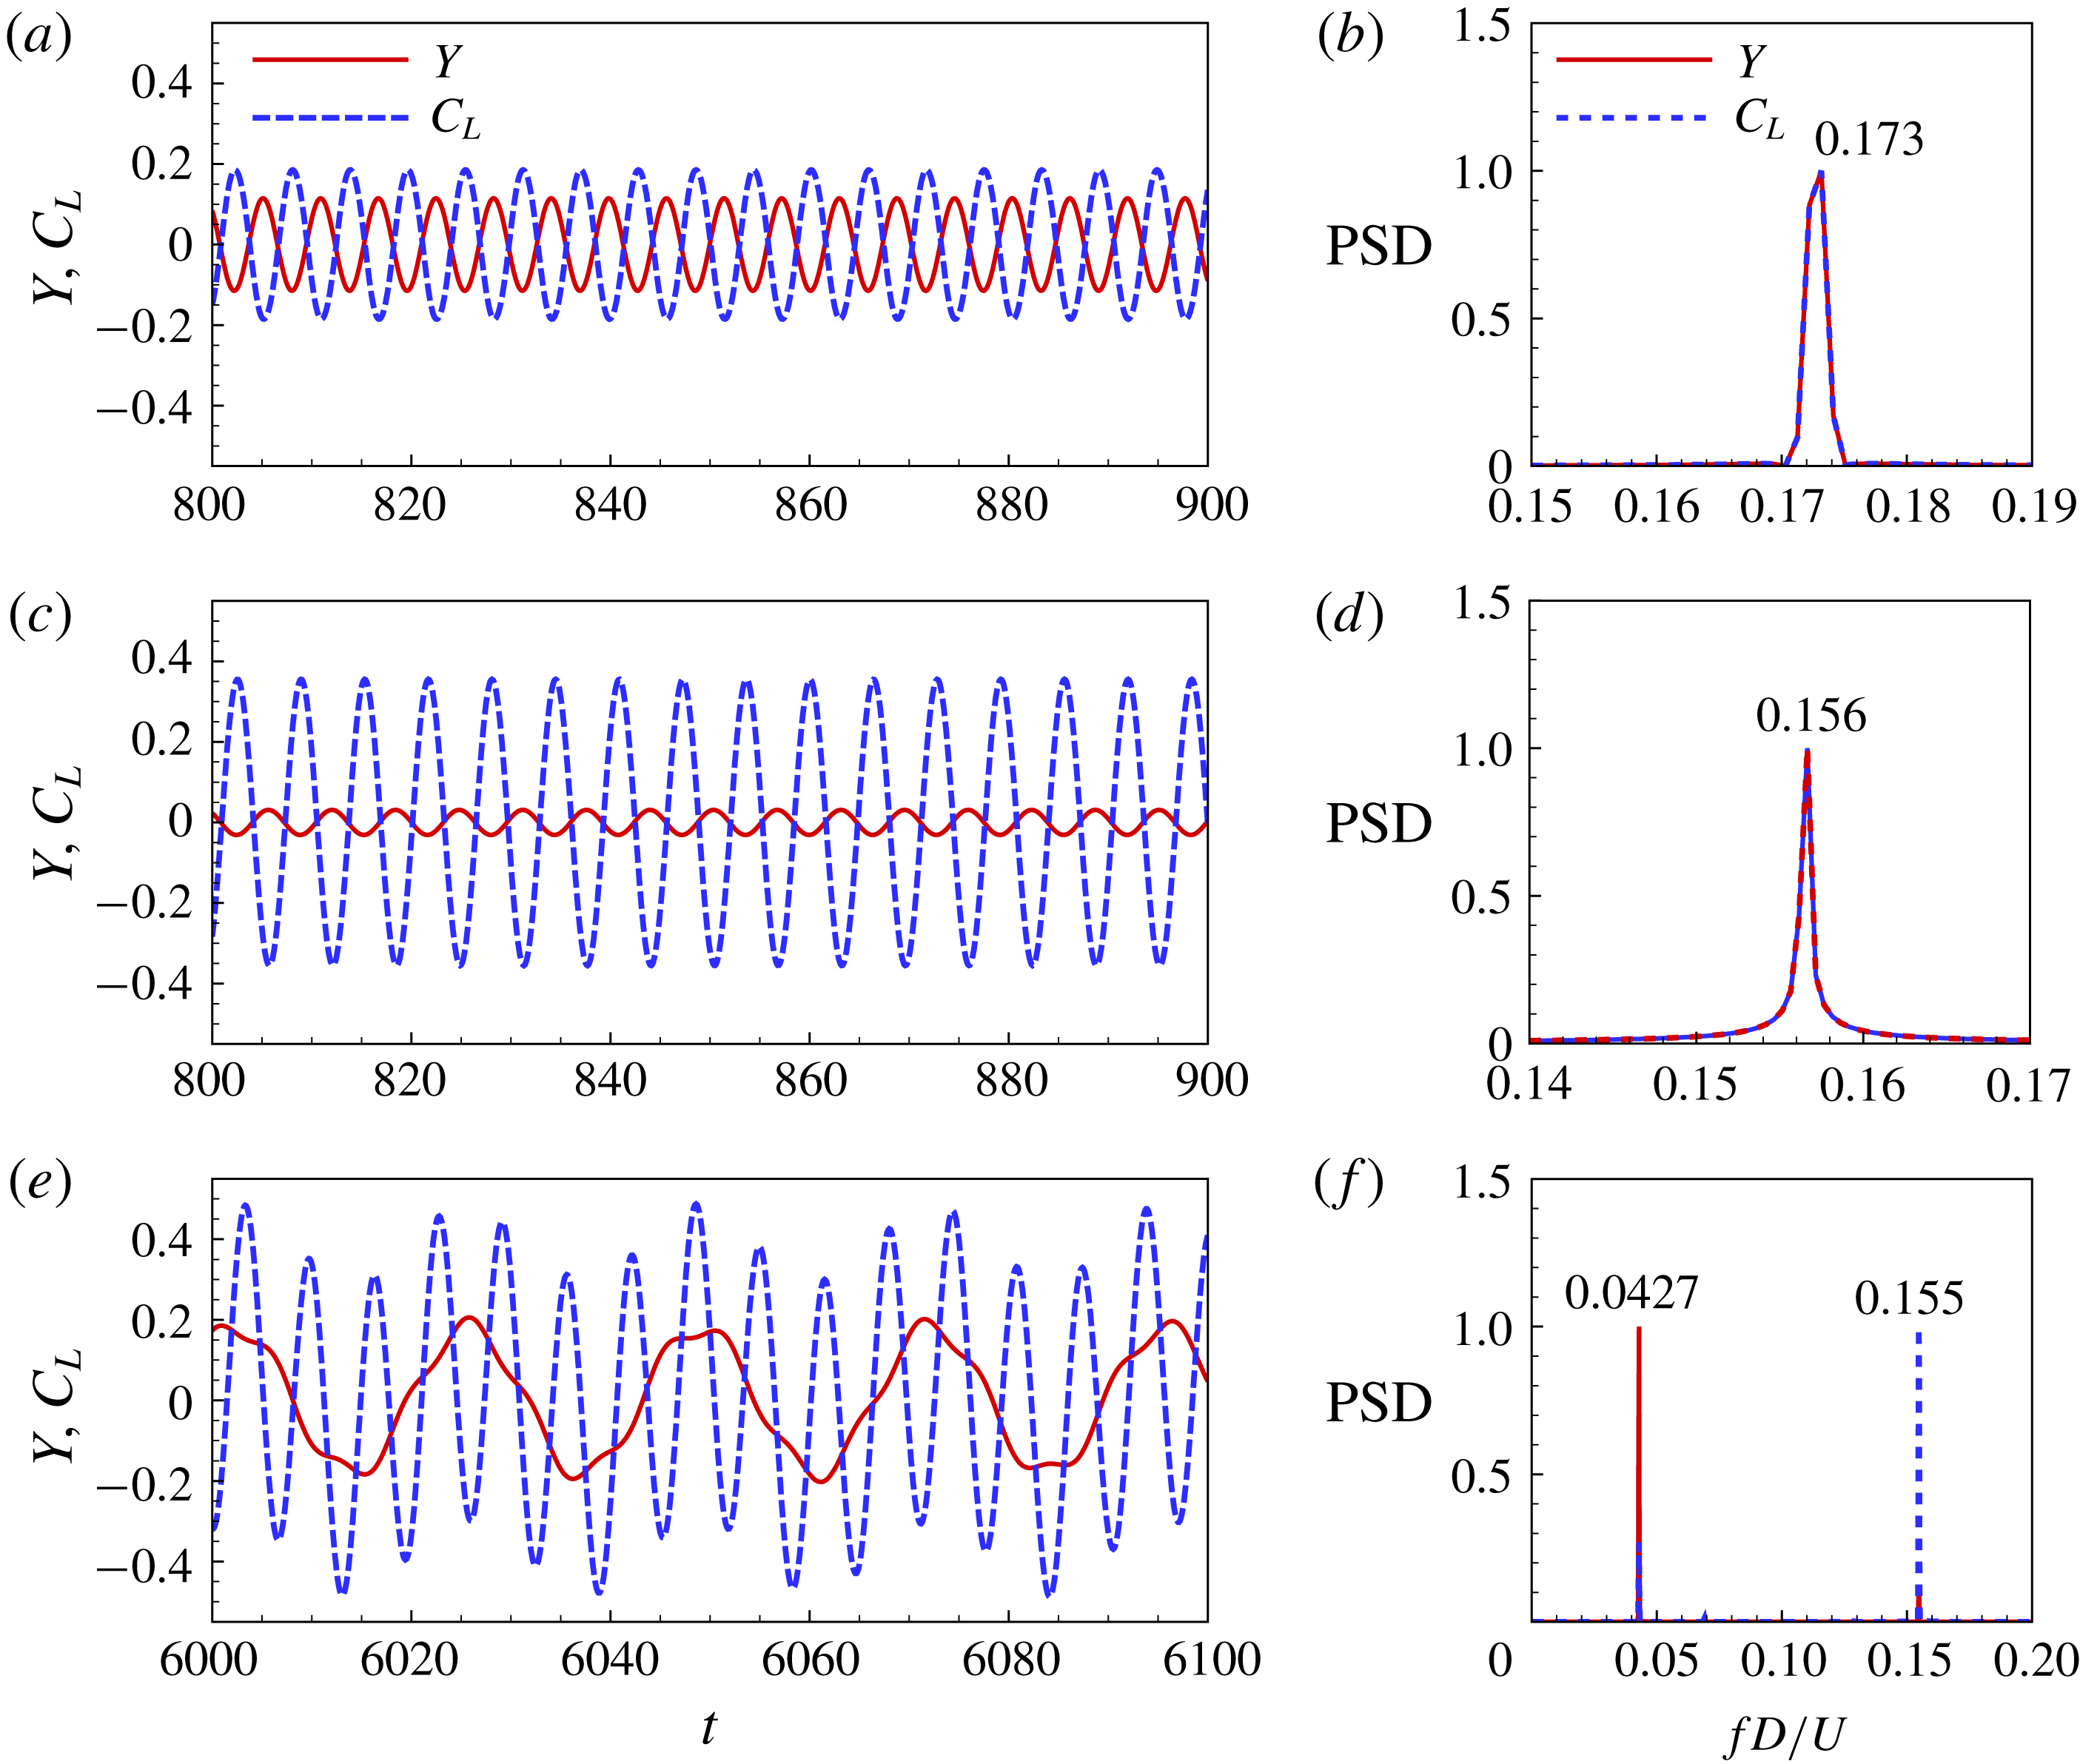
As can be seen from figures 10(c) and 11(a–d), in the VIV region, the dominant frequencies of vortex shedding and cylinder vibration are always identical. In a very narrow region
 $5.75\leqslant U^{\ast }\leqslant 6.5$
, they are both synchronized with the natural frequency of the structure, i.e. the classical lock-in phenomenon occurs. Outside the lock-in region, the vibration frequency and the vortex-shedding frequency for VIV are nearly equal to the vortex-shedding frequency of a stationary square cylinder. In the galloping branch, the dominant frequencies of vortex shedding and cylinder vibration are not synchronized but become well separated. A typical response for galloping is presented in figure 11(e). From the PSD results in figure 11(f), we can see that both the fluctuating lift and vibration displacement contain two distinct frequency components, which correspond to the natural frequency of the structure and the vortex-shedding frequency of a stationary square cylinder, respectively. The dominant vibration frequency is close to, but slightly lower than the structural natural frequency in vacuum (
 $F_{y}/F_{s}\approx 0.83$
), while the dominant vortex-shedding frequency is consistent with the vortex-shedding frequency of a stationary square cylinder. The difference between the vibration frequency and the natural frequency of the structure is attributed to the added mass effect. According to Khalak & Williamson (Reference Khalak and Williamson1999), the effective added mass coefficient for a freely vibrating cylinder can be represented by
 $$\begin{eqnarray}C_{EA}=\frac{1}{2\unicode[STIX]{x03C0}^{3}}\frac{C_{L}^{\prime }\cos \unicode[STIX]{x1D719}}{A_{y}^{\prime }}\left[\frac{U_{\infty }}{f_{s}D}\right]^{2},\end{eqnarray}$$
where
 $C_{L}^{\prime }$
is the lift coefficient amplitude,
 $A_{y}^{\prime }$
is the oscillation amplitude and
 $\unicode[STIX]{x1D719}$
is the phase angle between the lift coefficient and transverse displacement at the dominant oscillation frequency. These values can be obtained by standard Fourier analysis using the numerical simulation data. When
 $C_{EA}$
is evaluated, the structural natural frequency with consideration of added mass effect can be given as
 $$\begin{eqnarray}F_{sa}=\sqrt{\frac{m^{\ast }}{m^{\ast }+C_{EA}}}\cdot F_{s}.\end{eqnarray}$$
Figure 12 shows the variation of
 $C_{EA}$
and the modified frequency ratio
 $F_{y}/F_{sa}$
with
 $U^{\ast }$
in the galloping regime. As can be seen, the effective added mass coefficient measured from numerical results remains around 3.3, which is close to the value of 3.5 reported in Joly et al. (Reference Joly, Etienne and Pelletier2012) for a freely oscillating square cylinder at
 $Re=200$
. From figure 12(b), we can see that the dominant vibration frequency of the cylinder matches exactly the natural frequency of the structure when the effective added mass is considered. The above analysis indicates that, for galloping responses, the structure vibration and the vortex shedding are basically decoupled, and they only interfere with each other by means of forced excitation.
(a) Effective added mass coefficient
 $C_{EA}$
and (b) modified frequency ratio
 $F_{y}/F_{sa}$
as a function of
 $U^{\ast }$
for
 $(Re,m^{\ast })=(150,10)$
in the galloping regime.

The amplitude of the lift coefficient is closely related to the phase angle between
 $C_{L}$
and
 $Y$
, as demonstrated in figure 10(b,d). The phase angle jumps suddenly from
 $0^{\circ }$
to
 $180^{\circ }$
in the lock-in region around
 $U^{\ast }=5.75$
, where
 $C_{L}^{max}$
achieves the minimum value. This phenomenon has also been observed in the experimental study of Khalak & Williamson (Reference Khalak and Williamson1999). They indicated that the phase change through resonance is matched by a switch in the timing of vortex shedding. After the phase transition point,
 $C_{L}^{max}$
increases gradually with increasing
 $U^{\ast }$
. However, the phase angle undergoes an abrupt change again from
 $180^{\circ }$
to
 $0^{\circ }$
around
 $U^{\ast }=17$
due to the occurrence of galloping instability. As evident from figure 11(e), during galloping, the low-frequency oscillation of
 $C_{L}$
is in phase with the vibration of the cylinder. Besides, the amplitude of the lift coefficient
 $C_{L}^{max}$
experiences a relatively small increase near the galloping onset.
4.3 Wake pattern
Figures 13 and 14 show the vorticity fields at typical reduced velocities for VIV (
 $U^{\ast }=6$
and
 $U^{\ast }=10$
) and galloping (
 $U^{\ast }=20$
), respectively. The classical terminology of Williamson & Roshko (Reference Williamson and Roshko1988) is employed to identify the wake patterns. As can be seen, for VIV responses, all the wakes present as the 2S mode (two single vortices shed during a vibration cycle). For the galloping response, the wake characteristics have no essential difference with those of VIV. However, because the vibration frequency of the cylinder is much lower than the vortex-shedding frequency, there are multiple vortex-shedding cycles during a single vibration period. Within one cycle of oscillation, the vortex-shedding structures in different vortex-shedding periods are very similar to each other. We refer to this kind of wake pattern as N(2S) mode with
 $\text{N}=F_{vs}/F_{y}$
, where
 $F_{vs}$
is the vortex-shedding frequency and
 $F_{y}$
is the vibration frequency of the square cylinder. As shown in figure 14(a), for the case of
 $U^{\ast }=20$
, N equals to 4, approximately. Thus, the wake for
 $U^{\ast }=20$
is referred to as the 4(2S) mode.
5 Mechanism of galloping
The aim of the present study is to reveal the underlying mechanisms of galloping. With this purpose in mind, LSA of the fluid–structure interaction system is carried out in this section using the ROM-based linear dynamic model constructed in § 3. Direct numerical simulations are also performed to validate the results of LSA. First, a classification of the eigenmodes is presented based on their frequency characteristics. Second, the primary causes that lead to the unique features of galloping are discussed. Third, the mode competition mechanism is explored and its impact on the galloping responses is elaborated. Lastly, the effects of
 $Re$
and
 $m^{\ast }$
on the dynamics of galloping are investigated.
Typical vorticity fields for VIV of a square cylinder at
 $(Re,m^{\ast })=(150,10)$
: (a)
 $U^{\ast }=6$
, (b)
 $U^{\ast }=10$
. Both the two wakes behave as 2S mode.

Instantaneous vorticity fields of a representative galloping response during one vibration cycle for
 $(Re,m^{\ast })=(150,10)$
at
 $U^{\ast }=20$
. There are nearly four vortex-shedding cycles during a vibration period. Thus, the wake is referred to as the 4(2S) mode.

5.1 Clarification of modes
In the earlier studies on LSA for VIV of bluff bodies (Cossu & Morino Reference Cossu and Morino2000; Meliga & Chomaz Reference Meliga and Chomaz2011), the eigenmodes of coupled systems were classified based on their characteristics in the limit of very large mass ratios, wherein the fluid–structure coupling effect is very weak. The strength of fluid–structure coupling increases with the decrease of mass ratio (Yao & Jaiman Reference Yao and Jaiman2017). It is demonstrated that for large
 $m^{\ast }$
, the two leading modes are absolutely distinct for all
 $U^{\ast }$
, i.e. the two modes are decoupled. Cossu & Morino (Reference Cossu and Morino2000) referred to these two modes as the ‘nearly’ structure mode and the von Kármán mode, and subsequently Meliga & Chomaz (Reference Meliga and Chomaz2011) renamed them the structure mode (SM) and the wake mode (WM), respectively. The frequency of the SM is close to the natural frequency of the structure, while the eigenvalue of the WM tends to the leading eigenvalue of the flow past a stationary cylinder. However, for sufficiently low
 $m^{\ast }$
, the two leading modes may transform into mixed or coupled modes (Zhang et al.
Reference Zhang, Li, Ye and Jiang2015a
; Navrose & Mittal Reference Mittal2016; Yao & Jaiman Reference Yao and Jaiman2017). They exchange roles in the synchronization region when their eigenfrequencies approach each other. Navrose & Mittal (Reference Mittal2016) defined such coupled modes as fluid-elastic mode I (FEMI) and fluid-elastic mode II (FEMII), respectively. FEMI resembles the WM at low
 $U^{\ast }$
while resembles the SM at large
 $U^{\ast }$
. FEMII does the opposite.
Root loci of the coupled system as a function of
 $U^{\ast }$
for
 $Re=150$
at two representative mass ratios: (a)
 $m^{\ast }=10$
and (b)
 $m^{\ast }=50$
.

To classify the eigenmodes of the present FIV system, a systematic analysis is conducted by tracking the eigenvalues of the linear coupled model for a range of
 $U^{\ast }$
, while maintaining
 $Re$
and
 $m^{\ast }$
fixed. Figure 15 presents the eigenvalues of the three leading modes of the coupled system for
 $Re=150$
at two typical mass ratios,
 $m^{\ast }=10$
and
 $m^{\ast }=50$
. The corresponding growth rates and frequencies of the eigenmodes as a function of
 $U^{\ast }$
are plotted in figure 16. It can be seen that, for a relatively large mass ratio,
 $m^{\ast }=50$
, the three modes are well decoupled. According to their frequency characteristics, we define them as the wake mode I (WM-I), wake mode II (WM-II) and structure mode (SM), respectively. WM-I and WM-II tend to the leading eigenvalues of the flow past a stationary square cylinder, respectively. The modes responsible for the global instability of the fluid-only system are denoted as the stationary modes, marked by red diamonds in figure 15. On the other hand, the eigenfrequency ratio of the SM is almost constant and equals unity throughout the
 $U^{\ast }$
investigated (figure 16
d). This implies that the frequency of the SM follows the natural frequency of the structure. For a relatively low
 $m^{\ast }=10$
, the leading mode remains unchanged, still behaves as WM-I. However, the second and the third modes are coupled and exchange roles in the process of increasing
 $U^{\ast }$
. This is clearly demonstrated in figure 16(c) where the frequencies of the eigenmodes are plotted against
 $U^{\ast }$
, frequency transition of the two modes occurs when their eigenfrequencies get close to each other in the range
 $7\leqslant U^{\ast }\leqslant 9$
. Thus, they cannot be simply classified as SM or WM-II. In this study, we define them as coupled mode I (CM-I) and coupled mode II (CM-II), respectively. CM-I acts as the WM-II at low
 $U^{\ast }$
but acts as the SM at large
 $U^{\ast }$
. On the contrary, CM-II acts as the SM at low
 $U^{\ast }$
while acts as the WM-II at large
 $U^{\ast }$
.
Growth rates
 $\unicode[STIX]{x1D706}_{r}$
and frequency ratios
 $F_{LSA}^{\ast }$
of the eigenmodes as a function of
 $U^{\ast }$
for (a,c)
 $m^{\ast }=10$
and (b,d)
 $m^{\ast }=50$
. The eigenfrequency ratio is defined as
 $F_{LSA}^{\ast }=\unicode[STIX]{x1D706}_{i}/(2\unicode[STIX]{x03C0}F_{s})$
.

It is worth noting that, for
 $m^{\ast }=10$
, the eigenfrequency ratio of CM-I for
 $U^{\ast }>U_{c}^{\ast }$
(in this region, CM-I behaves as SM) deviates considerably from unity due to the added mass effect (figure 16
c), as discussed in § 4.2. Besides, the results from the two typical mass ratios indicate that there exists a critical mass ratio, below which the two distinct modes develop into mixed modes. For
 $Re=150$
, the critical mass ratio is
 $m_{cr}^{\ast }=32$
, approximately.
5.2 Primary cause of galloping
The mechanisms underlying galloping are investigated in this section from the perspective of linear dynamics. As can be seen from figure 15, the leading fluid mode WM-I is located in the right half of the complex plane and is therefore always unstable. It is in the shape of a ring, accumulating around the leading eigenvalue of the flow past a stationary square cylinder, and is almost unaffected by
 $U^{\ast }$
and
 $m^{\ast }$
. This implies that its coupling with SM is very weak, which explains why the oscillation of the structure and the vortex shedding in the wake are essentially decoupled during the galloping. In contrast, the SM has a relatively strong coupling with the second fluid mode WM-II. For
 $m^{\ast }=50$
, the eigenvalue of SM gradually moves downwards and approaches that of WM-II as the
 $U^{\ast }$
increases. In this process, the coupling between SM and WM-II is enhanced. The two modes first attract and then repel each other in the interference region. Importantly, due to the repelling effect, the SM becomes unstable beyond a critical reduced velocity
 $U_{c}^{\ast }=9.54$
. For
 $m^{\ast }=10$
, the coupling between SM and WM-II becomes stronger, which ultimately leads to the mode transition phenomenon. The two distinct modes change into coupled modes as CM-I and CM-II, respectively. CM-II is always stable while CM-I becomes unstable beyond
 $U_{c}^{\ast }=7.85$
. Since CM-I practically behaves as SM in the whole unstable region
 $U^{\ast }>U_{c}^{\ast }$
, and to give a more comprehensible explanation, we use SM instead of CM-I for further discussion of the galloping mechanism in the following parts of this paper. We suppose that the instability of SM may be closely related to the occurrence of galloping-type oscillation.
Flow-induced vibration of a square cylinder at
 $(Re,m^{\ast })=(150,10)$
: (a) transverse vibration amplitude obtained from CFD/CSD simulations, (b) growth rates and (c) eigenfrequencies of the leading three unstable modes obtained from LSA. The dominant vibration frequency (black solid squares) and vortex-shedding frequency (red hollow circles) in the saturated state obtained from CFD/CSD simulations are also plotted in (c) for comparison. The frequencies are normalized by the reduced natural frequency of the structure
 $F_{s}$
.
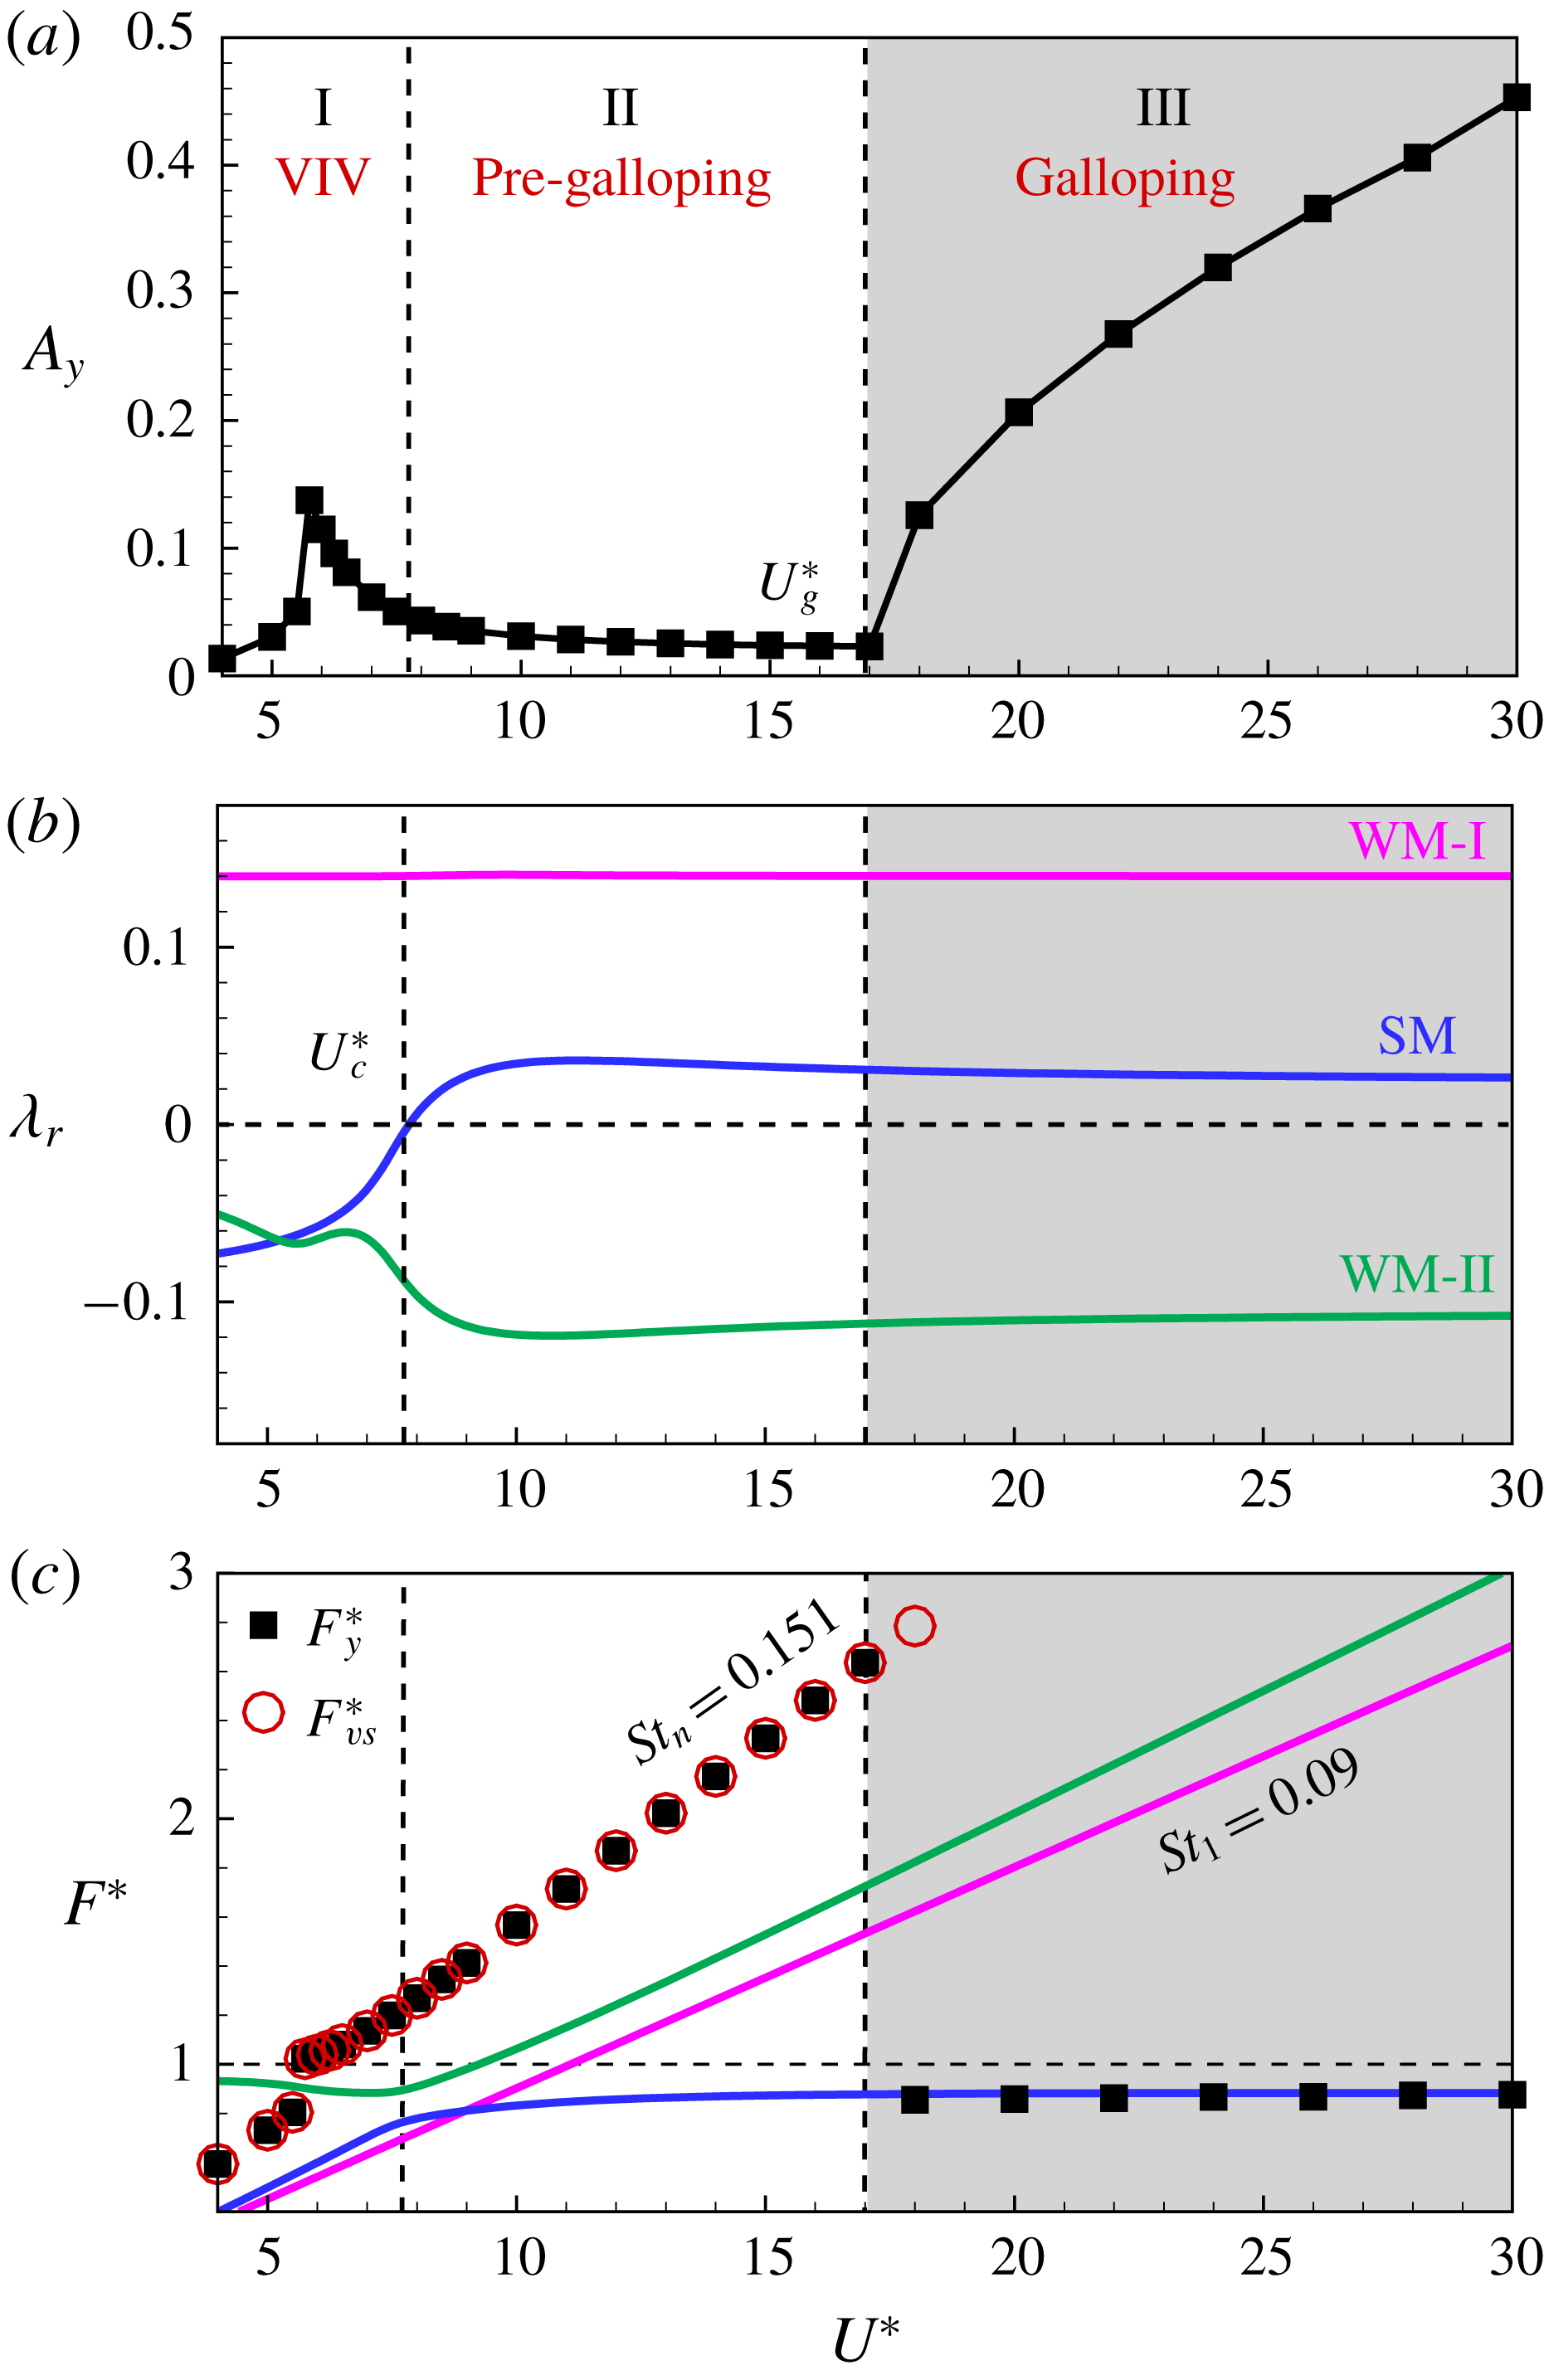
To verify this conjecture, a comparative study between the results from LSA and CFD/CSD simulations is conducted;
 $(Re,m^{\ast })=(150,10)$
is selected as a representative case to explore the inherent dynamics of galloping. Figure 17(a) illustrates the vibration amplitude of the square cylinder obtained from numerical simulations; figure 17(b,c) presents the growth rates and eigenfrequencies of the leading unstable modes analysed by LSA, as a function of
 $U^{\ast }$
. The vibration frequency of the cylinder and the vortex-shedding frequency in the nonlinear saturation state obtained from CFD/CSD simulations are also plotted in figure 17(c) for comparison. The frequencies are all normalized by the structural natural frequency
 $F_{s}$
. As can be seen, the response range can be divided into three regimes (marked by I, II and III in the figure) by two critical reduced velocities, i.e. the instability onset of SM (
 $U_{c}^{\ast }$
) obtained from LSA and the critical threshold of galloping (
 $U_{g}^{\ast }$
) acquired from direct numerical simulations. The FIV responses corresponding to the three regimes are VIV, pre-galloping and galloping, respectively. In essence, the pre-galloping regime also belongs to VIV. As will be discussed later, we use the term ‘pre-galloping’ primarily to denote the regime where the SM is unstable but galloping does not occur.
In regime I, only the leading fluid mode WM-I is unstable, the response of the coupled system is dominated by vortex-excited resonance and no coupled-mode flutter occurs, which is consistent with the LSA results of Yao & Jaiman (Reference Yao and Jaiman2017). As a consequence, the square cylinder only shows large-amplitude vibrations in a quite narrow lock-in region. During lock-in, the vibration frequency as well as the vortex-shedding frequency is synchronized with the structural natural frequency. Outside the lock-in region, both the cylinder vibration frequency and the vortex-shedding frequency coincide with the vortex shedding frequency of a stationary square cylinder. The response behaves as a forced vibration under the effect of unsteady vortex shedding. It is worth noting that the eigenfrequency of WM-I (
 $F_{WM-I}=St_{l}=0.09$
) deviates substantially from the nonlinear vortex-shedding frequency (
 $St_{n}=0.151$
), as shown in figure 17(c). This is because the linear model can only predict the characteristic frequency of the wake in the vicinity of the critical
 $Re$
, but fails to capture the frequency for
 $Re$
far away from the critical point, where the vortex-shedding frequency is strongly modulated by nonlinear effects (Barkley Reference Barkley2006). For the present case, the selected
 $Re=150$
is far from the critical Reynolds number of a square cylinder
 $Re_{cr}=45.2$
.
In regime III, both the WM-I and SM are unstable. It is well known that the instability of SM is an important feature of flutter, and flutter often leads to larger vibration amplitude of the structure than that induced by vortex-excited resonance (Zhang et al.
Reference Zhang, Li, Ye and Jiang2015a
). As expected, the vibration amplitude of the cylinder increases monotonically with increasing
 $U^{\ast }$
in this regime. Very importantly, the dominant vibration frequency of the square cylinder exactly matches the eigenfrequency of SM during the galloping, as demonstrated in figure 17(c). This confirms that the instability of SM is the primary cause of galloping-type oscillation. In other words, the instability of SM is a necessary condition for the occurrence of galloping. On the other hand, the dominant frequency of vortex shedding still follows the Strouhal law and is close to the vortex shedding frequency of a fixed square cylinder with a value of 0.151. The variation trend of vortex-shedding frequency ratio is qualitatively consistent with that of WM-I with regard to
 $U^{\ast }$
. Thus, it can be inferred that the high-frequency vortex shedding in the cylinder wake is induced by the leading fluid mode WM-I. As discussed previously, the essential nature of decoupling between the low-frequency vibration and the high-frequency vortex shedding during galloping is owing to the weak coupling between SM and WM-I.
In regime II, the SM is also unstable. However, numerical simulation results indicate that the FIV response in this regime is still dominated by VIV with no galloping-type oscillation. As can be seen from figure 17, the critical reduced velocity of galloping predicted by LSA (
 $U_{c}^{\ast }=7.85$
) is much lower than that calculated by direct CFD/CSD simulation method (
 $U_{g}^{\ast }=17.0$
). This means that the linear dynamic model significantly underestimates the onset reduced velocity of galloping. In the next section, we try to reveal the fundamental reason for this discrepancy from the perspective of nonlinear competition between the SM and the leading fluid mode WM-I.
5.3 Mode competition mechanism
Two important and interesting questions arise from the former results: for the case of more than one eigenmode being linearly unstable, how do the unstable modes interact with each other? And which one will dominate the final response?
Zhang et al. (Reference Zhang, Li, Ye and Jiang2015a ) investigated the underlying mechanism of VIV lock-in through LSA and direct numerical simulation. They reported that in the flutter-induced lock-in region, the SM and WM are both unstable, and the essential characteristic of flutter is the competition between the two unstable modes. It was found that, in the initial development stage of numerical simulation, the two modes co-exist. However, as the vibration amplitude increases, the SM gradually dominates the dynamics of the coupled system and locks the WM, causing the vortex-shedding frequency to be locked onto the structural natural frequency.
Inspired by previous work, in this section, we attempt to uncover the interaction mechanism between SM and WM-I by means of direct numerical simulations. To study the evolution and development of the unstable modes (SM and WM-I), the simulations were initiated from the equilibrium state (steady-state base flow with zero displacement and zero velocity of the cylinder). In this way, we can acquire more dynamical information of the coupled system, especially for the mode competition process.
(a) Evolution process of the transverse displacement
 $Y$
of the square cylinder with time for
 $(Re,m^{\ast })=(150,10)$
at
 $U^{\ast }=10$
. (b,c) Illustrate the PSD results at different time stages. The simulation is initiated from the equilibrium steady state.

Figures 18 and 20 show the representative time histories of cylinder displacement for regimes II and III, respectively, as well as the corresponding PSD results at different time stages. The case of
 $U^{\ast }=10$
belongs to regime II (pre-galloping) while the case of
 $U^{\ast }=20$
belongs to regime III (galloping). As can be seen, for
 $U^{\ast }=10$
, in the initial stage of development
 $200<t<340$
, the response amplitude does not increase exponentially, but exhibits uneven features, which indicates that there are multiple frequency components at this stage. This is evident from the PSD analysis result shown in figure 18(b), wherein the spectrum has two peak frequencies corresponding to WM-I and SM, respectively. Therefore, it confirms the LSA results: both the WM-I and SM are linearly unstable in regime II. However, as time goes on, WM-I quickly reaches the nonlinear saturation state, and the wake flow is gradually dominated by nonlinear dynamics. In the nonlinear stage, rigorous competition between WM-I and SM is observed because the frequencies of the two unstable modes are very close to each other (
 $F_{WM-I}/F_{SM}=1.08$
). As a result, the SM is locked by the WM-I during the nonlinear mode competition. It can be seen from figure 18 that, over time, the SM gradually disappears and the response is ultimately dominated by WM-I. The process of mode competition is more clearly shown in figure 19 where the time–frequency spectrum of the cylinder displacement is presented. The time–frequency spectrum is achieved using continuous wavelet transforms (CWT), which can provide an insight into the temporal evolution of the frequency content (Zhao et al.
Reference Zhao, Nemes, Jacono and Sheridan2018). In this work, the Morlet wavelet was employed for CWT analysis. As can be seen, in the linear stage, the intensity of both unstable modes increases gradually with time. However, when the nonlinearity occurs the intensity of SM progressively decreases and eventually disappears during the competition with WM-I. The above analysis explains why galloping is not observed in regime II even though the SM is unstable.
Time–frequency spectrum of the transverse displacement based on CWT for
 $(Re,m^{\ast })=(150,10)$
at
 $U^{\ast }=10$
.

(a) Evolution process of the transverse displacement
 $Y$
of the square cylinder with time for
 $(Re,m^{\ast })=(150,10)$
at
 $U^{\ast }=20$
. (b–d) Illustrate the PSD results at different time stages. The simulation is initiated from the equilibrium steady state.

This kind of mode lock-in is different from the one observed in coupled-mode flutter of VIV reported in Zhang et al. (Reference Zhang, Li, Ye and Jiang2015a
). For coupled-mode flutter, the WM and SM are both unstable and their eigenfrequencies are also very close (
 $0.75<F_{WM}/F_{SM}<0.95$
). But, eventually, it is the SM that locks the WM in the nonlinear competition, resulting in the classical frequency lock-in phenomenon. However, for the present case in the pre-galloping region (
 $1.06<F_{WM-I}/F_{SM}<1.75$
), it is the leading fluid mode WM-I that wins the competition and finally locks the SM. Consequently, the structure response in regime II exhibits as vortex-excited forced vibration and the galloping-type oscillation is suppressed. In other words, the onset
 $U^{\ast }$
of galloping is postponed. Table 2 compares the two mode lock-in phenomena and summarizes the underlying physical principles. As can be seen, for both cases, it is the higher-frequency mode that finally wins the competition. Navrose & Mittal (Reference Mittal2016) examined the mode lock-in phenomenon from the energy transfer viewpoint. They showed that the energy transfer coefficient of SM is larger than that of WM in the flutter regime of VIV. As a result, the SM ultimately drives the response of the coupled system towards lock-in.
Phenomenon and principle for mode competition in flutter of VIV of a circular cylinder (Zhang et al. Reference Zhang, Li, Ye and Jiang2015a ) and in pre-galloping of a square cylinder (present study). For both cases, the mode with higher frequency finally wins the competition.

To gain more quantitative insight into the mode competition mechanism, we estimated the energy transfer coefficients
 $E_{c}$
of the leading unstable modes by the ROM-based FSI model (see the derivation in appendix A). The energy transfer coefficient denotes the non-dimensional energy transfer over one period of cylinder oscillation from the fluid to the structure that excludes the exponential growth/decay. It is a function of
 $(m^{\ast },\unicode[STIX]{x1D706})$
and can be written as
 $$\begin{eqnarray}E_{c}=2\unicode[STIX]{x03C0}^{2}{\hat{Y}}^{2}m^{\ast }\unicode[STIX]{x1D706}_{r}\unicode[STIX]{x1D706}_{i},\end{eqnarray}$$
where
 ${\hat{Y}}$
represents the magnitude of the eigenmode for the structural part. The expression shows that the sign of
 $E_{c}$
is determined by the sign of the real part of eigenvalue (
 $\unicode[STIX]{x1D706}_{r}$
). Therefore,
 $E_{c}$
is positive for unstable modes while negative for stable modes. It is also noted that
 $E_{c}$
is directly proportional to the real and imaginary parts of the eigenmode. This means that the mode with larger growth rate and higher frequency is generally associated with a larger energy transfer coefficient. Figure 22 shows the energy transfer coefficients of the three leading modes as a function of
 $U^{\ast }$
for
 $(Re,m^{\ast })=(150,10)$
. It can be seen that
 $E_{c}$
of WM-I is always larger than that of SM in the whole unstable region. Thus, WM-I is expected to dominate the temporal evolution of cylinder displacement in the pre-galloping region when strong mode competition occurs.
For the case of a larger reduced velocity
 $U^{\ast }=20$
(figure 20), since the frequency of SM departs too far from that of WM-I (
 $F_{WM-I}/F_{SM}=2.04$
), the competition between the two unstable modes becomes weaker and no mode lock-in can happen. As a result, the two modes coexist all the time and act in a nearly decoupled manner to contribute to the response of the fluid–structure system. Because the growth rate of WM-I is much larger than that of SM (figure 17
b), the developing process of galloping contains two interesting stages, as illustrated in figure 20(a). In the first stage, WM-I develops rapidly and quickly reaches the nonlinear saturation state. At this time stage, the contribution of SM to the coupled system is very weak and has not been clearly reflected in the response. The second stage of growth in the vibration amplitude is contributed by SM. For that the growth rate of SM is quite small, the response takes a very long time to reach the final nonlinear saturation state (quasi-periodic oscillation state). Figure 21 presents the time–frequency spectrum of the cylinder displacement for
 $U^{\ast }=20$
. As can be seen, during the entire development process, the frequency spectrum contains two distinct frequency components, corresponding to WM-I and SM, respectively. It is worth noting that an intermediate frequency
 $F\approx 0.07$
appears when
 $t>3000$
. The peak power spectrum of this frequency is nearly two orders lower than those of WM-I and SM. Moreover, it has a close relation with the frequencies of WM-I and SM in the saturated state, i.e.
 $F\approx F_{WM-I}-2F_{SM}$
. Hence, the appearance of this frequency component is the result of the nonlinear interaction between the fluid mode and the structure mode.
Time–frequency spectrum of the transverse displacement based on CWT for
 $(Re,m^{\ast })=(150,10)$
at
 $U^{\ast }=20$
.

Variation of energy transfer coefficients of the three leading modes with
 $U^{\ast }$
for
 $(Re,m^{\ast })=(150,10)$
.

To further verify the correctness of the linear model, the growth rates of the unstable modes predicted by LSA are compared with those measured from the time histories of the cylinder displacement in the linear stage, as shown in figure 23. The autoregressive moving-averaging approach (Box, Jenkins & Reinsel Reference Box, Jenkins and Reinsel1994) was employed to recover the growth rates from the calculated time-series data. This method has been shown to be able to correctly estimate the damping ratios of fluid–structure interaction systems (Zhu & So Reference Zhu and So2000; McNamara & Friedmann Reference McNamara and Friedmann2007). As can be seen, the results are in good agreement for all
 $U^{\ast }$
considered, which indicates that the ROM-based FSI model has accurately captured the linear dynamics of the coupled system.
Comparison of the growth rates predicted by LSA and those measured from direct numerical simulations for
 $(Re,m^{\ast })=(150,10)$
at various
 $U^{\ast }$
.

From the above analysis, we know that the instability of SM is the primary cause of the galloping phenomenon. This provides clear evidence that transverse galloping is essentially a kind of single-degree-of-freedom (SDOF) flutter (Nakamura Reference Nakamura1990). As this kind of SDOF flutter occurs at relatively large reduced velocities, the vibration frequency of the structure is far from the natural vortex-shedding frequency (natural vortex-shedding frequency refers to the frequency component which is close to the vortex-shedding frequency of a stationary square cylinder). Hence, the oscillation of the structure is unable to lock the vortex shedding in the wake, resulting in the existence of a high-frequency component in the structure response. Therefore, the high-speed galloping can be understood as a type of SDOF flutter, superimposed by a forced vibration induced by the natural vortex shedding.
5.4 Effect of mass ratio
The numerical study of Joly et al. (Reference Joly, Etienne and Pelletier2012) indicated that when the mass ratio is less than a critical value, the galloping phenomenon will not occur. This interesting phenomenon is also confirmed by the present numerical results, as demonstrated in § 4.1. To determine the critical mass ratio, the variation of oscillation amplitude with
 $m^{\ast }$
at a large
 $U^{\ast }=40$
is investigated, as illustrated in figure 24. It can be seen that, with the decrease of
 $m^{\ast }$
, the vibration amplitude first gradually decreases (
 $m^{\ast }\geqslant 4$
) and then slightly increases (
 $m^{\ast }<4$
). Therefore, the critical mass ratio is
 $m_{cg}^{\ast }=4$
, approximately. Below this value galloping completely disappears and the response of the coupled system is dominated by VIV for all
 $U^{\ast }$
.
Variation of the transverse vibration amplitude with
 $m^{\ast }$
for
 $Re=150$
at a sufficiently large
 $U^{\ast }=40$
.

LSA results for
 $Re=150$
at various
 $m^{\ast }$
: (a) root loci of the coupled system; (b,c) present the growth rate and frequency ratio of CM-I, as a function of
 $U^{\ast }$
. Note that CM-I resembles the SM in the unstable region.

To further understand this phenomenon, we present the root loci as a function of
 $U^{\ast }$
for
 $Re=150$
at various
 $m^{\ast }$
in figure 25. As can be seen, with the decrease of
 $m^{\ast }$
, the growth rate of CM-I increases gradually. Note that CM-I exhibits as the SM in the unstable region for all mass ratios. This means that the SM tends to be more unstable at lower
 $m^{\ast }$
. However, numerical simulation results show that the galloping-type oscillation completely vanishes at sufficiently low
 $m^{\ast }$
conditions. As an example, we show the time evolution of cylinder displacement and the corresponding PSD results for
 $(Re,m^{\ast })=(150,2)$
at a representative
 $U^{\ast }=40$
in figure 26. Similarly, the simulation was initiated from the unstable steady-state base flow with zero initial displacement and velocity of the cylinder. From figure 26(b), we can see that in the early stage, there exist two unstable modes in the response, namely the SM and the WM-I, which is consistent with the LSA results. The two unstable modes develop rapidly and quickly enter the nonlinear stage. The nonlinear mode competition eventually leads to the mode lock-in of SM by WM-I in the whole unstable region
 $U^{\ast }>U_{c}^{\ast }$
, resulting in the disappearance of the galloping phenomenon. This is mainly because, although the instability of SM is intensified at low
 $m^{\ast }$
, the forced vibration effect induced by the natural vortex shedding is also enhanced when the structure is getting lighter.
(a) Evolution process of the transverse displacement
 $Y$
of the square cylinder with time for
 $(Re,m^{\ast })=(150,2)$
at
 $U^{\ast }=40$
. (b,c) Illustrate the corresponding PSD results at different time stages. The simulation is initiated from the equilibrium steady state.

5.5 Effect of Reynolds number
The Reynolds number has a great influence on the FIV response of a square cylinder. As shown in figure 9, for
 $m^{\ast }=10$
, galloping starts to occur when
 $Re>139$
. Below this value, the response is dominated by VIV only. The quasi-steady analyses by Barrero-Gil, Sanz-Andrés & Roura (Reference Barrero-Gil, Sanz-Andrés and Roura2009) and Joly et al. (Reference Joly, Etienne and Pelletier2012) indicated that the
 $Re$
threshold can be determined by using the Den Hartog criterion. The slope of the vertical force coefficient changes sign when the
 $Re$
passes though the critical value. In this section, we further investigate the effect of
 $Re$
on the FIV response of a square cylinder. The intention is to reveal whether mode competition still exists at lower
 $Re$
.
Figure 27 shows the root loci of the coupled system for
 $m^{\ast }=10$
at three typical Reynolds numbers,
 $Re=80$
, 100 and 120. As can be seen, the SM begins to become unstable at large
 $U^{\ast }$
when
 $Re\geqslant 100$
, approximately. However, numerical simulation results suggest that galloping is not observed until
 $Re>139$
. Apparently, the inconsistency is also due to the mode competition mechanism, as discussed previously. A typical case for
 $Re=139$
at a large
 $U^{\ast }=40$
is given in figure 28 to show the mode competition process. Since
 $Re=139$
is very close to the critical Reynolds number, the SM decays very slowly and takes quite a long time to completely vanish.
Root loci of the coupled system as a function of
 $U^{\ast }$
for
 $m^{\ast }=10$
at three representative Reynolds numbers: (a)
 $Re=80$
, (b)
 $Re=100$
and (c)
 $Re=120$
. As can be seen, the SM begins to be unstable at large
 $U^{\ast }$
when
 $Re\geqslant 100$
, approximately.

(a) Evolution process of the transverse displacement
 $Y$
of the square cylinder with time for
 $(Re,m^{\ast })=(139,10)$
at
 $U^{\ast }=40$
. (b,c) Illustrate the corresponding PSD results at different time stages. The simulation is initiated from the equilibrium steady state.

Figure 29 shows the neutral stability curve of the SM analysed by LSA and the onset boundary of galloping acquired from direct numerical simulations in the
 $(Re,U^{\ast })$
plane for
 $m^{\ast }=10$
. It can be seen that the critical reduced velocity predicted by LSA is generally lower than the onset reduced velocity calculated by CFD/CSD simulation method. The grey shaded region between the two critical boundaries indicates the regime where strong mode competition occurs. In this region, both the SM and WM-I are linearly unstable, but the WM-I locks the SM in the nonlinear stage. As a result, the galloping-type oscillation is suppressed and the response is still dominated by VIV in this region.
Neutral stability curve of the SM obtained from LSA (blue squares) and the galloping onset boundary obtained from direct CFD/CSD simulations (dark circles) for
 $m^{\ast }=10$
in the
 $(Re,U^{\ast })$
plane. The plane is divided into three regions: VIV, galloping and pre-galloping (grey shaded).

It should be noted that the critical mass ratio and Reynolds number are determined based on the numerical computations at a large
 $U^{\ast }=40$
. The critical values may slightly change when the test reduced velocity is further increased.
6 Dynamic mode decomposition
From §§ 4 and 5, we know that under high reduced velocities, the galloping vibration and the vortex shedding are basically decoupled. They only interfere with each other by means of forced excitation. Consequently, both the vibration displacement and lift coefficient contain two distinct frequency contents, corresponding to the WM-I and SM respectively. In this section, we use the dynamic mode decomposition (DMD) technique to extract the coherent structures of the wake flow for galloping responses. The objective is to resolve the flow structures relevant to WM-I and SM, respectively.
DMD is an efficient method to capture the dominant flow patterns from an infinite-dimensional linear Koopman approximation of the nonlinear flows (Rowley et al. Reference Rowley, Mezic, Bagheri, Schlatter and Henningson2009; Schmid Reference Schmid2010). The most attractive characteristic of DMD is that each mode it yields corresponds to one eigenvalue with a specific frequency. Therefore, unlike proper orthogonal decomposition method, DMD can provide fluid modes with pure frequency contents. The application of DMD to various types of flows has been well documented in Rowley & Dawson (Reference Rowley and Dawson2017). To accurately capture the dominant modes, an improved mode selection criterion was adopted (Kou & Zhang Reference Kou and Zhang2017). This criterion can take into account the stability and evolution characteristics of dynamic modes through temporal integration of the mode coefficients in the whole sampling space.
The two leading modes analysed by DMD (shown as pressure contours) for
 $(Re,m^{\ast })=(150,10)$
at various
 $U^{\ast }$
: (a,b)
 $U^{\ast }=18$
, (c,d)
 $U^{\ast }=22$
, (e,f)
 $U^{\ast }=26$
and (g,h)
 $U^{\ast }=30$
. (a,c,e,g) Show the first mode and (b,d,f,h) represent the second mode. The first and second modes are referred to as the von Kármán mode and the galloping mode, respectively, according to their frequency characteristics.

Comparisons of (a) the frequency of the first DMD mode with the dominant vortex-shedding frequency and (b) the frequency of the second DMD mode with the dominant frequency of cylinder vibration in the galloping region for
 $(Re,m^{\ast })=(150,10)$
.

The DMD analysis is performed based on the pressure snapshots collected over one vibration cycle in the saturated state. Figure 30 illustrates the leading two DMD modes at various
 $U^{\ast }$
for
 $(Re,m^{\ast })=(150,10)$
. Figure 31 shows the comparison of characteristic frequencies of the two DMD modes with the nonlinear vortex-shedding frequency and the vibration frequency analysed from numerical simulation data. It can be seen that the first DMD mode presents as a typical von Kármán vortex street, and its strength is almost unaffected by
 $U^{\ast }$
. Its frequency is consistent with the vortex-shedding frequency of a static square cylinder, so the first DMD mode is relevant to the vortex shedding past the stationary cylinder. Thus, we refer to this mode as the von Kármán mode. The second DMD mode is induced by the galloping oscillation of the structure. Its scale and frequency are closely related to the vibration amplitude and vibration frequency. With the increase of
 $U^{\ast }$
, the vibration frequency of the structure
 $F_{y}$
decreases inversely. Accordingly, the second DMD mode changes gradually from small-scale high-frequency mode to large-scale low-frequency mode. This is more clearly reflected in the DMD analysis results for
 $(Re,m^{\ast })=(200,10)$
, as shown in figure 32. For this case, the onset speed of galloping is further reduced, which means that the frequency of galloping oscillation can be higher. As can be seen, for
 $U^{\ast }=15$
, there are four pairs of small-scale vortices in the displayed domain. While for
 $U^{\ast }=30$
, only two pairs of large-scale vortices can be formed at this spatial scale. In addition, the frequency of the second DMD mode coincides with the dominant vibration frequency of the cylinder which is close to the natural frequency of the structure. Hence, we refer to this mode as the galloping mode.
The two leading modes analysed by DMD (shown as pressure contours) for
 $(Re,m^{\ast })=(200,10)$
at various
 $U^{\ast }$
: (a,b)
 $U^{\ast }=15$
, (c,d)
 $U^{\ast }=20$
, (e,f)
 $U^{\ast }=25$
and (g,h)
 $U^{\ast }=30$
. (a,c,e,g) Show the first mode and (b,d,f,h) represent the second mode. The first and second modes are referred to as the von Kármán mode and the galloping mode, respectively, according to their frequency characteristics.

The above analysis provides further evidence that the vortex shedding in the cylinder wake and the galloping oscillation of structure are indeed decoupled, and their mutual interference is very weak. This is consistent with the linear stability analysis results: both the SM and the WM-I are unstable, and they contribute jointly to the response of the fluid–structure interaction system. The instability of SM leads to the occurrence of galloping, while the instability of WM-I results in the high-frequency vortex shedding. Although the two modes are basically decoupled, they in turn interfere with each other in a forced vibration manner. The natural vortex shedding acts as a forced excitation on the structure, leading to a high-frequency component in the structure response; while the low-frequency oscillation of the structure acts as a forced perturbation to the flow, resulting in a low-frequency large-scale vortex-shedding mode in the wake.
7 Conclusion
In this study, the mechanisms underlying the galloping of a square cylinder are investigated in the laminar flow regime. Linear stability analysis and direct numerical simulations are performed. The LSA results show that, due to the fluid–structure coupling effect, the SM becomes unstable at relatively large
 $U^{\ast }$
at certain
 $(Re,m^{\ast })$
combinations. The instability of SM is the primary cause of the galloping phenomenon since the vibration frequency of the cylinder is identical to the eigenfrequency of SM during galloping. However, the critical onset of galloping depends highly on the nonlinear competition between the SM and the leading fluid mode WM-I. The instability onset of SM predicted by LSA (
 $U_{c}^{\ast }$
) is considerably lower than the critical threshold of galloping (
 $U_{g}^{\ast }$
) obtained from numerical simulations. For
 $U_{c}^{\ast }<U^{\ast }<U_{g}^{\ast }$
, the SM and WM are both unstable, and their eigenfrequencies are very close. This results in strong competition between the two modes in the nonlinear stage. The simulation results indicate that WM-I quickly reaches the nonlinear saturation state and then locks the SM during the competition, thereby postponing the occurrence of galloping. For
 $U^{\ast }>U_{g}^{\ast }$
, the frequencies of the two unstable modes are far apart from each other. Thus, no mode lock-in could happen. Consequently, the two unstable modes co-exist in the whole evolution process and contribute jointly to the galloping response. The instability of SM leads to the low-frequency galloping vibration of the structure, while the unstable WM-I results in the high-frequency vortex shedding in the wake. Some specific conclusions can be summarized as follows:
(i) Transverse galloping of a square cylinder at low
 $Re$
can be understood as a kind of single-degree-of-freedom flutter induced by the unstable SM, superimposed by a forced vibration induced by the natural vortex shedding in the wake. The natural vortex shedding is closely related to the leading fluid mode WM-I. In short, transverse galloping = SDOF flutter + forced vibration.
(ii) Strong mode competition occurs when the frequencies of unstable modes approach each other. In the pre-galloping region, WM-I wins the competition and locks the SM, leading to the absence of galloping oscillation in this regime. Accordingly, the galloping onset is delayed. Moreover, due to the mode competition mechanism, the natural vortex shedding can completely suppress the galloping-type instability at relatively low
$Re$
and low
$m^{\ast }$
conditions.(iii) For galloping at large
$U^{\ast }$
, the structure oscillation and the vortex shedding are inherently decoupled. This is mainly due to the weak coupling between WM-I and SM. The wake vortices shed alternately at a relatively high frequency close to the vortex-shedding frequency of a stationary square cylinder, while the structure oscillates at a relatively low frequency close to the natural frequency of the structure. DMD successfully reveals the flow structures corresponding to WM-I and SM, which are referred to as the von Kármán mode and the galloping mode, respectively.


In summary, LSA based on unsteady ROMs can efficiently reveal the unstable modes of the coupled fluid–structure system, which are the essential origins of various kind of complex FSI phenomena. However, beyond the linear growth stage, the evolution of unstable modes is severely affected by nonlinearity. The ultimate response is determined by the nonlinear competition between the unstable modes. With the help of CWT technique, direct numerical simulation initiated from the equilibrium state to the final saturated limit-cycle oscillation is an effective tool to resolve the mode competition process. The novel insights into the underlying mode competition mechanism are helpful to building reasonable and effective unsteady analytical models for galloping.
It is worth noting that the present galloping responses at low
 $Re$
have many characteristics in common with those obtained from experiments at high
 $Re$
, such as the ‘build-up’ behaviour of vibration amplitude and the mismatch of frequency between vortex shedding and body oscillation. This implies that the induced mechanism of galloping might be similar for both flow conditions. However, at high
 $Re$
, the topology of vortex shedding is quite different from that in the laminar flow regime due to the effects of turbulence and three-dimensionality. As a result, the interference between VIV and galloping is more complex. As discussed in Païdoussis et al. (Reference Païdoussis, Price and de Langre2010), for systems with only moderate mass-damping parameters, where
 $U_{g}^{\ast }$
predicted by the quasi-steady model is slightly larger or lower than the vortex-resonance speed
 $U_{r}^{\ast }$
, experimental observations show that galloping always starts at
 $U^{\ast }\simeq U_{r}^{\ast }$
. A possible future research is to extend the proposed methods to the study of the combined VIV–galloping phenomenon at high
 $Re$
, and thereby to generalize the mode competition mechanism.
Acknowledgements
This work is supported by the National Science Fund for Excellent Young Scholars (11622220) and National Natural Science Foundation of China (11572252) and 111 project of China (B17037). It is also supported by the Innovation Foundation for Doctor Dissertation of Northwestern Polytechnical University (CX201709).
Appendix A. Energy transfer coefficient of eigenmode
Following previous works of Navrose & Mittal (Reference Mittal2016) and Yao & Jaiman (Reference Yao and Jaiman2017), the time evolution of the cylinder displacement and lift coefficient corresponding to an eigenmode for the linear coupled system is given as:
 $$\begin{eqnarray}\left.\begin{array}{@{}c@{}}Y={\hat{Y}}\text{e}^{\unicode[STIX]{x1D706}_{r}t}\cos (\unicode[STIX]{x1D706}_{i}t),\\ C_{L}=\hat{C_{L}}\text{e}^{\unicode[STIX]{x1D706}_{r}t}\cos (\unicode[STIX]{x1D706}_{i}t+\unicode[STIX]{x1D719}),\end{array}\right\}\end{eqnarray}$$
where
 $\unicode[STIX]{x1D706}=\unicode[STIX]{x1D706}_{r}+\text{i}\unicode[STIX]{x1D706}_{i}$
denotes the eigenvalue,
 ${\hat{Y}}$
and
 $\hat{C_{L}}$
represent the magnitudes of eigenmodes. The phase angle
 $\unicode[STIX]{x1D719}$
can be derived by substituting (A 1) into the structural motion equation (2.6) as:
 $$\begin{eqnarray}\sin \unicode[STIX]{x1D719}=\frac{2\unicode[STIX]{x1D706}_{r}\unicode[STIX]{x1D706}_{i}{\hat{Y}}\unicode[STIX]{x03C0}m^{\ast }}{{\hat{C}}_{L}}.\end{eqnarray}$$
Next, the non-dimensional energy transferred from the fluid to the cylinder over one vibration period is evaluated as:
 $$\begin{eqnarray}E(t)=\int _{t}^{t+2\unicode[STIX]{x03C0}/\unicode[STIX]{x1D706}_{i}}C_{L}(t){\dot{Y}}(t)\,\text{d}t.\end{eqnarray}$$
Plunging (A 1) into (A 3) and neglecting the exponential growth/decay of eigenmode, we can obtain the energy transfer coefficient
 $$\begin{eqnarray}E_{c}=\unicode[STIX]{x03C0}\hat{C_{L}}{\hat{Y}}\sin \unicode[STIX]{x1D719}.\end{eqnarray}$$
Using (A 2), the energy transfer coefficient for an eigenmode can also be written as:
 $$\begin{eqnarray}E_{c}=2\unicode[STIX]{x03C0}^{2}{\hat{Y}}^{2}m^{\ast }\unicode[STIX]{x1D706}_{r}\unicode[STIX]{x1D706}_{i}.\end{eqnarray}$$



