I. INTRODUCTION
Magnesium alloys characterized by lightweight and high specific strength are particularly attractive in many industrial fields, such as automotive, aerospace, and military.Reference Janeček, Král, Dobroň, Chmelík, Šupík and Holländer1 However, more extensive applications are limited by the poor corrosion resistance and plasticity at room temperature.Reference Motevalli and Eghbali2 Cladding Al layer on the surface of Mg greatly improved the corrosion resistance of Mg alloys.Reference Zhang, Castagne, Yang, Gu and Wang3 To further enhance the strength and stiffness of Al/Mg/Al laminates, Ti layer can be used to fabricate Ti/Al/Mg/Al/Ti laminates. In combination of Mg with lower density and Ti with excellent mechanical properties, the obtained Ti/Al/Mg laminates have a great potential for the future industrial applications.Reference Polmear4–Reference Boyer, Welsch and Collings6
In recent years, metal laminates are fabricated by many kinds of manufacturing processes, such as hot rolling,Reference Zhang, Yang, Castagne and Wang7 cold rolling,Reference Kavarana, Ravichandran and Sahay8,Reference Luo and Acoff9 explosive welding,Reference Bataev, Bataev, Mali and Pavliukova10 hot pressing,Reference Zhu, Liang and Li11 diffusion bonding,Reference Cole12,Reference Guo, Liu, Jin, Shi and Qiao13 and accumulative roll bonding (ARB).Reference Yang, Cizek, Hodgson and Wen14 Among them, the well-known rolling is one of the most economical methods to produce laminates.Reference Zhao, Wang, Liu, Wang and Shi15 Ti/Al laminates were fabricated by cold rolling and ARB, and the ultimate tensile strength (UTS) increased significantly with increasing rolling reduction, whereas the elongation (EL) decreased. The bonding strength of Ti/Al laminates increased with increasing rolling reduction.Reference Ma, Meng and Liu16 The fabricated Ti/Al/Ti laminates at 400 °C show that the UTS and the bonding strength increased with the increase of the rolling reduction. Therefore, it can be seen that the rolling reduction ratio plays a key role in the evolution of microstructure and the mechanical properties of roll-bonded laminates. Besides, the increased reduction ratio may result in the activation of twins and dynamic recrystallization (DRX) in Mg layer.Reference Chang, Shang, Wang, Zhao and Qi17,Reference Zhang, Yang, Castagne and Wang18 The morphology and thickness of the diffusion layer at Mg–Al interface are tightly related with the reduction ratio.Reference Zhang, Yang, Castagne and Wang18 The mechanical properties of the sheet metals could be further enhanced by the improvement of the texture and microstructure. Planar anisotropy of rolled AZ31 Mg alloy sheets is attributed to the typical (0002) basal plane texture usually induced by rolling process.Reference Bohlen, Nürnberg, Senn, Letzig and Agnew19,Reference Agnew20
However, as a novel composite, the effect of rolling reduction on microstructures and mechanical properties of Ti/Al/Mg laminate remains to further investigate. In this paper, five-ply Ti/Al/Mg/Al/Ti laminates were fabricated by hot rolling under various rolling reductions. The relationship between the microstructures of component layers and interface, and mechanical properties are investigated in detail.
II. EXPERIMENT OF PROCEDURE
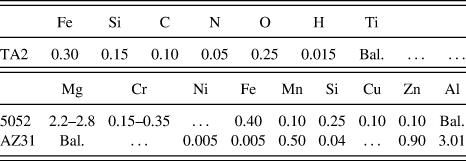
Commercially available 5052 Al alloy, AZ31 Mg alloy, and TA2 Ti sheets were selected as component sheets, and the chemical compositions (wt%) of the as-received 5052, AZ31, and TA2 sheets were measured by energy-dispersive X-ray spectroscopy and are listed in Table I.
Chemical composition of constituent 5052 Al alloy, AZ31 Mg alloy, and TA2 Ti (wt%).

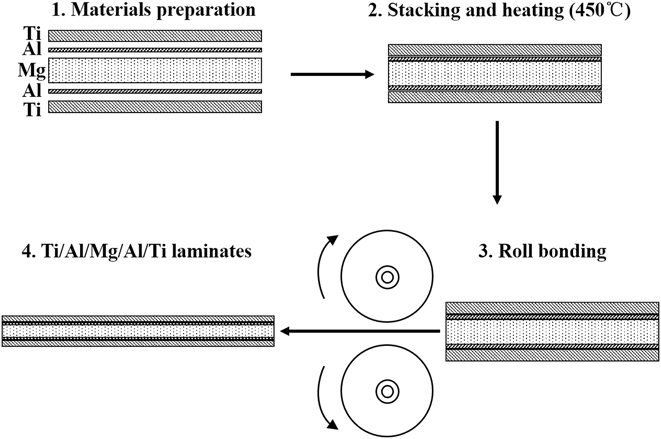
The initial dimensions of the AZ31 Mg sheets were 400 × 600 × 2.75 mm, 5052 Al sheets were 400 × 600 × 0.30 mm, and TA2 Ti sheets were 500 × 900 × 0.30 mm. The rolling process is illustrated in Fig. 1. The symmetrical five-ply Ti/Al/Mg/Al/Ti laminates are used to improve the warpage in processing the asymmetrical laminates (Ti/Al/Mg). After proper surface treatment, including brushing and degreasing, five layers in the stacking sequence of TA2 Ti–5052 Al–AZ31 Mg–5052 Al–TA2 Ti were subjected to preheating at 450 °C for 10 min. The diameter and temperature of the rolls are 130 mm and 150 °C, respectively. The rolling rate is 4.08 m/min. The five-ply laminates were fabricated by single-step hot rolling with three rolling reductions of 40, 50, and 60%. The as-rolled specimens of the 40%, 50%, and 60% (AR40, AR50, and AR60) rolling reduction were cut by electric spark cutting machine.
Schematic of rolling process of Ti/Al/Mg/Al/Ti laminates.

The mechanical properties of the laminates were measured, using an Instron5969 materials testing machine (Instron, Boston, Massachusetts) at room temperature, and the speed of crosshead was 0.5 mm/min. Flat dog bone-shaped tensile specimens with a gage length of 10 mm were prepared along the transverse direction (TD). Microhardness tests were conducted on cross sections of the samples. The Vickers microhardness of the AZ31 layers, 5052 layers, and TA2 layers in the laminates was measured using MH-600 (Haoxi, Shanghai, China) with the indentation load of 50 gf (1 gf = 9.81 mN) and the dwell time of 10 s. The average hardness of interface and each component layer including the area near the interface (AN) and the area far away from the interface (AF) is obtained using indentation experiments. Each test was repeated three times for accuracy.
The microstructures of the laminates were characterized, using a Tescan MIRA3 field-emission scanning electron microscope (SEM; Tescan, Brno, Czech Republic) equipped with an Oxford energy-dispersive spectroscopy system. Texture evolution of Mg layer was examined on the TD–ND (normal direction) plane by electron backscatter diffraction (EBSD). For observing the microstructure evolution of the constituent Mg layer, the samples were etched by 4.2 g of picric acid, 10 mL of acetic acid, 70 mL of ethanol, and 10 mL of H2O for 7 s, which were examined by Leica DM2500 optical microscope (OM; Leica, Wetzlar, Germany). At the same time, the microstructure evolution of constituent Ti layer was etched by 2 mL of hydrofluoric acid, 5 mL of concentrated nitric acid, and 95 mL of H2O for 15 s. The microstructures of Ti are measured by SEM. All the specimens were etched at room temperature. The grain diameter distribution of specimens was calculated by Image-Pro Plus software (Media Cybernetics, Rockville, Maryland). Sample preparation for the EBSD measurement included mechanical grinding, polishing with a supersaturated MgO solution, ultrasonic cleaning for 120 s in alcohol, and finally, ion beam mill thinning for 10 h with a voltage of 2.5 kV. The EBSD measurements were taken at 20 kV with a working distance of 15 mm, a tilt angle of 70°, and a scanning step of 1.0 µm. The crystallographic orientation of the grains was analyzed, using Channel 5 software (Oxford Instruments, Oxfordshire, UK).
III. RESULTS AND DISCUSSION
A. Interfacial structure
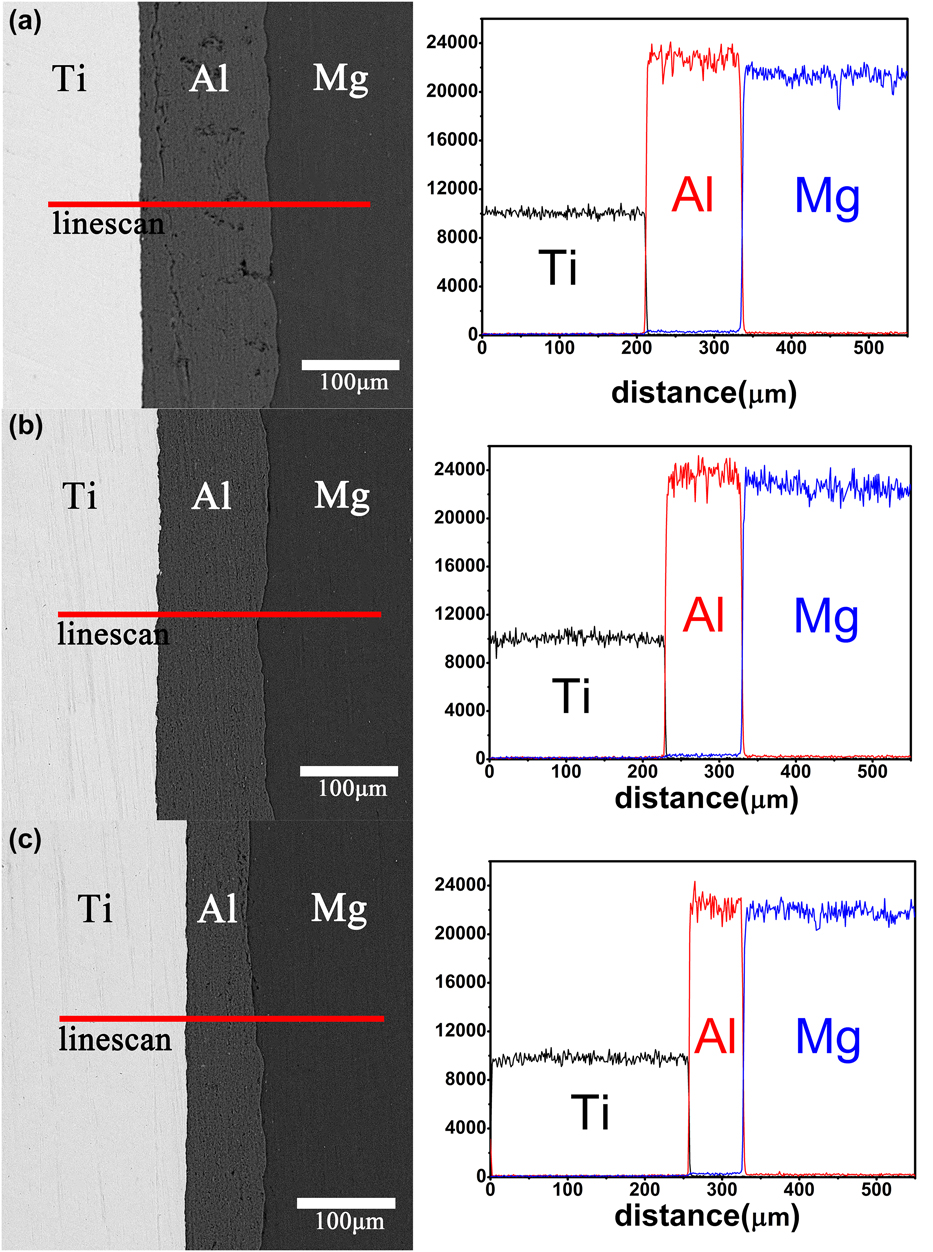
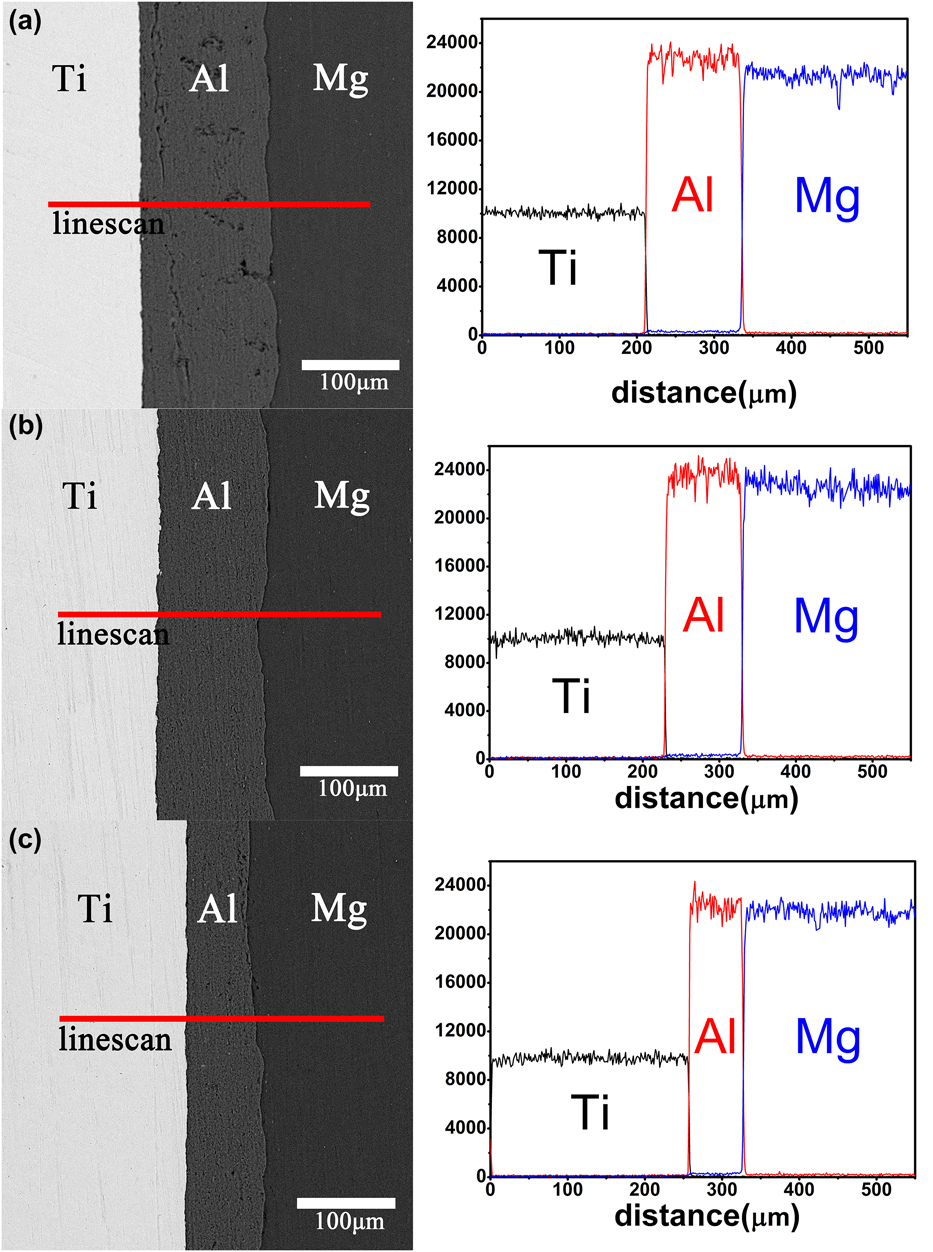
Figure 2 shows backscattered electron image of Ti/Al/Mg/Al/Ti laminates with various rolling reductions and the corresponding element line scanning results. It is found that all of the specimens reveal defect- or crack-free smooth Mg–Al and Ti–Al interfaces, indicating the integrity of the interfaces remains sound in terms of interfacial bonding. Intermetallic compounds (IMCs) including TiAl3, Al3Mg2, and Mg17Al12 have important effect on the interfacial bonding of laminates,Reference Christy, Murugan and Kumar21–Reference Scudino, Liu, Sakaliyska, Surreddi and Eckert23 the mechanical properties, and bonding strength, because of their hardness and brittleness.Reference Zhu, Liang and Li11,Reference Chen, Wang, Cao, Yang and Wang24 Hence, the element diffusion at interfaces of Ti/Al/Mg laminates is measured to explore possible IMCs. The element distribution lines along the ND are strictly steep; thus, it is revealed that no IMCs formed at Ti–Al and Al–Mg interfaces, respectively. This phenomenon is consistent with the previous investigations. Roman et al. revealed that the reaction between Ti and Al results in the formation of the Al3Ti compound at 600 °C.Reference Roman’kov, Sagdoldina, Kaloshkin and Kaevitser25 After a single hot rolling, there is no formation of IMCs at the Ti–Al interface.Reference Du, Fan, Yu, Hansen, Geng and Huang26 Luo et al. revealed that there are no discernible IMCs in the joint interface between Al and Mg.Reference Luo, Liang, Li and Yao27
SEM micrographs and energy-dispersive spectroscopy line scan of Ti/Al/Mg interface from (a) AR40, (b) AR50, and (c) AR60.
Obvious difference can be seen between the interfacial shapes of Ti–Al and Mg–Al. The difference in flow properties of Ti, Al, and Mg was the main reason for the difference in interfacial shape. Kim et al. have also shown that the Mg–Al interface after single-pass rolling was seen to become a curved shape because of the considerable amount of deformation present at the interface.Reference Kim, Lee, Kwon, Lee, Chang and Lee28 Previous studies by Jafari et al. have indicated that well-bonded Ti–Al interface is flat.Reference Jafari, Eghbali and Adhami29 Fan has reported that the Ti and Al layers deformed uniformly during the hot rolling and no local necking occurred.Reference Du, Fan, Yu, Hansen, Geng and Huang26 In the process of rolling, Ti sheets are not easy to deformation, thus directly embedded into Al layer, so the Ti–Al interface is flat. However, wavy morphology appeared on the interfacial bonding of Al–Mg, because considerable amount of deformation happened at the interface.Reference Kim, Lee, Kwon, Lee, Chang and Lee28 So the Al–Mg interface is undulating.
B. Microstructural evolution of constituent Mg layer and Ti layer
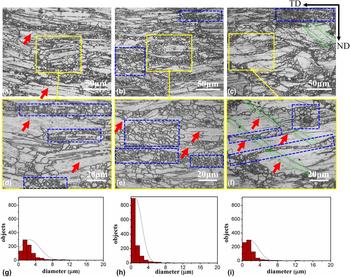
Figures 3(a)–3(c) exhibit the optical micrographs of the constituent Mg layer obtained from AR40, AR50, and AR60 specimens, respectively. Mg layer of AR40 shows a bimodal grain size distribution consisting of a large fraction of the elongated coarse grains with a small fraction of newly formed grains induced by DRX. Similar phenomenon is found in hot rolled AZ31 sheet, in which DRX is activated with the rolling bonding.Reference Pérez-Prado and Ruano30 The DRXed grains are marked by blue-dotted rectangle. The phenomenon demonstrates that 40% reduction can activate the DRX. EL of coarse grains can be explained by the higher strain energy in the high rolling reduction samples.Reference Liu, Wang, Jia, Jing, Zhang, Ma and Liu31 The elongated coarse grains are marked by red arrows. As the rolling reduction increases, DRXed grains appear and surround the boundaries of elongated coarse grains, as presented in Fig. 3(b). The fraction of DRXed grains significantly increases as rolling reduction increases to 50%, so the microstructure of AR50 is more uniform than that of AR40. Obviously, the diameter of most grains of AR50 ranges from 0 to 4 μm, and grains with diameter smaller than 1 μm take the most proportion, as shown in Fig. 3(h). This phenomenon indicates that larger strain in AR50 laminate promotes nuclei of new DRXed grain and provides greater driving force for the DRX behavior of Mg layer. Another interesting finding is that coarse grains are further elongated in AR50, which coordinates the larger deformation.
OM micrographs of microstructures of constituent Mg layer from (a, d) AR40, (b, e) AR50, (c, f) AR60 (red arrows represent coarse grains; blue-dotted rectangle encloses the samples with DRX region; and green-dotted ellipse encloses the samples with twins.), grain diameter distribution of (g) AR40, (h) AR50, and (i) AR60.
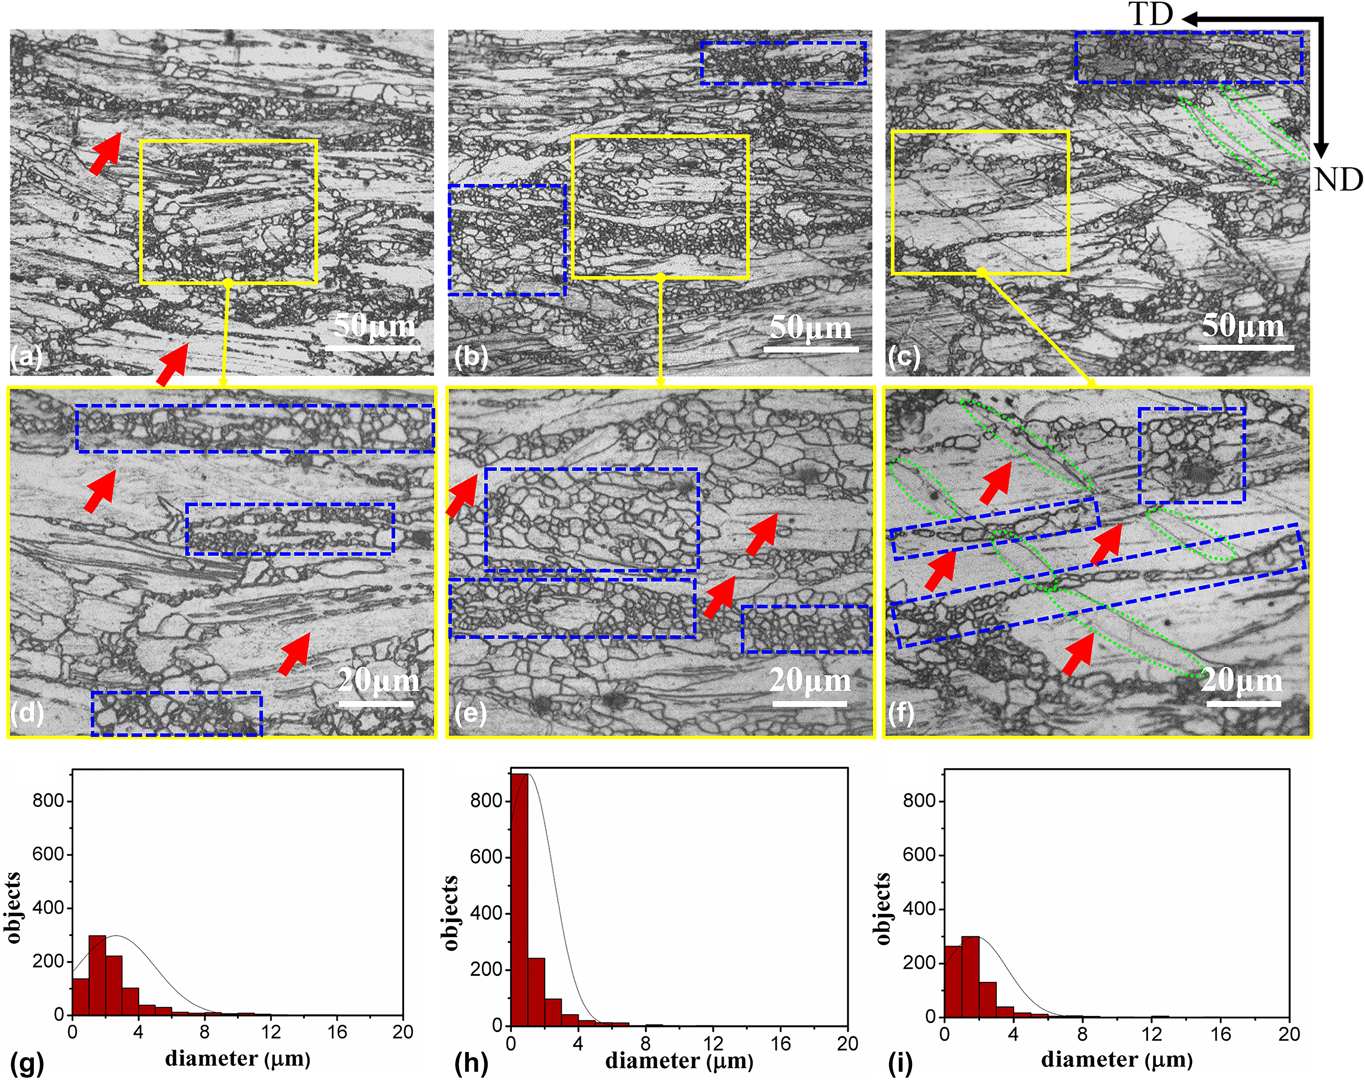
As the rolling reduction increases to 60%, twinning behavior appears, as shown in Fig. 3(c). This phenomenon may be related to the strain distribution in the rolling pass.Reference Yoo32 More strain along c axis should be absorbed as rolling reduction increases, whereas only second-order pyramidal 〈c + a〉 slip and deformation twinning can provide c-axis strain component in deformation for Mg alloys.Reference Zhu and Ringer33 Large numbers of twins are formed to absorb the further strain as reduction increases. The twins are marked by green-dotted ellipse. Compared with AR40 and AR50, some of the grains are elongated along the TD to coordinate deformation strain. Deformation twinning that forms in the elongated coarse grains is the dominant deformation behavior in the Mg layer of AR60. Figure 3(i) shows that the grain diameter distribution of AR60 is around 0–4 μm, which is mainly composed by DRXed grains. The DRXed grains are surrounded along the boundaries of elongated coarse grains.
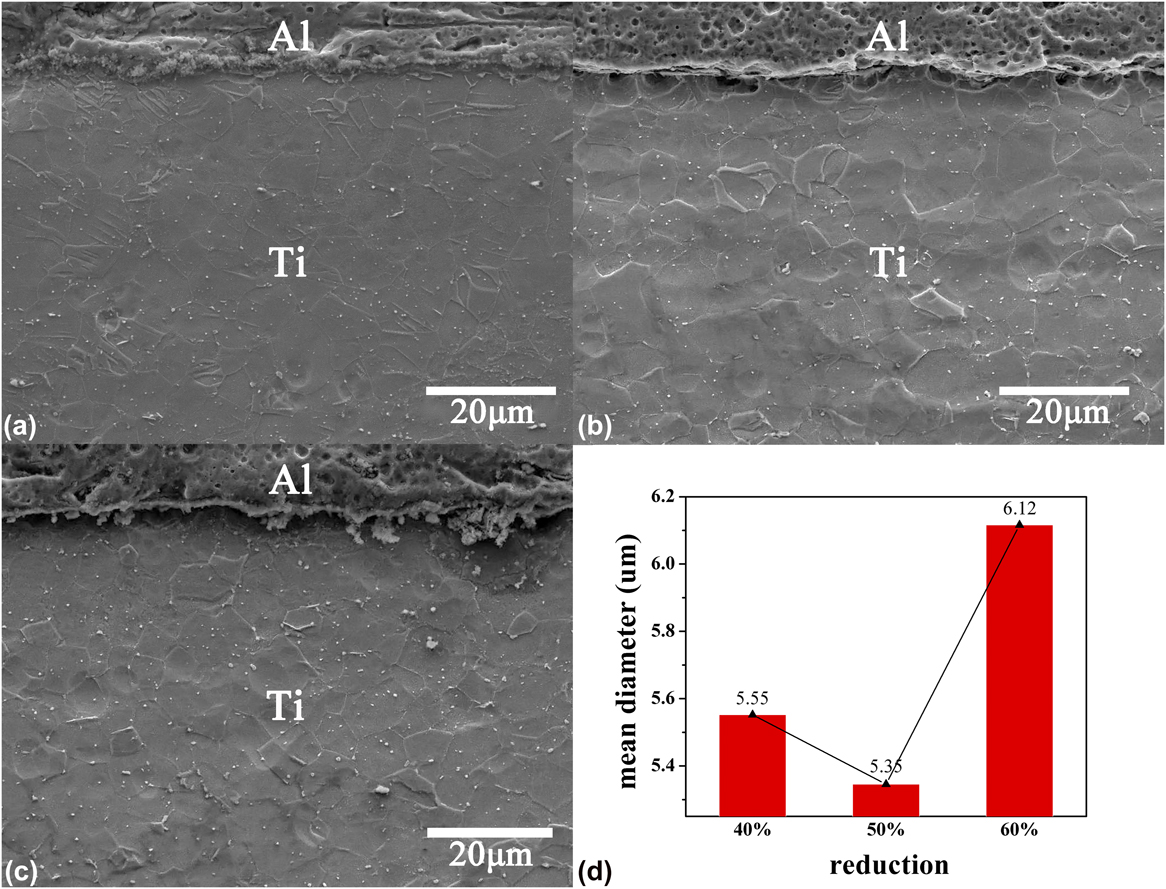
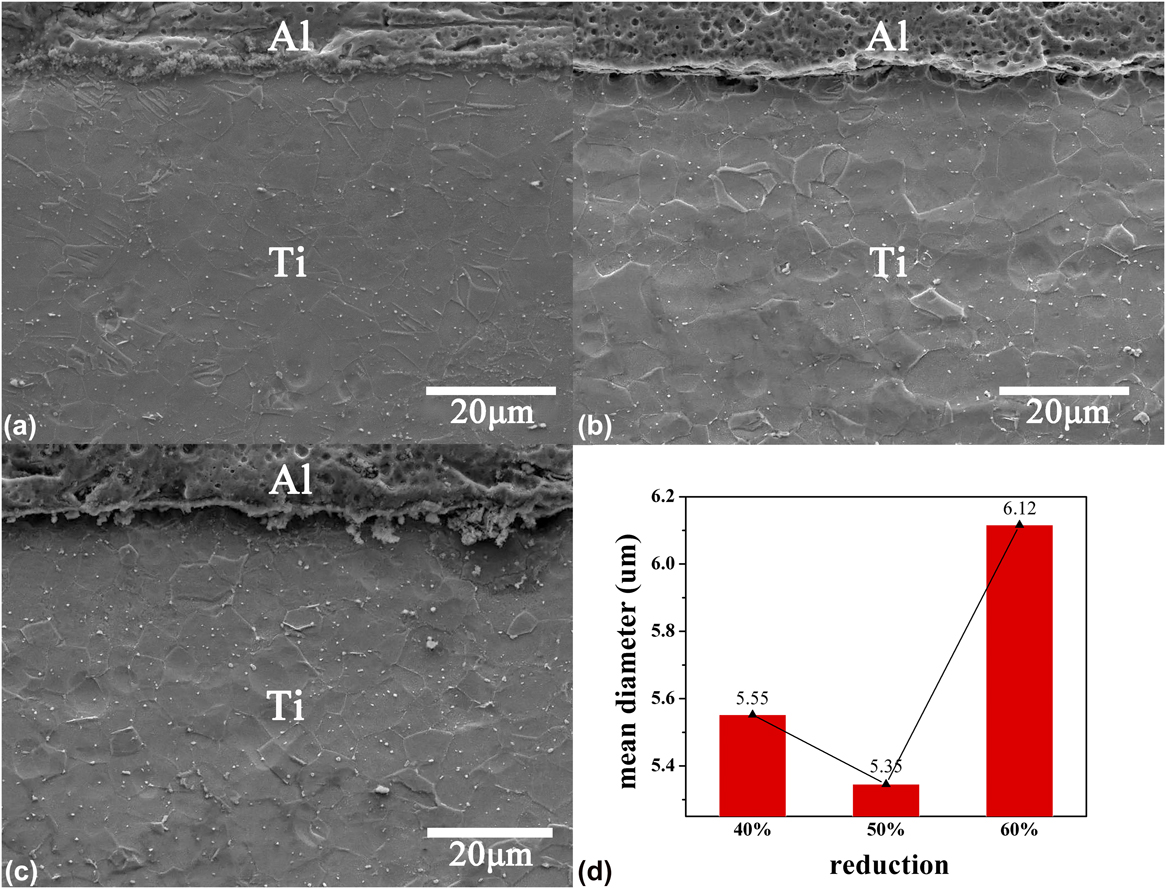
Figures 4(a)–4(c) exhibit the SEM micrographs of the constituent Ti layer obtained from AR40, AR50, and AR60. The grains of Ti are uniformly distributed, and the grain size of the AN is similar to AF. There were almost homogeneous equiaxed grains in Ti layer, indicating that the different rolling reduction has little impact on Ti layer. The mean diameter of different reduction of Ti grains was presented in Fig. 4(d). The average grain size of the Ti of AR40 and AR60 is 5.55 and 6.12 μm. The Ti of AR50 has the smallest average grain size and the grain size is 5.35 μm.
SEM micrographs of microstructes of constituent Ti layer from (a) AR40, (b) AR50, (c) AR60, and (d) grain mean diameter determined from (a–c).
C. Texture evolution of Mg layer
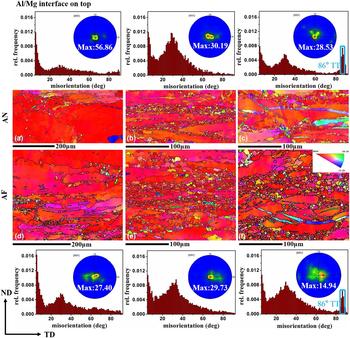
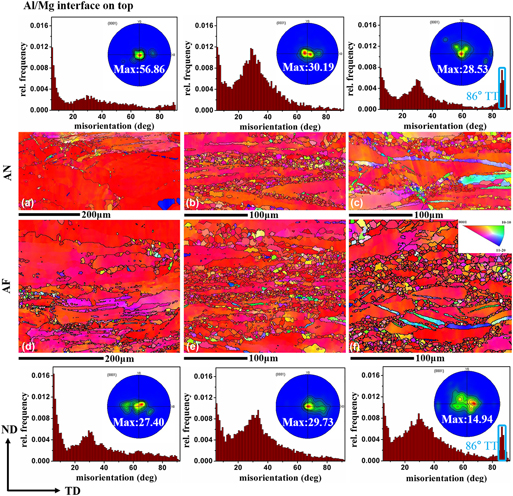
Figures 5(a)–5(c) present the Mg layer constituent structure of AN of AR40, AR50, and AR60, corresponding (0002) pole figures (PFs), and distribution of grain boundary misorientation. These sequential EBSD maps show the microstructure evolution influenced by various rolling reductions. Figure 5(a) shows that large coarse grains occupy the largest proportion. A small fraction of DRXed grains appears at coarse grain boundaries, which can be demonstrated by a weak peak around 30° in the distribution of grain boundary misorientation. The PF of AN of AR40 is a typical basal texture with a peak intensity of 56.86 multiples of uniform density (mud). Figure 5(b) shows bimodal grain distribution of elongated coarse grains and DRXed grains. DRXed grains appear between the deformation bands, which accords with the OM results. With the increase of rolling reduction, the proportion of DRXed grains increases. The PF of AR50 indicates c axes of a large number of Mg grains tilt toward the TD. The strong peak around 30° proves that DRX occurs in AN of AR50 Mg layer, which has been confirmed by transmission electron microscope examination.Reference Tan and Tan34 Figure 5(c) shows a complex microstructure of AR60, including DRXed grains, elongated coarse grains, and twins, respectively. It is obviously that compared with the intensity of Mg layer with various rolling reductions, peak intensity decreased, which is 28.53 mud. In AN of AR60 Mg layer, the DRXed grains appear between the deformation bands, and the formation of small recrystallized grains is attributed to the rearrangement of misorientated flat dislocation pile-ups.Reference Liu, Huang, Liu and Kang35 The peaks around 30° and 86°, respectively, demonstrate that the recrystallization and tensile twin (TT) occur in AN of AR60 Mg layer.
EBSD inverse pole figure (IPF) maps, corresponding (0002) PF, and distribution of grain boundary misorientation of AR40, AR50, and AR60 Mg layer (a–c) AN and (d–f) AF.

Figures 5(d)–5(f) present the Mg layer constituent structure of AF of AR40, AR50, and AR60, corresponding (0002) PFs, and distribution of grain boundary misorientation. These sequential EBSD maps show the microstructure evolution influenced by various rolling reductions. Figure 5(d) shows that the coarse grains are the most important role in AR40. And recrystallization has occurred along the part of coarse grain boundaries, and the distribution of grain boundary misorientation has lower peak around 30°. And the intensity of the strongest texture peak is 27.40 mud. The AF of AR50 Mg layer shows that bimodal grain morphology includes DRX and deformation bands of coarse grains. The DRX is activated by the larger normal strain. The texture intensity of the AR50 Mg layer is 29.73 mud, and after the hot rolling, the texture direction along TD. Figure 5(f) shows three different forms of microstructure: DRXed grains, elongated coarse grains, and twin grains, respectively. It is worth noting that continuous DRXed bands exist in the middle of AF of Mg layer. The intensity peak of AF in AR60 Mg layer is 14.94 mud, which is the lowest in the PFs. This suggests the inhomogeneous grain distribution of AF of AR60 Mg layer. Because of the higher power of strain with the larger strain, the TT is activated in the coarse grains by the normal stress. The distribution of grain boundary misorientation, which are another peaks in AF of Mg layer is found around 86°, suggest that TTs may exist. A fraction of DRX has occurred at the end of TTs.Reference Guan, Rainforth, Gao, Sharp, Wynne and Ma36
Different regions of Mg layer of laminates with various rolling reductions exhibit typical (0002) basal texture. The intensity of AN is larger than that of AF, and for AR40 and AR60, the value of AN is nearly double that of AF. However, the pole intensities of AN and AF of AR50 are similar, indicating a more uniform microstructure. For AN, the pole intensity decreases as rolling reduction increases.
D. Mechanical properties
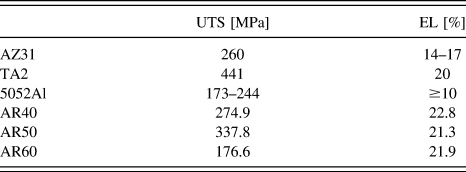
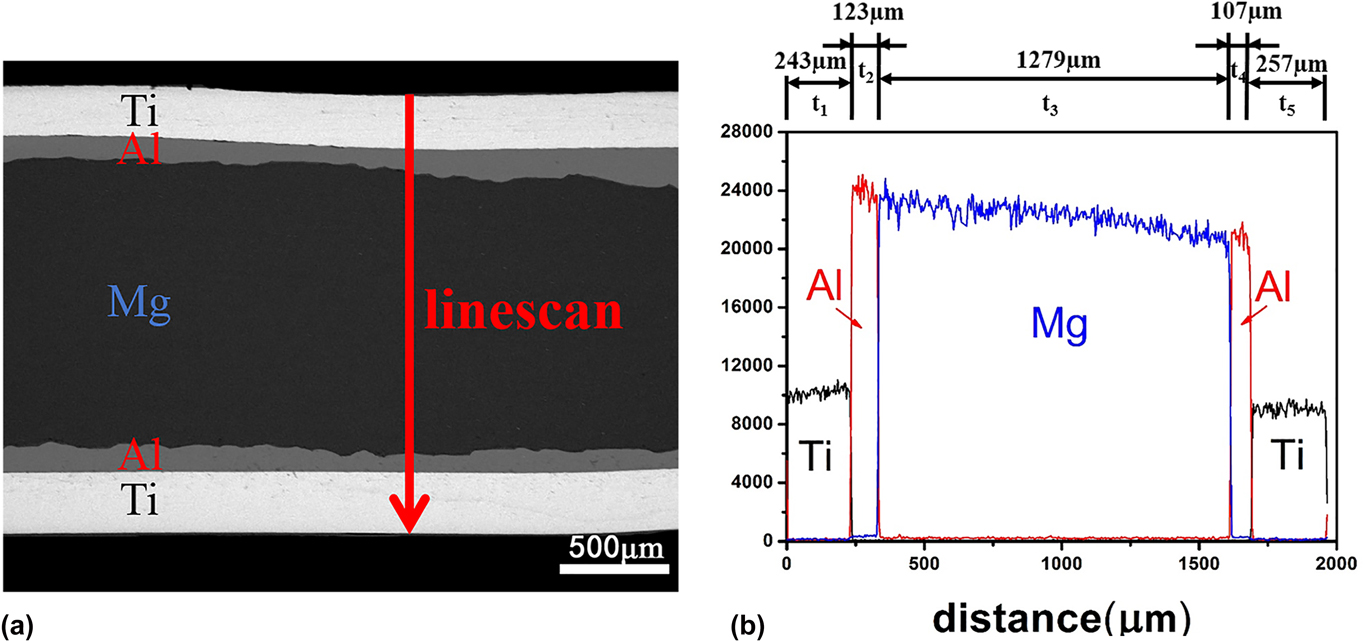
To illustrate the contribution of component layers to the laminates in mechanical properties, Table II also gives the UTS and EL of each layer. Figure 6 shows SEM micrograph of AR50 Ti/Al/Mg/Al/Ti laminates and the corresponding element line scanning results. The thickness of each layer is acquired by the element line scanning result. The thicknesses of Ti layer, Al layer, Mg layer, symmetrical Al layer, and Ti layer in sequence are designated as t1, t2, t3, t4, and t5, respectively. Besides, when samples bear tension, the heterogeneity in the direction perpendicular to the interface being not considered, the strength of the laminates can be estimated by the mixture rule,Reference Yu, Lu, Tieu, Li, Godbole and Kong37
 $$\sigma = {\sigma _{\rm{b}}}{{{t_3}} \over {{t_1} + {t_2} + {t_3} + {t_4} + {t_5}}} + {\sigma _{\rm{c}}}{{{t_1} + {t_5}} \over {{t_1} + {t_2} + {t_3} + {t_4} + {t_5}}} + {\sigma _{\rm{d}}}{{{t_2} + {t_4}} \over {{t_1} + {t_2} + {t_3} + {t_4} + {t_5}}}\quad ,$$
where σb, σc, and σd are the UTS of relevant Mg, Al, and Ti layers in the laminates, respectively. Therefore, the UTS values of the laminates are calculated by Eq. (1). So, calculated value is 303.22 MPa. And the experimental value is 337.8 MPa. Comparing experimental value with calculated value, the experimental strength of Ti/Al/Mg/Al/Ti laminate is great. Mechanical properties of TA2 is best among TA2, 5052, and AZ31, and UTS and EL of TA2 reached 441 MPa and 20%, respectively, which is greatly higher than that of the AZ31 and 5052. Previously, Chen reported that the UTS of the Al/Mg/Al sheets reached 162 MPa at 200 °C.Reference Chen, Wang, Cao, Yang and Wang24 And Yu studied that after the cold roll bonding process, the Al/Ti/Al laminate shows improved strength about 200 MPa.Reference Ma, Huo, Liu, Wang and Wang38 In comparison, the Ti/Al/Mg/Al/Ti laminate has better mechanical performance than Al/Mg/Al and Al/Ti/Al laminates.
Results of tensile tests for Ti/Al/Mg/Al/Ti laminates with various rolling reductions and Mechanical properties of component plate.

(a) SEM micrograph and (b) energy-dispersive spectroscopy line scan of five-ply Ti/Al/Mg/Al/Ti laminates from AR50.

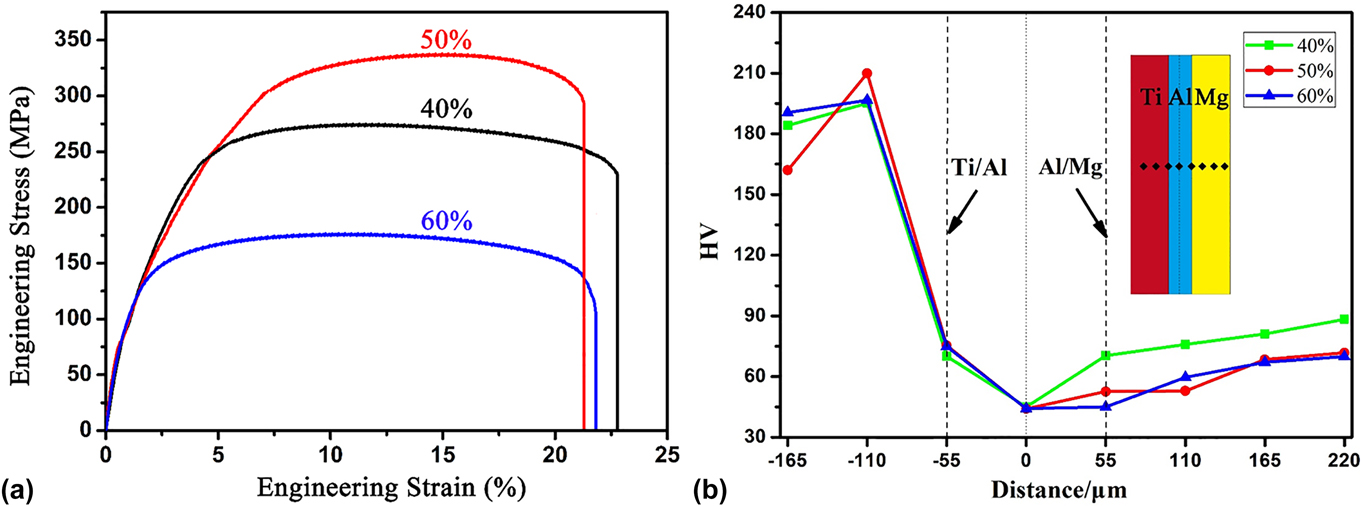
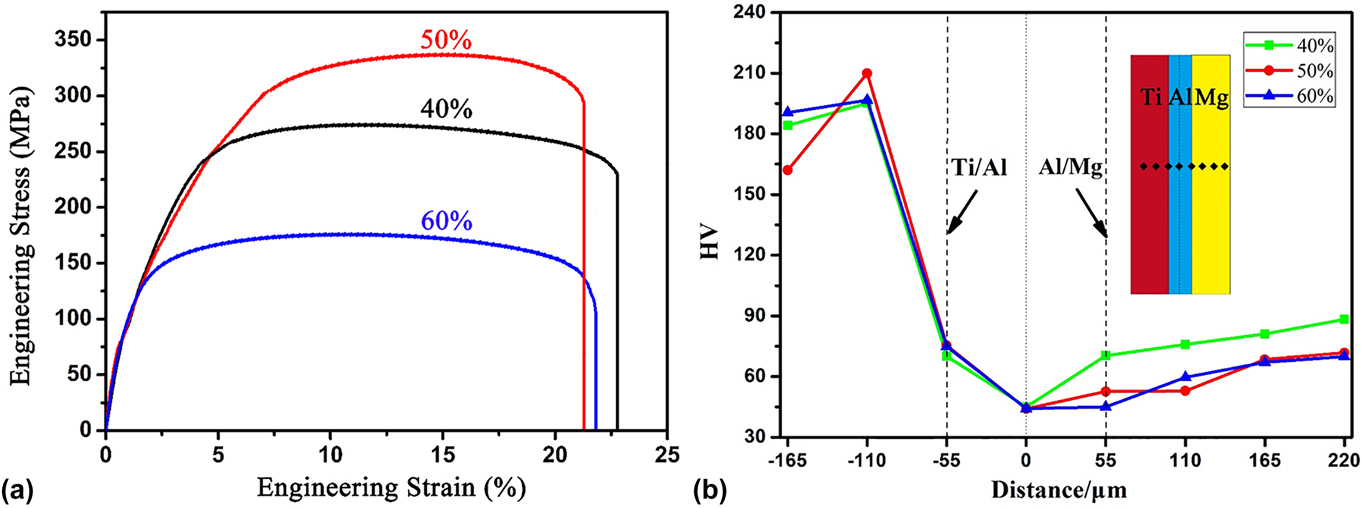
A series of uniaxial tensile tests are conducted on Ti/Al/Mg/Al/Ti laminates. Figure 7(a) shows the engineering stress–stain curves for the AR40, AR50, and AR60 samples, and the corresponding UTS and EL are summarized in Table II. AR50 has the largest UTS of 337.8 MPa and the UTS of AR60 is the lowest of 176.6 MPa. However, AR40 shows the best plasticity, with an EL of 22.8%. In terms of the ductility of AR40, AR50, and AR60, the differences between the three are small. Therefore, it can be seen that rolling reduction has a more significant effect on strength of laminates than plasticity. Specifically, grain refinement is strongly associated with high UTS of AR50, and small reduction in EL compared with AR40 is related with larger extent of DRX.Reference Kim, Jeong, Jeong and Kim39
(a) Engineering stress–strain curves and (b) hardness diagram of the AR40, AR50, and AR60 laminates.
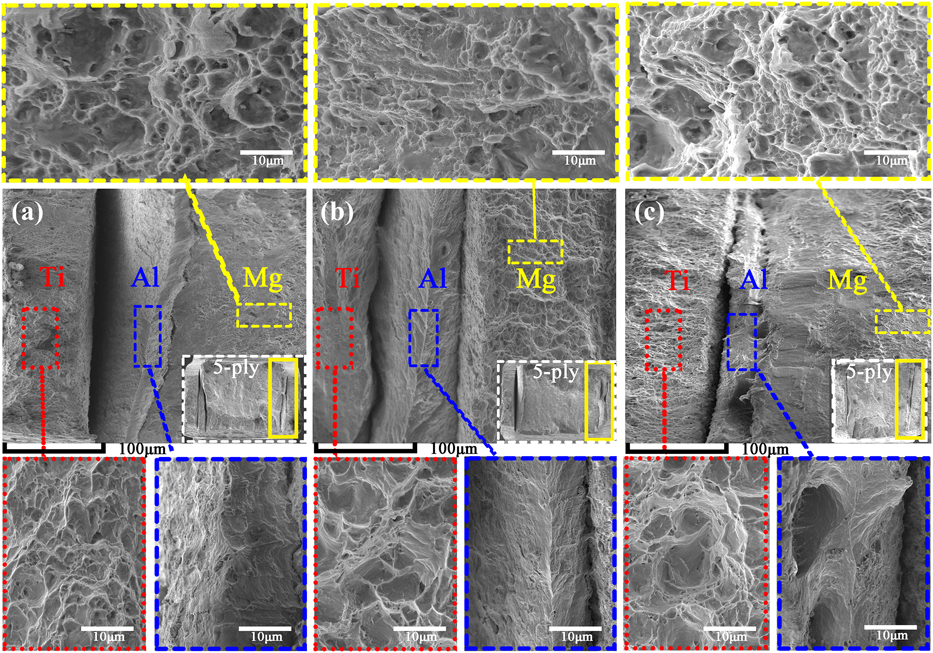
Fractures of the tensile-tested specimens are shown in Fig. 8. The structure of Al is face-centered cubic, and Ti and Mg belong to hexagonal close packing. Both Ti and Mg layers illustrate ductile fracture, which are characterized by dimples. Dimples of Ti are deeper than that of Mg. The phenomenon shows that plasticity of Ti is better than that of Mg. As typically anticipated, the existence of ductile Al adjacent to less-ductile Mg became stabilized against necking or prevented from catastrophic delamination parallel to the tensile axis.Reference Kim, Lee, Kwon, Lee, Chang and Lee28 Al layer belongs to ductile fracture characterized by tearing edge. It is evident from Fig. 8 that interfacial delamination takes place at Ti–Al interface, because the interface bonding strength of Mg–Al is larger than that of Ti–Al interface.Reference Ma, Meng and Liu16,Reference Kim, Lee, Kwon, Lee, Chang and Lee28 The larger the size of the dimples, the more serious the plastic deformation, and the more energy is absorbed in the fracture process; hence, the better the ductility. Therefore, AR40 has better ductility than AR50 and AR60.
Fractures of Ti/Al/Mg/Al/Ti laminates from (a) AR40, (b) AR50, and (c) AR60.

Vickers microhardness profile along the ND of AR40, AR50, and AR60 is shown in Fig. 7(b), and the specific testing locations are marked by black dots. The Vickers hardness characteristic starts with a typical value of 180 HV in the Ti layer and then the decreases drastically in Ti–Al interface about 70 HV and about 60 HV in Al–Mg interface. The Vickers hardness of Al layer was lower than that of Al near the Al–Mg interface, because the shape of Al–Mg interface was wavy leading to severe plastic deformation of Al. So this phenomenon belongs to work hardening leading to hardness increasing. The microhardness values of Al12Mg17 and Al3Mg2 intermetallic phases are much higher than Mg and Al layers, as reported in the literature.Reference Paramsothy, Hassan, Srikanth and Gupta40,Reference Azizi and Alimardan41 Vickers microhardness of Al–Mg interface is similar to AF of Al and Mg, so layers of intermetallic phases are not existent.
IV. CONCLUSIONS
Five-ply Ti/Al/Mg/Al/Ti laminates were fabricated by hot rolling and forward preheating at 450 °C for 10 min. The microstructures of the component sheets and the interface of Ti–Al and Al–Mg were observed. The influence of rolling reduction on the mechanical properties of Ti/Al/Mg/Al/Ti laminates was investigated. The following conclusions can be drawn:
(1) Ti/Al/Mg/Al/Ti laminates show well-bonded interfaces after preheating 10 min at 450 °C by hot rolling, and IMCs are not observed at waved Mg–Al and flat Ti–Al interface.
(2) Mg layer of AR50 has the most DRXed grains around the deformation bands, and TTs appear in Mg layer when the rolling reduction increases to 60%. Ti layer shows equiaxed grains, which are not sensitive to thickness strain.
(3) Mg layers of laminates with various rolling reductions all exhibit typical (0002) basal texture. The pole intensity of AN region of AR40 and AR60 is nearly double that of AF, whereas the intensities of AN and AF in AR50 are similar.
(4) AR50 has the largest UTS of 337.8 MPa, which is mainly owing to grain refinement caused by the extensive DRX. The differences of EL among the three samples with different rolling reductions are small.
ACKNOWLEDGMENTS
This study was supported by the National Natural Science Foundation of China under Grant No. 51274149; Shanxi Scholarship Council of China (No. 2014-029); the Youth Science Foundation of Shanxi Province under Grant No. 2008021033; the Fund for the Doctoral Program of Higher Education of China under Grant No. 20111402110004; and the Program of Shanxi Institute of Energy under Grant No. ZY-2017003.