I. INTRODUCTION
Freckle is a very serious defect in directionally solidified or single crystal blades of nickel-based superalloys. Reference Sun, Hu, Lee, Ceo and Choe1,Reference Xue, Li, Zhong, Li and Fu2 During directional solidification, when the driving force of the fluid flow exceeds the viscous resistance force, meaning that there is density difference between the less dense solute in the mushy zone and the bulk liquid ahead of the dendritic tip, density inversion can be induced. As a result, an upward thermosolutal convection can be formed ahead of the solidification interface. This convection can fragmentate and remelt the dendrite arms, finally leading to the formation of freckles. Reference Schneider and Beckermann3–Reference Madison, Spowart, Rowenhorst, Aagesen, Thornton and Pollock5 The freckles must be eliminated since they exert severe negative influences on the high-temperature mechanical properties of turbine blades. To minimize freckles, the flow ahead of solid/liquid (S/L) interface should be well controlled.
To control convection of directional solidification process, the research of applied magnetic fields began in the 1960s, which aims to obtain high quality castings with little or no defect. According to the studies of Lehmann et al. Reference Lehmann, Moreau, Camel and Bolcato6 and Utech et al., Reference Utech and Flemings7 equiaxed grains, the solidification structure of Al–Cu alloy, can be changed to columnar crystal completely under the direct current (DC) magnetic field. The main reason is that as melt convection is suppressed under DC magnetic field, the chance of broken dendrite arms and crystal nucleus being brought into liquid is decreased, thus the amount of equiaxed grains in solidification process declines. With the development of DC magnetic field, magnetic field intensity increases from 0.1 to 10 T. Reference Li, Ren and Fautrelle8 However, the operation costs of DC magnetic field equipment is quite high; besides, magnetic field generator will produce plenty of heat, which causes great heat dissipation problems in the operation process. All the above mentioned factors explain why the technique has not been widely applied in industrial manufactures. In the middle of 1970s, the traveling magnetic field (TMF) with lower frequency and lower heat was applied in industrial manufactures for the first time. Reference Zou, Jie, Liu, Wang, Yin and Li9
The TMF can provide an efficient method to indirectly control the flow of conductive fluids and the heat-mass transfer in the melt. Reference Wang, Shen, Qin, Feng, Wang and Fu10 First, R. Lantzsch used Opera software to simulate the flow induced by TMF in the vertical gradient solidification (VGF) method. It is found that the effect of the TMF on the solidification depends on parameter S. It was pointed out that when S > 10, the shielding effect of conductive melt on the magnetic field was quite significant. A number of flow regions were formed, with the effects of both axial and radial Lorentz forces. However, such flow was not a symmetric meridian flow. The shielding effect of conductive melt on the magnetic field was very limited, when S was small. At this time the Lorentz force within the melt was mostly axial, which resulted in symmetric meridian flow in the conductive melt. To study the stability of flow under the effect of TMF, a relatively small value of S (S = 1) was chosen for experiment and simulation and a Reynolds number (Re) was used to describe the flow intensity. The results of experiment and simulation showed that the flow was brought about by TMF started to change from stable state to unstable state, as Re was in the range from 300 to 450. The crystal growth could be hindered by unstable flow in the melt. Reference Lantzsch, Galindo, Grants, Zhang, Pätzold, Gerbeth and Stelter11 Second, solidification interface shape can also be changed by TMF according to the studies of Rudolph et al., Reference Rudolph12 Miyazawa et al., Reference Miyazawa, Liu, Hisamatsu and Kakimoto13 and Shen et al. Reference Qin, Shen, Feng, Shang and Fu14 The results of their studies showed that an upward Lorentz force driven by TMF could lead to the corresponding upward meridional flow and natural convection in the same directions, which hindered crystallization latent heat discharge, hampered solute transportation, and increased the interface bending degree. On the contrary, a downward Lorentz force driven by TMF could make the corresponding upward meridional flow and natural convection in the opposite direction, which facilitated crystallization latent heat discharge, eased solute transportation, and decreased the interface bending degree. So, moderate TMF can be applied to obtain a planar interface to improve material quality. The above mentioned two factors play decisive roles in the formation and distribution of freckles based on the previous studies. Reference Karagadde, Yuan, Shevchenko, Eckert and Lee15 However, few comprehensive scientific studies on the effects of TMF on freckle formation have been reported. In this paper, the effects of TMF on freckle formation of directionally solidified Pb–Sn alloys were investigated experimentally, with simulation results carried out to explain the internal relationships between TMF and freckle formation.
II. EXPERIMENTAL PROCEDURE AND MATHEMATICAL MODELING
A. Experimental procedure
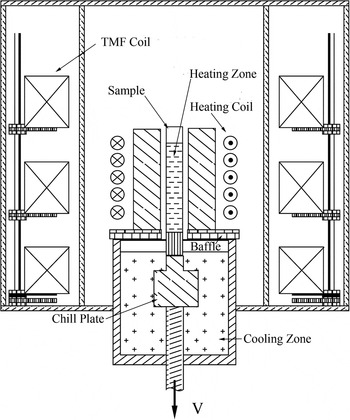
Schematic diagram of the vacuum Bridgman furnace is shown in Fig. 1. In previous investigations, Pb–Sn alloys were used to study the mechanism of freckle formation regularly. To facilitate comparing the dates of previous investigations, Pb–33 wt% Sn alloy is chosen. The samples of Pb–Sn with 12 mm in diameter were solidified in a vacuum Bridgman furnace, which was equipped with a heating zone and a cooling zone, separated by a thermal baffle. The sample was placed on the copper chill plate in the vacuum Bridgman furnace. The TMF coil was placed outside the heating coil. First, switch on the heating power and increase the power every 5 min till mold temperature reaches 583 K. To keep liquid at a thermally stable state, the temperature should be maintained for 15 min under a vacuum of 10−2 Pa. Then, the samples were pulled from the heating zone through the baffle into the cooling zone at constant withdrawal rate of 15 μm/s under the upward/downward TMF. The cooling rate and temperature gradient are 0.08 K/min and 25 K/cm, respectively. The metallographic etch of the samples was conducted with etchant Oberhoffer which is composed of 30 g FeCl3 + 1 g CuCl2 + 0.5 g SnCl2 + 50 mL HCl +500 mL C2H5OH + 500 mL H2O. The solidification structure and surface were observed by the Leica DM4000M optical microscope (Suzhou Mason Optics Co. Ltd., Suzhou, China).
Schematic diagram of the vacuum Bridgman furnace.

B. Governing equations
Based on the above assumptions, the transport phenomena were governed by the continuity, Navier–Stokes, energy, and solute [Eqs. (1)−(4)],
 $$\nabla \cdot \left( {{f_{\rm{l}}}\vec u} \right) = 0\quad ,$$
 $${\partial \over {\partial t}}\left( {{f_{\rm{l}}}\vec u} \right) + \nabla \cdot ({f_{\rm{l}}}\vec u\vec u) - \nabla \cdot \left[ {{\mu \over \rho }\nabla \left( {{f_{\rm{l}}}\vec u} \right)} \right] = - {{{f_{\rm{l}}}} \over \rho }\nabla P + g(1 - {\beta _{\rm{T}}}(T - {T_{{\rm{ref}}}}) - {\beta _{\rm{C}}}(C - {C_{{\rm{ref}}}})) + \vec F\quad ,$$
 $${{\partial T} \over {\partial t}} + \nabla \cdot \left( {\vec uT} \right) = {\sigma \over {\rho {c_{\rm{p}}}}}{\nabla ^2}T - {L \over {{c_{\rm{p}}}}}{{\partial {f_{\rm{l}}}} \over {\partial t}}\quad ,$$
 $${{\partial {C_{\rm{e}}}} \over {\partial t}} + \nabla \cdot \left( {\vec u{C_{\rm{l}}}} \right) = \nabla \cdot \left( {{D_{\rm{e}}}\nabla {C_{\rm{l}}}} \right)\quad ,$$
where T is the temperature,
 $\vec u$
is the velocity in the liquid,
 ${c_{\rm{p}}}$
is the specific heat, P is the pressure, μ is the viscosity in the liquid, σ is the thermal conductivity, ρ is the density, L is the latent heat,
 ${f_{\rm{l}}}$
is the mass fraction of liquid phase, g is the acceleration due to gravity,
 ${\beta _{\rm{T}}}$
is the thermal expansion coefficient,
 ${\beta _{\rm{C}}}$
is the solute expansion coefficient, C
ref is the reference solute concentration, and T
ref is the reference temperature.
 ${C_{\rm{s}}}$
and
 ${C_{\rm{l}}}$
are the average solute concentrations of the solid and liquid, respectively. C
e and D
e are the averages calculated by their respective values in liquid and solid in Eq. (4), defined as
 $${C_{\rm{e}}} = {C_{\rm{l}}}{f_{\rm{l}}} + {C_{\rm{s}}}{f_{\rm{s}}}\quad ,$$
 $${D_{\rm{e}}} = {D_{\rm{l}}}{f_{\rm{l}}} + k \cdot {D_{\rm{s}}}{f_{\rm{s}}}\quad ,$$
where f s is the mass fraction of solid, k is the partition coefficients, D s and D l are the diffusion coefficients of the solid and liquid, respectively.
Density inversion can be given by
 $$\left( {{{\Delta \rho } \over {{\rho _0}}}} \right) = {\beta _{\rm{T}}}(T - {T_{\rm{l}}}) + {\beta _{\rm{C}}}({C_{\rm{l}}} - {C_0})\quad ,$$
where
 ${C_0}$
is the initial concentration,
 ${T_{\rm{l}}}$
is the liquidus temperature, and
 ${\rho _0}$
is the initial density in the liquid.
The TMFs were governed by the Ohms law and the Lorentz force density [Eqs. (8)−(11)],
 $${{\partial \vec B} \over {\partial t}} = - {1 \over {\mu \sigma }}\left( {{\nabla ^2}\vec B} \right) + \left[ {\nabla \times \left( {\vec u \times \vec B} \right)} \right]\quad ,$$
 $$\nabla \cdot \vec B = 0\quad ,$$
 $$\vec j = \sigma \left[ {\vec E + \left( {\vec u \times \vec B} \right)} \right]\quad ,$$
 $${\vec F_{\rm{L}}} = \vec j \times \vec B\quad ,$$
where
 $B$
is the magnetic induction,
 ${F_{\rm{L}}}$
is the Lorentz force density, j is the current density, E is the electric field, and σ is the electrical conductivity.
C. Initial and boundary conditions
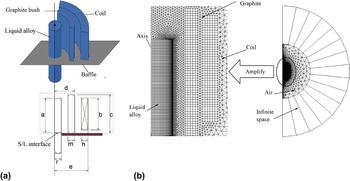
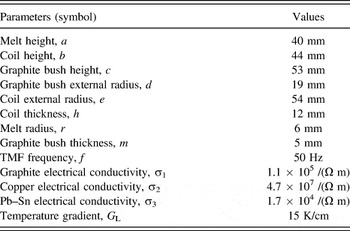
To simplify the simulation, the following assumptions were made: (i) the temperature of cooling water keeps constant during the process of directional solidification; (ii) the melt is incompressible Newton fluid; (iii) the flow remains laminar in the liquid. The mesh partitioning of the 2D axisymmetrical model is shown in Fig. 2(b), where Fig. 2(b) is the mesh partitioning of coil, graphite, sample, and air space around the vacuum Bridgman system. Physical parameters of the FEM model are presented in Table I.
Schematic representations of the computational domains and the meshes: (a) geometry of the computational domains; (b) mesh division of the melt, graphite bush, coil, and air space around the vacuum Bridgman system.

Physical parameters of the FEM model.

The magnetic field and Lorentz force are calculated by ANSYS software. Then, the solidification and melting model, laminar model, and species transport model are used to calculate the convection in FLUENT software. The calculation of fluid flow is performed by applying the laminar model in liquid. Solidification and melting model can be used to solve fluid flow problems involving solidification and/or melting taking place at one temperature (e.g., in pure metals) or over a range of temperatures (e.g., in binary alloys). Instead of tracking the liquid–solid front explicitly, solidification and melting model uses an enthalpy-porosity formulation. The mushy zone is treated as a porous zone with porosity equal to the liquid fraction, and appropriate momentum sink terms are added to the momentum equations to account for the pressure drop caused by the presence of solid material. Species transport model offers two models for species segregation at the micro-scale, namely, the lever rule and the Scheil rule. In this work, Scheil rule can be used in simulation. Lorentz force induced by TMF in the melt is added to the source term of Navier–Stokes equations.
At the top surface of the sample, the “no shear stresses” (slip) condition is considered. The flow velocities at the mold wall and at the solidification interface are set to no-slip. In this paper, the material data of Pb–Sn used in this simulation are obtained in Ref. Reference Karagadde, Yuan, Shevchenko, Eckert and Lee15. The SIMPLEC algorithm is applied to solve the coupled equation of pressure and velocity, which has good convergence. The convective terms were approximated by using a 2nd order upwind scheme for Eq. (1), a 3rd order QUICK scheme for Eqs. (2) and (3), and a 2nd order upwind scheme for Eq. (4). The mesh in the melt consists typically of 434,560 control volumes. The analysis was performed on a HP Z820 workstation.
III. RESULT
A. Experimental results
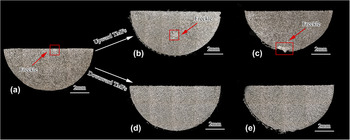
Figure 3(a) shows the microstructure of sample cross section without any magnetic field. Figures 3(b) and 3(c) show the microstructures of sample cross section under an upward TMF of B = 10 mT and B = 50 mT, respectively. By comparing with that of no TMF [Fig. 3(a)], it can be observed that the application of an upward TMF has influence on freckles distribution. The locations of freckles are diverted from the central regions to the surface of the sample, with the increase of upward TMF intensity. Figures 3(d) and 3(e) show the microstructures of sample cross section under a downward TMF of B = 10 mT and B = 50 mT, respectively. It is interesting to see that freckles disappeared under downward TMF.
Cross sections in the Pb–33 wt% Sn samples of 12 mm diameter with the TMF of (a) no TMF, (b) upward and B = 10 mT, (c) upward and 50 mT, (d) downward and 10 mT, (e) downward and 50 mT.

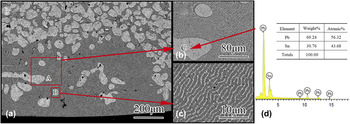
Figure 4(a) shows the microstructure in the region of freckles under a 50 mT upward TMF. Isolated dendrite [Fig. 4(b)] and laminar eutectic structure [Fig. 4(c)] are observed in the region of freckles. The composition of such location of isolated dendrite [Fig. 4(b)] is analyzed by energy dispersive spectrometer (EDS) in Fig. 4(d). There is little difference between the composition of isolated dendrite and the initial composition, which implies that the white phase is dendrite in the initial stages of solidification fused by convection. Similar microstructures in the region of freckles without any magnetic field were presented in Ref. Reference Tewari, Shan and Song16.
SEM image of Pb–Sn alloy under 50 mT upward TMF: (a) freckle region; (b) SEM image by A; (c) SEM image by B; (d) EDS results of the phases denoted by C in Fig. 4(b).

B. Numerical results
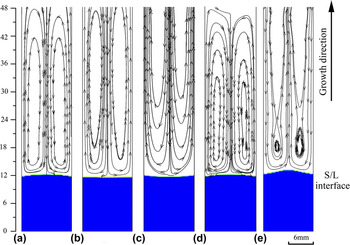
Simulation results of interface shapes and flow patterns at different TMF conditions are shown in Fig. 5. It can be seen that interface shape is slightly convex in the case of no TMF. When an upward TMF is applied, the interface shape switches from convex to concave [Figs. 5(b)–5(c)]. Conversely, the deformation of convex interface increases as a downward TMF is applied [Figs. 5(d)–5(e)]. There exist two symmetrical vortexes ahead of the interface under different TMF conditions. Except that under 50 mT downward TMF where two vortexes were observed in anticlockwise direction ahead of the interface [Fig. 5(e)], the directions under other conditions are the opposite [Figs. 5(a)–5(d)].
Velocity streamlines and solidification interface at the different TMF (V = 15 μm/s). (a) No TMF, (b) upward, B = 10 mT, (c) upward TMF, B = 50 mT, (d) downward, B = 10 mT, (e) downward, B = 50 mT.

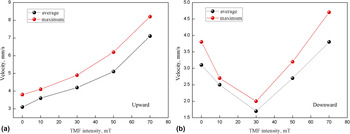
The relationship between the flow velocity ahead of solidification interface and different TMF intensities is shown in Fig. 6. It can be seen that the flow ahead of the solidification interface can be intensified by the upward TMF. However, as the downward TMF intensity increases, the average velocity near the solidification interface decreases at first and then increases. It is observed that there exists a critical turning point in this curve. Under a 30 mT downward TMF, the weakest flow is formed and the average and the maximum velocity ahead of solidification interface are 1.7 mm/s and 2.1 mm/s, respectively. Namely, the flow driven by such downward TMF is much less than that driven by natural convection as the downward TMF intensity increases to 30 mT.
The relationship between the velocity ahead of solidification interface and TMF intensity: (a) upward; (b) downward.

IV. DISCUSSION
During directional solidification, the flow velocity ahead of solidification interface and interface shapes changed due to the TMF. The macrostructures of the samples, the flow velocity ahead of solidification interface, and the interface shapes under different TMF conditions are displayed in the previous part. Based on these results, the influences of the TMF direction on freckle formation are investigated.
A. Influence of upward TMF
In this part, the convection intensity is characterized by a Reynolds number (Re), which is expressed as Re = Vd/υ, Reference Noeppel, Ciobanas, Wang, Zaïdat, Mangelinck, Budenkova, Weiss, Zimmermann and Fautrelle17 where V, d, and υ are flow velocity, sample diameter, and kinematic viscosity, respectively. In the case of no TMF, the Reynolds number is equal to 32.5. The convection intensity ahead of solidification interface can be controlled by the TMF, and the TMF is characterized by a Lorentz forcing parameter F, which is expressed as F = σωkB 2 R 2/8, Reference Wang, Shen, Yin, Du, Xiong and Fu18 where σ, ω, k, B, and R are the electrical conductivity of the sample, the frequency of the TMF, the wave number, the TMF intensity, and the sample radius, respectively. Meanwhile, we use F+ (or F−) for all cases in which the TMF is upward (or downward).
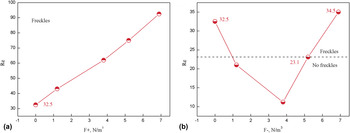
Figure 7 shows the relationship between Reynolds number and F. By comparing with the case of no TMF, the application of an upward TMF is found having effect on the Reynolds number. It can be seen in Fig. 7 clearly that as F+ is increased to 6.9 N/m3, the Reynolds numbers increases correspondingly to 92.5. Meanwhile, there exist critical points for Reynolds number (Recrit) and freckles can only be formed as the Reynolds number exceeds the Recrit. Numerical results show that the convection intensity is enhanced by the upward TMF. As freckles are already observed in the case of no TMF, it is believed that they should also be formed under the upward TMF. It can be seen from above experimental results that freckles are all formed under the different upward TMF and this is also consistent with the deduction.
Reynolds number varied with F. (a) F+ (upward), (b) F− (downward).

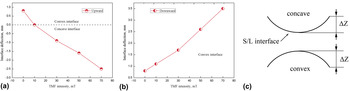
Moreover, the above experimental results indicate that the application of an upward TMF is capable of changing the distribution of the freckles. Such phenomenon could be attributed to the effect of TMF on different interface shapes. In Copley’s investigation, Reference Copley, Giamei, Johnson and Hornbecker19 the freckles appeared preferentially at the central region when the interface shape was convex. Alternatively, freckles are formed preferentially at the outside surface of the sample, when the interface shape was concave. In this paper, phenomena similar to that proposed by Copley are applied to explain the freckles distribution under different TMF conditions. Figures 8(a) and 8(b) show the relationship between interface deflection (ΔZ) and TMF intensity, respectively. The schematic diagram of interface deflection is presented in Fig. 8(c). The above experimental results showed that the locations of freckles were diverted from the central regions to the surface of the sample as the upward TMF intensity increased. Numerical results showed that the interface shape was slightly convex (ΔZ > 0) and freckles were formed at the central region in the case of no TMF. However, when an upward TMF was applied, the interface shape switched from convex to concave (ΔZ < 0) gradually [Fig. 8(a)] and freckles were observed at the surface of the sample.
Interface deflection varied with TMFs. (a) Upward, (b) downward, (c) schematic diagram of interface deflection.

B. Influence of downward TMF
More interestingly, no freckle has been observed under the downward TMF in our experiment. This should be attributed to the application of the downward TMF on the convection intensity. In the case of no TMF, TMF forces are not activated and only the buoyancy convection in the melt is presented in Fig. 5(a). Meanwhile, melt flows downwards in the center and upwards near the surfaces. By increasing the F− to 1.2, we get Reynolds numbers equals 21 in Fig. 7(b). While keeping on increasing the F− to 3.8, we get Reynolds numbers equals 11.2 (the Rayleigh number of this case was much lower than the case with no TMF). However, the Reynolds numbers equal 34.5 (higher than 32.5) as the F− increases from 5.4 to 6.9. Namely, the trend of Reynolds numbers takes on V-shaped feature as the downward TMF intensity increases. It is easily understood that if the downward TMF joins, the natural convection can be counteracted by the flow driven by a downward TMF. Then, the flow driven by a downward TMF is much powerful than the natural convection when the downward TMF intensity increases continuously. The flow driven by a downward TMF plays a prominent role in this time. As a result, the convection intensity can be increased again [Fig. 7(b)]. But the flow direction of this case [Fig. 5(e)] is just the opposite as that of the rest cases [Figs. 5(a)–5(d)]. Similar results were obtained by Yesilyurt et al. Reference Yesilyurt, Motakef, Grugel and Mazuruk20
C. The effective gravity acceleration
Freckle is a very serious defect due to gravity but it could be eliminated under microgravity. Melt flow can be controlled by the TMF, according to the analysis of the previous sections. The effects of TMF on melt flow are very similar to that of gravity; therefore, the effective gravity acceleration can be used to describe the effects of TMF. The effective gravity acceleration can be given by Reference Min, Shen, Feng, Wang, Wang and Fu21
 $${g_{\rm{e}}} = M{\left[ {{{\lambda \left( {{g_{\rm{e}}}} \right)} \mathord{\left/ {\vphantom {{\lambda \left( {{g_{\rm{e}}}} \right)} {{\lambda _0}}}} \right. \kern-\nulldelimiterspace} {{\lambda _0}}}} \right]^{ - 7}}\quad ,$$
where
 $M$
is a constant related to the buoyancy-driven convection.
The primary dendrite spacing under diffusive condition can be given by Reference Hunt and Lu22
 $${\lambda _0} = {{0.07798\Gamma kV{\prime ^{\left( {a - 0.75} \right)}}{{\left( {V\prime - G\prime } \right)}^{0.75}}\,G{\prime ^{ - 0.6028}}} \over {\Delta T}}\quad ,$$
where
 $$G\prime = {{G\Gamma k} \over {\Delta {T^2}}},\quad V\prime = {{V\Gamma k} \over {D\Delta T}},\quad \Delta T = {m_{\rm{l}}}{C_0}{{\left( {1 - k} \right)} \mathord{\left/ {\vphantom {{\left( {1 - k} \right)} k}} \right. \kern-\nulldelimiterspace} k}\quad ,$$
 $$a = - 1.131 - 0.1555{\log _{10}}\left( {G\prime } \right) - 0.7589{\left[ {{{\log }_{10}}\left( {G\prime } \right)} \right]^2}\quad ,$$
where
 $\Gamma$
is the Gibbs–Thomson coefficient, k is the solute partition coefficient, ΔT is the temperature difference between the equilibrium liquidus and solidus, D is the solute diffusivity in melt, C
0 is the alloy composition, G is the temperature gradient in the melt, and V is the drawing speed during solidification.
The primary dendrite spacing under convective condition can be given by Reference Steinbach23
 $$\lambda \left( {{g_{\rm{e}}}} \right) = {\lambda _0}{\left( {{{\Delta \rho } \over {{\rho _0}}}{{\lambda _0^2{l_0}{g_{\rm{e}}}} \over {{D_{\rm{l}}}v{\rm{R}}{{\rm{e}}_{{\rm{crit}}}}}}} \right)^{ - 1/7}}\quad {\rm{upward\ TMF}}\quad ,$$
 $$\lambda \left( {{g_{\rm{e}}}} \right) = {\lambda _0}{\left( { - {{\Delta \rho } \over {{\rho _0}}}{{\lambda _0^2{l_0}{g_{\rm{e}}}} \over {{D_{\rm{l}}}v{{{\mathop{\rm Re}\nolimits} }_{{\rm{crit}}}}}}} \right)^{{1 \mathord{\left/ {\vphantom {1 2}} \right. \kern-\nulldelimiterspace} 2}}}\quad {\rm{downward\ TMF}}\quad .$$
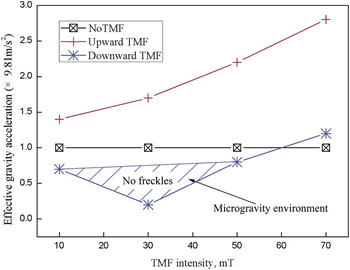
In case of no TMF, the value of g e is set as 1, the average primary dendrite spacing could be obtained in Fig. 3. As a result, the value of M could be obtained using Eq. (12). Then, g e could be obtained at different TMFs. The relationship between g e and TMF intensity is shown in Fig. 9. It can be observed that the effective gravity accelerations under an upward TMF are well above g. The effective gravity acceleration has risen as the upward TMF intensity increases. However, under an upward TMF, the microgravity environment can be established with B ≤ 50 mT. The convection intensity at front of the dendrite tip becomes weaker accordingly, as the gravity decreases.
Effective gravity acceleration varied with TMF intensities.

The convection intensity in front of the dendrite tip is the key factor in freckle formation. The thickness of the solute boundary layer may be changed by the convection ahead of solidification front, thereby changing the dendrite growth rate correspondingly. Reference Trivedi, Miyahara, Mazumder, Simsek and Tewari24 In previous studies, the overgrowth of dendrite is one of the main causes of freckles. Reference Yuan and Lee25 If the flow persists, the overgrowth forms, leading to freckles in the final microstructure. Four distinct stages can be identified in Fig. 10 and five dendrites are marked 1–5. Firstly, dendrites grow evenly as shown in Fig. 10(a). Then, the flow ahead of interface brings solute enriched interdendritic liquid upwards, broadening the solute field around tips of 3 and 4. This reduces the tip undercooling and the tip growth velocity [Fig. 10(b)]. As solidification proceeds, solute enriches gradually between 2 and 5, which can restrict 3 and 4 growth in the solute channel [Fig. 10(c)]. Finally, the lighter element can rise as solute enrichment intensifies when the buoyancy exceeds the viscous resistance force. As a result, an upward flow between 2 and 5 is established, as seen in Fig. 10(d). In this work, the overgrowth of dendritic can be formed hardly with g e ≤ 0.82. Naturally, the less or even no freckles are formed in the sample caused by the moderate downward TMF intensity. A downward TMF eliminates the freckles by suppressing natural convection, thus it can play a similar role in superalloys. However, due to the different physical parameters of the superalloy and Pb–Sn alloy, the natural convection intensity and pattern in the liquid are different. So, this technique can also control freckle in superalloys by appropriately adjusting the TMF.
Schematic of freckles channel formation: (a) initiation, (b) overgrowth, (c) channel stabilization, (d) density inversion.

V. CONCLUSIONS
Effects of TMF on freckle formation in directionally solidified Pb–33 wt% Sn alloys were investigated experimentally and numerically. It has been observed in experiments that the locations of freckles are diverted from the central regions to the surface of the sample as the upward TMF intensity increases. While numerical results indicate that this phenomenon should be attributed to the interface shape variation. However, freckles were found disappeared in samples under downward TMF in experiments. In this sample, numerical results shown that the natural convection can be counteracted by the flow driven by a downward TMF with B ≤ 50 mT, forming a microgravity environment. These investigations have clearly described that it is possible to control and eliminate freckles in Pb–Sn alloys by means of a suitable TMF during directional solidification.
ACKNOWLEDGMENTS
This research work was supported by the National Basic Research Program of China (Grant No. 2013CB035703), the Natural Science Basic Research Plan in Shaanxi province of China (No. 2016JQ5018), and the Scientific Research Program funded by Shaanxi provincial education department (No. 16JK1538). The authors are grateful for the grants.