As a mechanism ensuring accountability of the governors to the governed, elections constitute one of the defining features of democracy. Election results shape government composition and policy outputs, most likely to the advantage of voters who support the winning parties. Previous studies have addressed the gap between electoral winners and losers on various dimensions of political support, from specific institutional evaluations to more diffuse aspects concerning democratic principles and procedures,Footnote 1 and found that winners express significantly greater support than losers at each level. However, these works define winners and losers in a static fashion by examining their attitudes at only a single time-point, and employ a dichotomous categorization that does not capture possible variations within each group. In this study, we take into consideration both the past history of winning or losing on present attitudes, and the impact of ideological distance from the government on a commonly used indicator of political support, namely satisfaction with democracy.
Since winners stand behind parties or candidates currently holding the reins of power, it would come as no surprise that they express greater satisfaction with political authorities and institutions. As a corollary, one expects their satisfaction to decline if their parties lose power. However, in democratic polities winners have no stronger claim as ‘owners’ of the political system than losers, since by definition democratic elections permit the fortunes of both current winning and losing parties to fluctuate at the ballot box, and thus offer losers the possibility of winning in the future. It follows that a distinction exists not only between present winners and losers, but between voters who have previous (especially recent) experience of winning and those who do not. The former should express greater approval in the political system, even if their parties are currently in opposition, since the system has worked to their benefit, whereas the latter have little cause for satisfaction because their parties have long been excluded from power. In short, our study takes a dynamic view in defining winners and losers, taking into account not only present status but also experience in the recent past, and demonstrates that both current winners who had lost in the previous election and current losers who had won in the previous election are more satisfied with democracy than voters whose parties have not won before.
In addition to a static definition of winners and losers, most extant literature also treats both categories as homogeneous entities, an approach that neglects probable variations within each group. Assuming policy as one of the crucial factors influencing satisfaction levels, we argue that not all winners can equally expect to see their preferred policies implemented, and some winners (losers) may derive greater policy benefits from the government than others. Therefore, we expect that, for both winners and losers, levels of satisfaction depend on how closely the government's preferences align with their own. For example, under a socialist–communist coalition government, socialist winners may see more of their goals turned into policy outputs than communist winners, and social democratic losers who are closer to the government in policy terms may have less cause for dissatisfaction than conservative losers. In short, our study takes a step beyond the simple dichotomous categorization of winners and losers to consider the policy distance between individual voters and the government mean and shows that ideological distance exerts a significant impact on satisfaction with democracy.
The study is organized as follows. In the following two sections, we review the literature on political support and the winner–loser gap, and present the two central arguments of our article, the policy performance and dynamic effect hypotheses. We then introduce data and measurements, including details on individual- and aggregate-level control variables. Next, we present and analyse findings on both hypotheses, and conclude by discussing the implications of our results.
Conceptualizing democratic support
According to Easton,Footnote 2 citizens’ evaluation of the institutions and its components (parties and political actors) as well as their identification with the state comprise fundamental elements of political support. He also distinguishes between three political objects – the political community, the regime and the authorities – in terms of diffuse and specific support. The former refers to loyalty to one's own political community, while the latter is based on the fulfilment of demands or satisfaction with outputs. Whereas diffuse support is more stable, specific support is susceptible to fluctuation depending on the performance of political institutions and actors. Norris and Dalton refine the Estonian framework by distinguishing five levels of political support.Footnote 3 Specifically, they take into consideration three different objects at the regime level: in discussing democracies, regime principles express the normative values of the political system, reflected in the belief that democracy is the best form of government;Footnote 4regime performance refers to democratic processes;Footnote 5 and regime institutions denote confidence in political institutions. Previous studies found that electoral winners are more trusting of institutions such as the electoral commission, the courts, the policeFootnote 6 and the bureaucracy.Footnote 7 Concerning performance, winners are more inclined to believe that government can be trusted to do the right thing and carry out its functions in the interests of all citizens.Footnote 8 Finally, winners generally offer a more positive assessment of how democracy works.Footnote 9 It is important to note that losers’ consent towards principles underlying the regime, or ‘regime-based trust’, arguably affects the long-term viability of democracy.Footnote 10
In this study we use satisfaction with democracy as an indicator at the regime performance level of political support. According to Norris, satisfaction with democracy is indeed an indicator of ‘public evaluations of how well autocratic or democratic governments work in practice’.Footnote 11 Although ‘satisfaction with democracy’ is one of the most commonly utilized indicators of political support, its interpretation has not always been clear. On one hand, some scholars claim its use is complicated,Footnote 12 and its meaning appears somewhat ambiguous.Footnote 13 On the other hand, different indicators have been used by various authors in order to operationalize this concept.Footnote 14 These debates notwithstanding, we can consider democratic satisfaction as an expression of short-term evaluation of system outputs,Footnote 15 and as a useful measure of the discrepancy between democratic norms and actual processes.Footnote 16
Exploring the winner/loser effect (and its political implications)
In the past decade a large number of works have analysed the determinants of satisfaction with democracy, using both individual and aggregate data.Footnote 17 One factor that has received increasing attention is how individuals who support parties in government (winners) and those who support parties in opposition (losers) differ in support for democratic processes and outputs. Although many studies have stressed the declining role of political parties at least since the end of the 1960s, parties still appear to have the capacity to influence citizens’ political viewsFootnote 18 and determine ‘who gets what, when, and how’ in a given polity,Footnote 19 since parties remain key players in government formation and decision making. As both channels of political engagement beyond the ballot box and the proportion of citizens inclined towards direct participation have markedly expanded in recent years, parties may cede part of their interest articulation role, but continue to serve a crucial interest aggregation function.Footnote 20 Since parties are still largely responsible for policy making, voters concerned with policy outcomes should have an important stake in, and feel affected by, whether their preferred parties win or lose. In this sense, if citizens decide to vote for party A, it is because they believe it can better respond to their demands, satisfy their goals and reflect their values. Since voters prefer victory to defeat, an election outcome may affect attitudes towards not only specific political authorities, but also the democratic process in general. When a voter chooses a party (or a candidate) that wins the election or at least enters into a coalition government, she expresses greater confidence in the government,Footnote 21 which in turn translates into higher satisfaction with democracy.Footnote 22 Exactly the opposite tendency characterizes election losers, who are almost always less satisfied with the way democracy works than winners.Footnote 23
Losers’ discontent may affect the quality, even stability, of democracy. Hence, Anderson et al. refer to losers as ‘the crucial veto players of democratic governance’,Footnote 24 and Nadeau and Blais also argue that ‘the viability of electoral democracy depends on its ability to secure the support of a substantial proportion of individuals who are displeased with the outcome of an election’.Footnote 25 One should also note the risk that winners may be too compliant towards the government, to the extent of being willing to overlook violations of democratic principles.Footnote 26
Yet the relationship between winner/loser status and satisfaction with democracy is neither immediately self-evident nor straightforward. To examine this causal linkage in more detail, we focus on two different aspects that have been largely overlooked in the literature.
The Absolute and Marginal Dynamic Effect
First, the winner/loser effect can present a dynamic pattern given that in a democracy today's winners could be yesterday's losers, and vice versa. Scholars have rarely examined this question directly. In one of the few exceptions, Anderson and LoTempio analyse whether backing presidential and congressional winners has a cumulative effect on levels of political trust among American voters.Footnote 27 Using data from the 1972 and 1996 American presidential and congressional elections, they found that those who voted for the presidential winner were significantly more trusting than those who did not. In contrast, voting for the congressional majority party did not affect levels of political trust. Moreover, double-winners express the highest level of trust, and winners in only the presidential or congressional contest were more trusting than double losers.
However, in modelling the dynamic pattern involved in the winner/loser dichotomy, it seems more natural to compare the status of being a winner in the present election with that of being a winner in the previous election. This implies that in a presidential system, we should compare the results across two consecutive presidential races,Footnote 28 while in parliamentary systems results of two successive legislative elections should be compared.
This dynamic can be viewed and analysed from two alternative perspectives: an ‘absolute’ pattern on one side, and a ‘marginal’ one on the other. This difference relates to how past (present) experience affects present (past) attitudes. If we assume that people prefer more to less, including in terms of views towards the political system, then we can expect that winning more should lead to higher levels of satisfaction with democracy than winning less. Conversely, those who experience only losses should be the least satisfied, those who experience only victories should be the most satisfied, and those who experience some loss and some gain across elections should fall in between. Moreover, among citizens in the middle category (mixed electoral results), we expect that those who won in the latest election (but lost in the previous one) express greater satisfaction with democracy than those who won in the past but lost in the most recent round. This makes sense if we assume that individuals discount more distant personal experience compared to more recent ones. Let WW stand for a double-winner (i.e. who voted both in the present and previous elections for a winning party/candidate), and LL a double-loser, with WL as someone who won in the present election but lost in the previous one, and LW a person who lost in the present election but won in the past. Our discussion leads to the expectation that in terms of satisfaction with democracy, we should find the following lexicographic ranking:
HYPOTHESIS 1A: The ‘absolute’ dynamic impact (ADI) of winning, WW > WL > LW > LL.
However, the dynamic pattern involved in the winning/losing effect can also be analysed from a different perspective, which focuses more on its marginal than on absolute consequences. That is, it can be reasonably assumed, following the standard theory of utility, that citizens derive a decreasing marginal utility in winning (and, for similar reasons, an increasing marginal disutility in losing).Footnote 29 In other words, what could really matter for voters is having their views represented by the government at least once. If this happens, then the relationship between winning (losing) in the present and past is no longer an additive relationship (as previously assumed), but a conditional one instead. Consequently, the impact of winning today should matter more for those who have not enjoyed this experience in the recent past, and vice versa for losers who have never tasted defeat heretofore. In contrast, for voters who have previously been winners, winning today should matter far less in influencing their degree of satisfaction with democracy. Therefore, we can derive the following hypothesis regarding the dynamic nature of the winner/loser effect:
HYPOTHESIS 1B: The ‘marginal’ dynamic impact (MDI) of winning. The marginal effect of winning in the current (previous) election should matter more for citizens who lost in the previous (current) election.
Important implications can be drawn from which of the two dynamic effects is more appropriate for explaining the impact of winner/loser status. On one hand, if the ‘true’ dynamic impact is a marginal one, then a political framework that experiences frequent cabinet alternation represents the most favourable scenario to facilitate the diffusion of satisfaction with democracy, given that it will increase the proportion of the electorate that has experienced winning. On the other hand, if the absolute dynamic proves more significant, then this would not necessarily be the case.
The Policy Effect
Previous studies on the relationship between winner/loser status and satisfaction with democracy also portray voters’ assessments of electoral results as basically a zero-sum game. In other words, it is hypothesized that those who backed winning candidates will be more satisfied than those who backed losing candidates regardless of other conditions. Yet we know that even parties and voters on the same side of the winner/loser dichotomy can hold different ideological positions, and this could clearly affect political satisfaction. According to the large body of literature on the spatial theory of voting, voters are assumed to vote for the party presenting the policy programme closest to their policy preference.Footnote 30 Indeed, voters are expected to derive utility from the package of policies implemented by the future government as a function of the distance between this package and their ideal points: the shorter this distance is, the higher their utility. If proximity models can explain voters’ choices at the ballot box, then it is reasonable to assume that they can also make similar assessments when evaluating democratic performance. Following Henderson, we expect that for voters who backed losing parties, the closer the eventual winner is to their own ideological position, the more satisfied they would feel.Footnote 31 This is because disutility in terms of policies implemented by the government is lower, which assuages the negative impact of being a loser on satisfaction with democracy. Exactly the opposite should happen with winners. In sum, greater distance between voters and the winning party exacerbates the winner/loser disparity, while this gap can be minimized given ideological propinquity. Therefore, we present our second hypothesis:
HYPOTHESIS 2: The policy effect (PE) of winning. Winners (losers) who are closer to the ideal point of the current government will be more satisfied with the way democracy works than winners (losers) who are located farther away.
Clearly, the cabinet's position on the underlying ideological dimension of political competition matters in this regard. Indeed, as long as the distribution of voters is approximately symmetric around some central value, as is usually the case,Footnote 32 then a cabinet that takes a position close to that value (rather than a more radical position) is able to minimize the average distance between itself and the entire electorate irrespective of voters’ winner/loser status. According to Hypothesis 2, this should raise the overall level of satisfaction with democracy.
Before examining the validity of our hypotheses, the next section provides detailed information needed for our empirical analysis.
Data and measurement issues
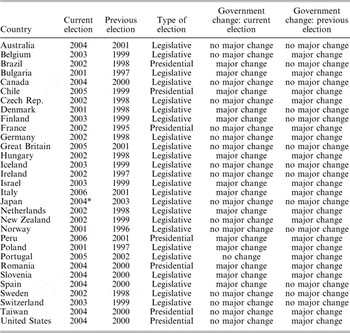
To control for our hypotheses we use the second module (2001–06) of the Comparative Study of Electoral Systems (CSES) project.Footnote 33 This dataset employs exactly the same battery of questions across countries, and constitutes the largest single source of available cases. In particular, we include in our analysis all countries rated as free by Freedom House both at the time the election covered by the survey was held, and at the time of the previous election (this is necessary given that we compare the winner/loser effect in both the current and the previous elections). This leaves us with thirty-one countries (see Table 1) covering not only Western Europe, but also Eastern Europe, South America and Asia.Footnote 34
Countries and Elections Covered in the Study

*All legislative elections in bicameral systems refer to the lower chamber, except Japan 2004 (upper house – Japanese House of Councillors – election).
Data source for the government change variable: Philip Keefer, DPI2006, Database of Political Institutions: Changes and Variable Definitions (Washington, D.C.: World Bank, 2007).
Another advantage of using CSES data is that questionnaire items include the necessary information needed to construct our variables. In particular, we know: (a) the parties (or presidential candidates) for which respondents voted in the current and previous elections; (b) respondents’ self-placement on an eleven-point left–right scale;Footnote 35 (c) placements of political parties (or presidential candidates) on the same scale.Footnote 36
Using the information coming from (a), we can classify a citizen's winner/loser status in both the current and previous elections. A respondent is considered a current winner if she voted for a party that belonged to the cabinet at the time when the CSES survey was administered (and the information regarding the level of satisfaction with democracy was recorded). In most cases this coincides with the first post-election cabinet. A past political winner is estimated in a similar way. In this case, however, we consider all the parties that entered cabinet during the life of the previous legislature.Footnote 37
Columns 2 and 3 in Table 1 list years for the current and previous elections under analysis, while column 4 shows the type of election (legislative or presidential). Finally, column 5 reports whether there has been any major government change (or intergovernmental change) following each of the two elections considered.Footnote 38 Quite interestingly, in countries that did not experience any major governmental change in the current election, only 22 per cent of respondents who were losers in the previous election emerged as winners in the current one. In contrast, in countries that saw a major governmental change in the current election, this percentage trebles to 65 per cent. This difference points to a well-known stability in voting behaviour. Therefore, in this situation crossing the winner/loser divide is usually due to changes in party fortunes rather than individual partisan preference.Footnote 39
To test the impact of ideology, we construct a measure of spatial distance (labelled ‘DISTANCE’) between voters and government. The fact that party and voter locations on the left–right scale are calculated from the same data source eliminates problems of comparability between voter and party placements.Footnote 40 Our DISTANCE variable (i.e., the spatial distance between elector i and cabinet j) is estimated in the following way:

where: xij = the ideal point of elector i in country j along the left–right spectrum;  = the position of cabinet j on the same spectrum. Specifically,
 is estimated as the average position of the cabinet parties weighted by their respective vote share. This is based on previous studies having concluded that government policy positions better track the weighted mean position of cabinet parties than that of a simple average.Footnote 41
Table 2 reports the value of  across countries in our sample, together with the average value of DISTANCE differentiating the respondents according to their winner/loser status in the current election, as well as the difference among these two values, which we call the ‘winner DISTANCE advantage’. As expected, the value of DISTANCE is considerably lower among winners than losers in most cases. We also include in the table a general measure of ideological eccentricity of each cabinet, defined as the absolute distance between
 and
 (i.e., the average ideological position of respondents in country j). The correlation between this measure and the ‘winner DISTANCE advantage’ is 0.71. This implies that the more the left–right position of a cabinet diverges from the ideological centre of voter distribution within a given country, the more the average overall value of DISTANCE increases.
Cabinet Left-Right Position and Average Ideological Distance between Respondent and Cabinet Means

Data source: Comparative Study of Electoral Systems (CSES) project.
Our dependent variable is respondents’ level of satisfaction with democracy (SWD). Following a number of previous studies, this concept is measured by the question: ‘On the whole, are you very satisfied (1), fairly satisfied (2), not very satisfied (3) or not at all satisfied (4) with the way democracy works in [country]?’ We reversed the original coding so that higher values correspond to greater satisfaction with democracy.
Since our dependent variable is a four-point scale, a linear regression assuming interval-level measurement is not an appropriate method of analysis. An alternative strategy would be to collapse the four original categories to create a binary variable. However, this option would mean forfeiting potentially useful information.Footnote 42 Moreover, note that our dataset is hierarchically organized, with one level (individual respondents) embedded within another level (countries). Ignoring this multilevel character of the data could affect the validity of our estimation.Footnote 43
To deal with these methodological concerns, we decided to use a multilevel ordered logistic model. This model takes the ordered nature of our dependent variable into consideration, and also allows for each observation to be correlated within country. We believe this is the most appropriate method to address the particular structure of our data directly.
In any ordered logistic model, including a multilevel one, an underlying score (or latent variable) is estimated as a linear function of the independent variables and a set of cut points (or thresholds). Therefore, the probability of observing a given outcome corresponds to the probability that the estimated linear function is within the range of the cut points estimated for the outcome. In our case, there are four possible categories (not at all satisfied, not very satisfied, fairly satisfied, very satisfied). We are interested in identifying at which point on the latent scale the category ‘not very satisfied’ changes to ‘fairly satisfied’ (and similarly for the other categories). This is what we mean by ‘cut point’.
The equation that we have estimated is as follows:Footnote 44

where:  is the probability that respondent i living in country j expresses a level of satisfaction with democracy higher than the threshold s;
 is a dummy variable that assumes a value of 1 if citizen i living in country j voted for a winning party/candidate in the current election;
 is a variable that measures the distance between citizen i and the current government's policy preference in country j according to Equation 1;
 is a dummy variable that assumes a value of 1 if citizen i living in country j voted for a winning party/candidate in the previous election; wij are vectors of individual-level control variables (see below); zj are vectors of country-level control variables (see below);
 is the overall intercept of the cumulative logits varying over countries j;
 is the error term unique for each i; ks are the thresholds of the ordered logit (3 in our cases: that is, the number of categories in our dependent variable minus 1).
The two interaction terms presented in Equation 2 are crucial for testing our hypotheses. In particular, according to Hypothesis 2, the marginal effect of being a winner in the present, that is,  , should increase (decrease) as the value of
 decreases (increases). In other words, we expect a negative and significant β 3 coefficient. However, the second interaction term presented in Equation 2, i.e.,
 , allows us to explore two possible alternative dynamic effects of winning. A significant and negative β 5 coefficient would alert us to the existence of a marginal dynamic impact, while any absolute dynamic impact should be highlighted by a positive and significant coefficient for β 1 and β 4 but not for β 5.
Figure 1 summarizes our data by plotting the average percentage of respondents who express satisfaction with democracy in each country (ranked by the magnitude of this percentage). Overall, 64 per cent of respondents indicate satisfaction. However, we can observe considerable cross-national variation: positive responses range from 28 per cent in Bulgaria up to 95 per cent in Denmark.
Satisfaction with democracy Note: Average of ‘very satisfied’ plus ‘fairly satisfied’.

Control variables
It is necessary to control for a number of variables at both individual and country levels that have been found significant in the large empirical literature on the determinants of satisfaction with democracy.Footnote 45 With respect to the micro level, in addition to socio-demographic factors (for example, gender, age, education), we also include variables measuring the existence of respondents' party identification (a dummy variable coded 1 if the respondent considered herself close to a party and 0 otherwise) and evaluations of the government's overall performance, to ensure that the winner/loser variable is not simply a proxy for the effect of partisanship or a general identification with those in power. Furthermore, we control for three variables related to the political behaviour of the respondents: we include dummy variables on whether a respondent voted in the current election, attempted to persuade others to vote for a particular party or candidate, and took part in protests or demonstrations.Footnote 46 The last two individual-level variables relate to respondents’ general political attitudes: how much respondents believe that the people in power could make a difference, and that democracy is better than any other form of government.
On the aggregate (i.e., country) level, we control for the following variables:
(a) Quality of formal institutions. Institutions that promote the quality of resource allocation and provision of public goods should increase satisfaction with democracy. We take institutions to broadly mean ‘rules of the game in a society’,Footnote 47 and use as our proxy an indicator on the enforcement of the rule of law in each country.Footnote 48
(b) Economic performance. The worse (better) a country's overall economic performance, the lower (higher) satisfaction with democracy should be. We include two economic indicators: the average growth in gross domestic product (GDP) in the last five years and the DEVIATION OF GDP growth in the year immediately preceding the survey from this five-year average. This allows us to record the impact of last year's change in GDP above and beyond its contribution to the country's average GDP growth. These two variables allow us to differentiate between the short- and medium-term economic impact on satisfaction with democracy.
(c) Difference between new and established democracies. We consider a democracy as established if it did not experience any interruption in democratic status in the last twenty-five years. Spain and Portugal, which became democratic only in the 1970s, are therefore regarded as ‘old’ democracies.
(d) Distinction between parliamentary and PRESIDENTIAL systems. We include a dummy that assumes a value of 1 for the latter form of government. This is an institutional variable that has rarely (if at all) been controlled for in the literature.
(e) Majoritarian versus consensual decision making. Given that some studies found a relationship between satisfaction with democracy and the existence of an institutional framework that favours a consensual style of decision making, we include a variable that captures the strength of institutional CHECKS and balances (and therefore the diffusion of power)Footnote 49 in each country, as well as the GALLAGHER Index of Disproportionality to account for the impact of electoral rules.Footnote 50 Both variables serve as proxies reflecting the difference between consensual and majoritarian systems. Indeed, Lijphart makes the point that consensual democracies outperform majoritarian ones in terms of responsiveness and do at least as well in terms of efficiency.Footnote 51 This should lead to higher levels of satisfaction with democracy.Footnote 52 Similarly, Miller and Listhaug argue that a smaller number of parties (primarily deriving from the non-proportionality of electoral rules) is correlated with lower satisfaction with democracy because citizens have fewer policy choices.Footnote 53 In other words, system support may decline in the long run because some electoral rules inhibit the emergence of new parties that represent new demands. Thus, we expect lower levels of satisfaction in countries where the GALLAGHER Index is high.
Moreover, we also control for any mediating impact of consensual or majoritarian systems on the relationship between winner/loser status and satisfaction with democracy. It has been noted that the institutional framework in which winning and losing takes place is also important. For example, Anderson and Guillory show that opposition party supporters were likely to be less dissatisfied in consensual systems than their counterparts in presidential systems.Footnote 54 The intuition is that even losers in consensual systems can influence policy to some extent, giving winners less absolute control than in majoritarian systems. Therefore, we introduce two interaction terms in the model, between winner status in the present election and the two aforementioned proxies for consensual democracies.
The analysis
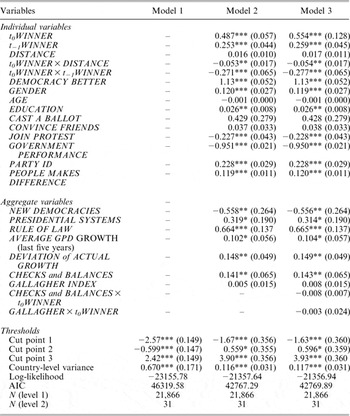
Table 3 reports the results of the three models we estimated. The first is an a-theoretical model without level 1 or level 2 predictors, which allows us to decompose the total variance in our dependent variable between individual and country levels. Through this we can estimate the so-called intra-class correlation, ρ, a measure that tells us how much of the total variation in the level of satisfaction with democracy can be explained by country-level differences only. Formally:  .
Results of Multilevel Ordered Logit on Satisfaction with Democracy

Note: Significance (two tailed): * 0.1; ** 0.05; *** 0.01.
Knowing that the variance component at the individual level ( ) in a multilevel ordered logistic model is normalized to
 , and that the value of
 , shown in the fifth to last row in the table, is 0.67, we can infer that country-level variance in our data constitutes around 18 per cent of the total variance (i.e.,
 )). This means that 18 per cent of the difference in levels of satisfaction with democracy can be explained by the fact that a respondent lives in one country instead of another. Given that the data are measured at the individual level, the fact that country-level variance is proportionally much smaller than individual-level variance is not surprising.Footnote 55 Moreover, the variance at level 2 is significant at the 99 per cent level. These results lend strong support to the utility of applying multilevel analysis to our data (and to the possible perils of neglecting their hierarchical structure).
Next, we turn to the question of whether the models we have specified can account for the variance in satisfaction with democracy, beginning with Model 2. Regarding the control variables at both individual and aggregate levels, the results largely accord with our expectations (with one exception noted below). At the individual level, respondents who are male, highly educated, possess party identification, and express a positive attitude towards democracy (believing both that democracy is better than any other form of government, and that it makes a difference who is in power) have a higher probability of being satisfied with democracy. Interestingly, both forms of orthodox political participation are insignificant. In contrast, participation in protests or demonstrations, as well as a negative assessment on the cabinet's performance, is significantly and negatively related to satisfaction with democracy. Age has no significant impact.
At the aggregate level, the quality of formal institutions (RULE OF LAW) is positively related to satisfaction with democracy. The same holds true for economic performance, albeit short-term economic performance (GDP) seems to exert greater influence than medium-term economic trends (AVG GDP). New democracies display a lower level of satisfaction than established democracies, confirming that ‘losers have not yet learned to lose in countries where democratic governance is of such recent vintage’.Footnote 56 However, direct election of the head of the executive is positively related to satisfaction with democracy, albeit only with a 90 per cent confidence interval. Finally, the checks and balance variable (CHECKS) is highly significant and positive as well, while the GALLAGHER Index has little impact.Footnote 57
We can now turn to our main hypotheses. As already discussed, the two interactive terms involving the  variable play a crucial role. Let us start with the hypothesis related to the dynamic impact of being a winner. The highly significant (and negative) coefficient for the interaction term between
 and
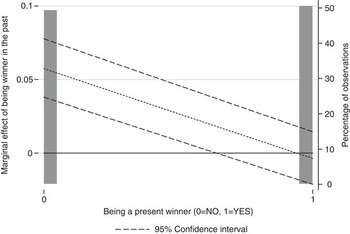
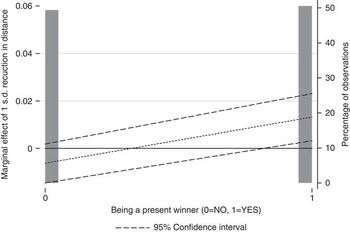
 clearly indicates the existence of a marginal (rather than an absolute) dynamic impact. Figure 2 plots the marginal effect of winning in the past as a function of
 on the probability of being fairly or very satisfied with democracy (that is,
 ), holding other independent variables (including DISTANCE) at their mean level. As the figure shows, winning in the previous election significantly and positively affects the probability of being satisfied with democracy only for losers in the present election. By contrast, there is no cumulative effect for winning in the past: being a winner in the previous election is not significant if the respondent has also won in the current election.
Marginal effect of winning in the previous election, as the status of being a present winner changes Note: Dependent variable: probability of being fairly or very satisfied with democracy.

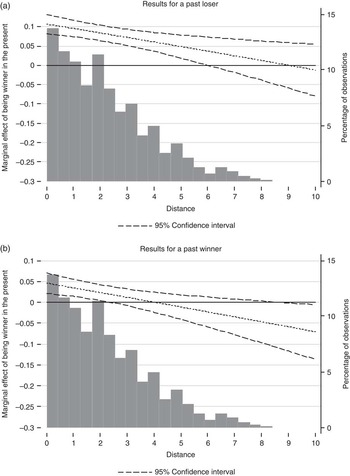
Note that in Model 3 there is a second interaction term involving  . Therefore, to assess the true marginal effect of winning in the present (and its temporal dynamic),Footnote 58 we also need to control for the value of DISTANCE, that is, for the policy benefits of winning. This is shown in Figure 3, which depicts the marginal effect of being a winner in the present on the probability of expressing satisfaction with democracy across the observed range of DISTANCE in our dataset. Moreover, in Figure 3(a) we fix the value
 at 0, while in Figure 3(b) we consider respondents who won in the previous election (that is, for
 equal to 1). We also superimpose a histogram portraying the frequency distribution for DISTANCE over the marginal effect plots (the scale for the distribution is given by the vertical axis on the right-hand side of the graph).
Marginal effect of winning in the current election, as DISTANCE as well as winner/loser status in the previous election change Note: Dependent variable: probability of being fairly or very satisfied with democracy.

From Figure 3 we can derive three main conclusions. First, for respondents who have lost in the past (Figure 3a), the marginal effect of  on the probability of being fairly or very satisfied with democracy increases as the value of DISTANCE declines. This marginal effect ceases to be significant for values of DISTANCE higher than 6, a condition nevertheless satisfied by almost all respondents in our sample (95.6 per cent). In short, among current winners who are past losers, greater ideological closeness to the government increases level of satisfaction. Moreover, the marginal effect of
 always remains significant, irrespective of the value of DISTANCE. By contrast, for respondents who have won in the past (Figure 3b), being a winner in the present matters, but only under the stringent condition of DISTANCE being less than 2. In this case, only 53 per cent of our sample meets this condition.Footnote 59
Thus, empirical results support our hypothesis that greater (less) distance between voters and the government can exacerbate (alleviate) the winner/loser disparity in satisfaction with democracy. Furthermore, it appears that a person with a consolidated record of ‘winning experiences’ must perceive the ideological position of the cabinet sufficiently close to her own in order for her winner status (in the present) to augment her satisfaction with democracy.
Here a sporting metaphor from English football may be appropriate: winning in the present is the thing that really matters if your team has had a disappointing season. However, if your team has won the previous Premier League, how skilfully your team actually plays starts to matter (increasingly) for how much pleasure you derive from supporting it. Mutatis mutandis, this also seems to apply to the relationship between satisfaction with democracy, a voter's experience of electoral victory and the relative distance between her ideological position and that adopted by her party.
Secondly, note that for any value of DISTANCE, the marginal effect of being a recent winner is clearly higher in Figure 3(a) than in Figure 3(b). For example, the marginal impact of being a winner in the present when DISTANCE equals 1 increases the probability of being satisfied with democracy by 9.6 per cent (95 per cent c.i.: 7.5–11.8 per cent) in Figure 3(a), and by three times less in Figure 3(b) (+3.3 per cent; 95 per cent c.i.: 1.4–5 per cent). This clearly confirms the marginal (rather than absolute) dynamic effect that we found in Figure 2 concerning  .
Finally, comparing the marginal effect on SWD of winning in the current election (for previous losers) and of winning in the previous election (for current losers) in Figures 2 and 3, we find similar results. In the former case, given the same values of DISTANCE, the probability of being fairly or very satisfied increases by 8.1 per cent for the former group (95 per cent c.i.: 6.2–10 per cent), and 5.7 per cent for the latter (95 per cent c.i.: 3.7–7.8 per cent). That is, voters do not seem to discount the impact of being a winner on satisfaction with democracy (provided the respondent has won only once) dramatically.
To conclude our analysis with our interaction terms, in Figure 4 we plot the marginal effect of DISTANCE depending on  while holding all other variables at their means. This figure demonstrates that the ideological distance between voters and the government also has a direct impact on satisfaction with democracy, at least so far as present winners are concerned. Indeed, decreasing DISTANCE by one standard deviation from its mean significantly increases the probability of being fairly or very satisfied with democracy for present winners, even though the substantive impact is rather modest (+1.5 per cent). Doing the same for present losers does not affect their probability of being fairly or very satisfied.
Marginal effect of DISTANCE, as the status of being a present winner changes. Note: Dependent variable: probability of being fairly or very satisfied with democracy.

We noted in the previous section that several previous works have also suggested a mediating impact of the institutional framework on the winner/loser variable. We thus add two further interaction terms in Model 3 involving present winner status and, respectively, CHECKS and GALLAGHER. This allows us to check whether the impact of  on satisfaction with democracy is mediated by the institutional context. However, neither interaction term is statistically distinguishable from 0, while the other coefficients remain quite stable between Models 2 and 3.
This is a surprising result that contradicts findings reported in previous studies. However, we should note two attenuating factors. First, insignificant results for these interaction terms may be due to inadequate proxies utilized to capture Lijphart's consensual/majoritarian index.Footnote 60 Secondly, and perhaps more importantly, the aforementioned authors conducted their analysis on a relatively small number of cases (eleven) covering only European countries in the early 1990s. These two factors are likely to account for differences between previous findings and the results shown above.
Conclusion
The present study has attempted to examine differences in democratic satisfaction between electoral winners and losers by refining the definition of these two groups. We have demonstrated that the relationship between winner/loser status and satisfaction with democracy contains both a marginal (rather than absolute) dynamic nature and policy content. Our results show not only that winning once always boosts satisfaction with democracy, but also that winning either in the recent past (i.e., in the previous election) or in the present produces a comparable effect. For repeated winners, however, satisfaction only increases if they are ideologically close to the government; otherwise the winning effect disappears. Finally, ideological proximity to the government also exerts a direct influence on democratic satisfaction, albeit not a dramatic one, when present winners are concerned.
Two substantial political conclusions can therefore be derived from our analysis. First, governments able to present policies that minimize the ideological distance between themselves and the largest number of citizens (including both winners and losers) may increase political support. The same logic suggests that a more ideologically extreme government may engender a decline in the overall level of democratic satisfaction. This relates to Powell's proposition of gauging the quality of democracy by the distance between the government and the median voter.Footnote 61 Secondly, it has been noted in the literature that power alternation can restrain corruption and rent-seeking,Footnote 62 increase economic growthFootnote 63 and strengthen the rule of law.Footnote 64 Our results show that a further advantage of cabinet alternation is that it helps to boost the overall level of satisfaction with democracy by expanding the proportion of voters who have experienced winning at least once in recent elections, either in the past or in the present.
This study has addressed short-term, specific system support as theorized by Easton, which is more prone to fluctuate with the performance of political institutions and actors. It must be noted that our dependent variable does not, and is not intended to, reflect the quality of democratic governance in each country. The related question of how electoral past and present winner/loser status influences more abstract levels of political support identified by Norris lies beyond the scope of our study. While one does not expect longer-term diffuse support to vary within the limited temporal span covered by the analysis above, it is conceivable that reiterated experiences of losing may not only affect assessment of each contemporary government, but also jeopardize belief in the adequacy of the political system (i.e., democracy) itself. Such alienation could be compounded by wide ideological gulfs separating each government and repeated losers. While lack of data over a more extended period prevents us from investigating this theoretical possibility, this may be a subject meriting the attention of future scholars.
While our results clearly demonstrate that both previous electoral experience and ideological proximity mediate the relationship between winner/loser status and satisfaction with democracy, we must note that this analysis utilizes data from two consecutive elections only. A more robust investigation of any cumulative effect of winning or losing on levels of satisfaction would ideally examine data over a longer time span. Although problems of data availability restrain such an approach at present, the collection of cross-national panel data would provide useful material for future research. The question of how winning or losing at the subnational levels in countries with federal systems may interact with winner/loser status at the national level to influence satisfaction with democracy presents another topic warranting further study.
 by simply averaging positions of all cabinet parties. Secondly, we utilize a quadratic utility function. Neither approach affects our main findings.
 becomes negative. However, there are no observations that satisfy this condition, so we disregard this result as irrelevant.