


Introduction
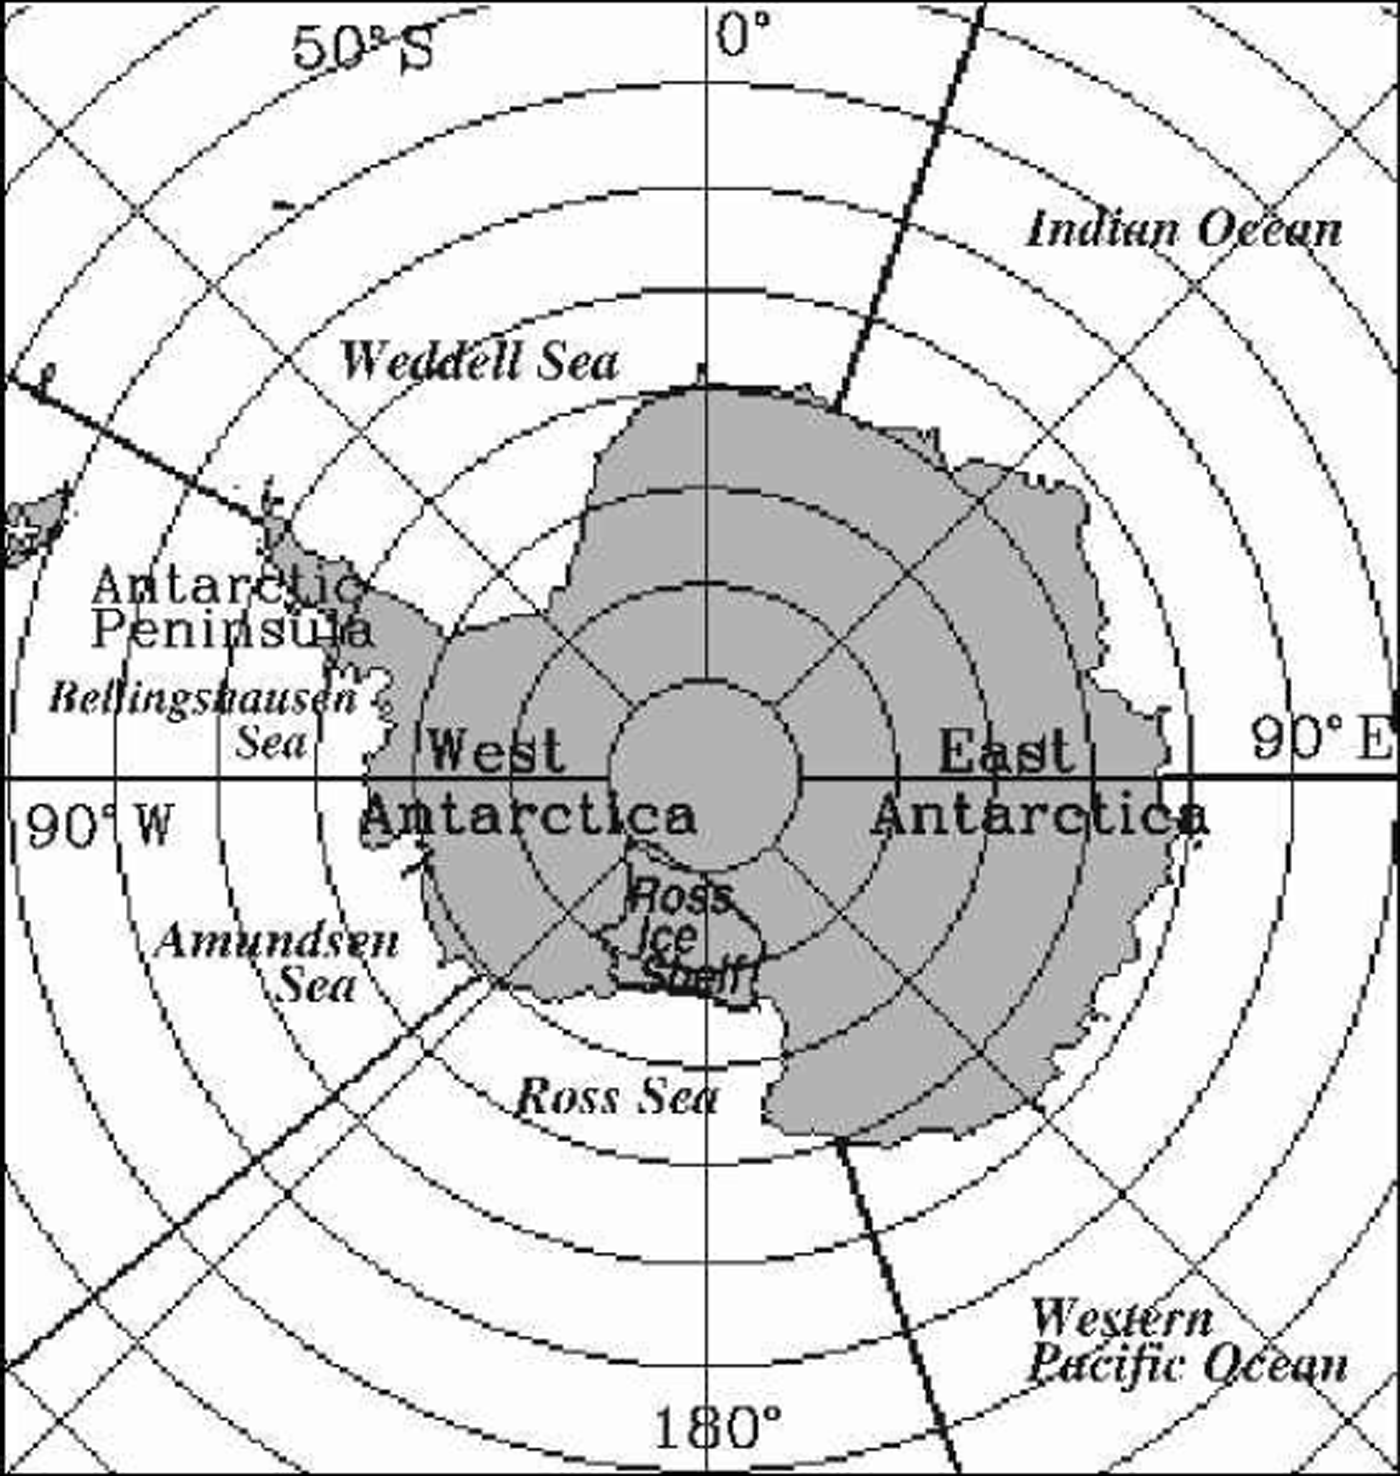
The Southern Ocean (Fig.1) sea-ice cover extends over a vast area, approximately 186106 km2, in the austral winter and experiences an enormous annual decay each spring and summer, with its coverage at the summer minimum typically reduced to <4×10⁶ km2 (Zwally and others, in press). The ice cover has a substantial impact on regional climate, most prominently by restricting exchanges of heat, mass and momentum between the ocean and the atmosphere and by reflecting most of the solar radiation incident on it. It also has a substantial impact on the biology of the Southern Ocean, for instance housing many species of microorganisms, serving as a platform for penguins, seals and other animals, insulating marine life below the ice from the atmosphere, and reducing light penetration into the ocean. The reader is referred to Reference Bentley, Hansen and TakahashiBentley (1984), Reference Drewry, Laws and PyleDrewry and others (1993) and Reference Worby, Bindoff, Lytle, Allison and MassomWorby and others (1996) for more on the climatological impacts of the ice and to Reference MassomMassom (1988), Reference Drewry, Laws and PyleDrewry and others (1993) and Reference SmithSmith and others (1995) for more on the biological impacts of the ice, including the impacts on primary productivity, phytoplankton blooms, krill and breeding success in seabirds.
Location map, including the boundaries of the five sectors into which the Southern Ocean is divided for analysis. The non-land boundaries are along the longitude lines at 203E, 903E, 1603E, 130° W and 60°W.
Until the 1970s, datasets regarding the Southern Ocean sea-ice cover tended to be sparse both temporally and spatially, due in large part to the vast area, the remoteness from most human habitations and the harshness of the in situ conditions. Fortunately, the ease of obtaining data on the ice cover changed dramatically with the advent of satellite technology. Satellite passive-microwave instrumentation in particular has allowed fairly routine monitoring of the Southern Ocean sea-ice cover since the late 1970s. In fact, the ease with which ice and water can be distinguished in passive-microwave data, due to the sharp contrast in ice and water emissivities at many microwave wavelengths, makes sea-ice coverage now amongst the most readily observed of all climate variables.
This paper takes advantage of satellite passive-microwave datasets over the 21 year period 1979–99 to report on changes in the length of the sea-ice season, defined as the number of days per year with sea-ice coverage, throughout the Southern Ocean. Changes in the length of the sea-ice season not only affect the regional climate and ecology, in ways alluded to above, but also can serve as indicators of change within the broader climate system. The length of the sea-ice season was first examined and mapped for the Southern Ocean in Reference ParkinsonParkinson (1994), where results were presented for the 8 year period 1979–86. It has subsequently been examined for the 7 year period 1988–94 by Reference RogersParkinson (1998) and for the two 8 year periods 1979–86 and 1989–96 by Reference Watkins and SimmondsWatkins and Simmonds (2000).
Data And Methodology
This study uses data from the Nimbus 7 Scanning Multichannel Microwave Radiometer (SMMR) and the Defense Meteorological Satellite Program (DMSP) Special Sensor Microwave/Imagers (SSM/Is). The SMMR instrument collected data on an every-other-day basis for most of the period 26 October 1978 to 20 August 1987, and the SSM/Is have collected data on a daily basis for most of the period since 9 July 1987. The two datasets have been used by Reference Cavalieri, Parkinson, Gloersen, Comiso and ZwallyCavalieri and others (1999) to create a consistent set of sea-ice concentrations (areal percentages of sea ice) using an algorithm commonly termed the NASA Team algorithm. This algorithm is based on the assumption of three surface types (two ice types plus liquid water), polarization and gradient ratios calculated from three channels of the satellite data, and a weather filter. The algorithm is described in detail in Reference Gloersen, Campbell, Cavalieri, Comiso, Parkinson and ZwallyGloersen and others (1992), and the procedures for matching the SMMR and SSM/I datasets are described in Reference Cavalieri, Parkinson, Gloersen, Comiso and ZwallyCavalieri and others (1999). The ice concentrations have spatial resolutions of approximately 55 km and are gridded to a consistent grid with gridcell size approximately 25625 km (NSIDC, 1992).
The sea-ice concentration data are used here to determine the length of the sea-ice season in each year at each gridpoint, by counting the number of days with ice coverage of at least 15%. Alternative ice-concentration cutoffs of 30% and 50% have also been used, with similar patterns resulting irrespective of which cut-off is selected (e.g. next section and Reference ParkinsonParkinson, 1994). The 15% cut-off is used for the main results in this paper both because it is the standard cut-off used for the ice-extent results from the same dataset (e.g. Zwally and others, in press) and because comparison of the ice concentrations from the NASA Team algorithm with those derived from other algorithms yields a close match in distributions of ice coverage of at least 15% but some substantial differences in distributions of ice of higher concentrations (e.g. Reference Comiso, Cavalieri, Parkinson and GloersenComiso and others, 1997; Reference HannaHanna, 1999; Reference Markus and CavalieriMarkus and Cavalieri, 2000). The15%results are thus considered the most robust.
The trend in the length of the sea-ice season is calculated at each ocean gridpoint as the slope of the line of linear least-squares fit through the 21 years of season-length data. The calculations are done through matrix manipulations on the 21 annual matrices of the length of the sea-ice season for the 15%ice-concentration cut-off, and are then repeated for the 30% and 50% cut-offs. For the trend calculations, each year’s season lengths are linearly scaled to equivalents for a 365 day year.
In order to obtain a measure of statistical significance for the trend results, an estimated standard deviation (σ) of the 21 year trend is calculated at each gridpoint following Reference TaylorTaylor (1997). Trends are considered statistically significant when the trend magnitude exceeds 1.96σ, signifying a 95% confidence level that the slope is non-zero. Trends that additionally meet the criterion of exceeding 2.58σ are considered statistically significant at a 99% confidence level (Reference TaylorTaylor (1997)).
Results
Season lengths
Figure 2 presents maps of the length of the sea-ice season for the beginning and ending years of the dataset and for the 21 year average over the period 1979–99. All three sets of results are presented for an ice-concentration cut-off of 15%, and the 21 year averages are also presented for an ice-concentration cut-off of 50%. The1979 and 1999 maps show both similarities, some of which are apparent in all the yearly maps, and some clear contrasts between the two years. Similarities include the existence of perennial ice (or, more precisely, ice coverage lasting at least 360 days of the year) in the far western Weddell Sea, the tendency for season lengths to decrease outward from the coast, and the anomalously short ice seasons in the southwestern Ross Sea compared to other locations of similarly high latitudes (Fig. 2a and b). Differences include the substantially greater area of perennial ice in the Amundsen Sea and especially the Bellingshausen Sea in 1979 than in 1999, contrasted by the substantially lesser area of perennial ice in the Ross Sea in 1979 than in 1999. Differences also include the prominent arm of long ice seasons extending northeastward in the western Weddell Sea in 1979 but not in 1999, and the much shorter ice seasons in the western Ross Sea in 1979 than in 1999 (Fig. 2a and b). The 21 year averages (Fig. 2c) indicate that for the latter phenomenon, the 1999 case was more typical than the 1979 case. Also, the prominent arm of long ice seasons in the western Weddell Sea in 1979 (Fig. 2a), which can be explained on the basis of the cyclonic gyre often apparent in the Weddell Sea (e.g. Reference GordonGordon, 1978), does not appear in the 21 year averages (Fig. 2c), and in fact shows up prominently only in years 1979,1980 and 1992, with less prominent appearances in 1984, 1991, 1996 and 1998 (visible in the individual yearly data, not shown here except for the years 1979 and 1999).
(a) Length of the sea-ice season for 1979, using a 15% ice-concentration cut-off, i.e. considering a location to have sea ice if the ice-concentration calculations show at least 15% ice coverage. (b) Length of the sea-ice season for 1999, using a 15% ice-concentration cut-off. (c) Average length of the sea-ice season for the 21years 1979–99, using a 15% ice-concentration cut-off. (d) Average length of the sea-ice season for the 21years 1979–99, using a 50% ice-concentration cut-off.
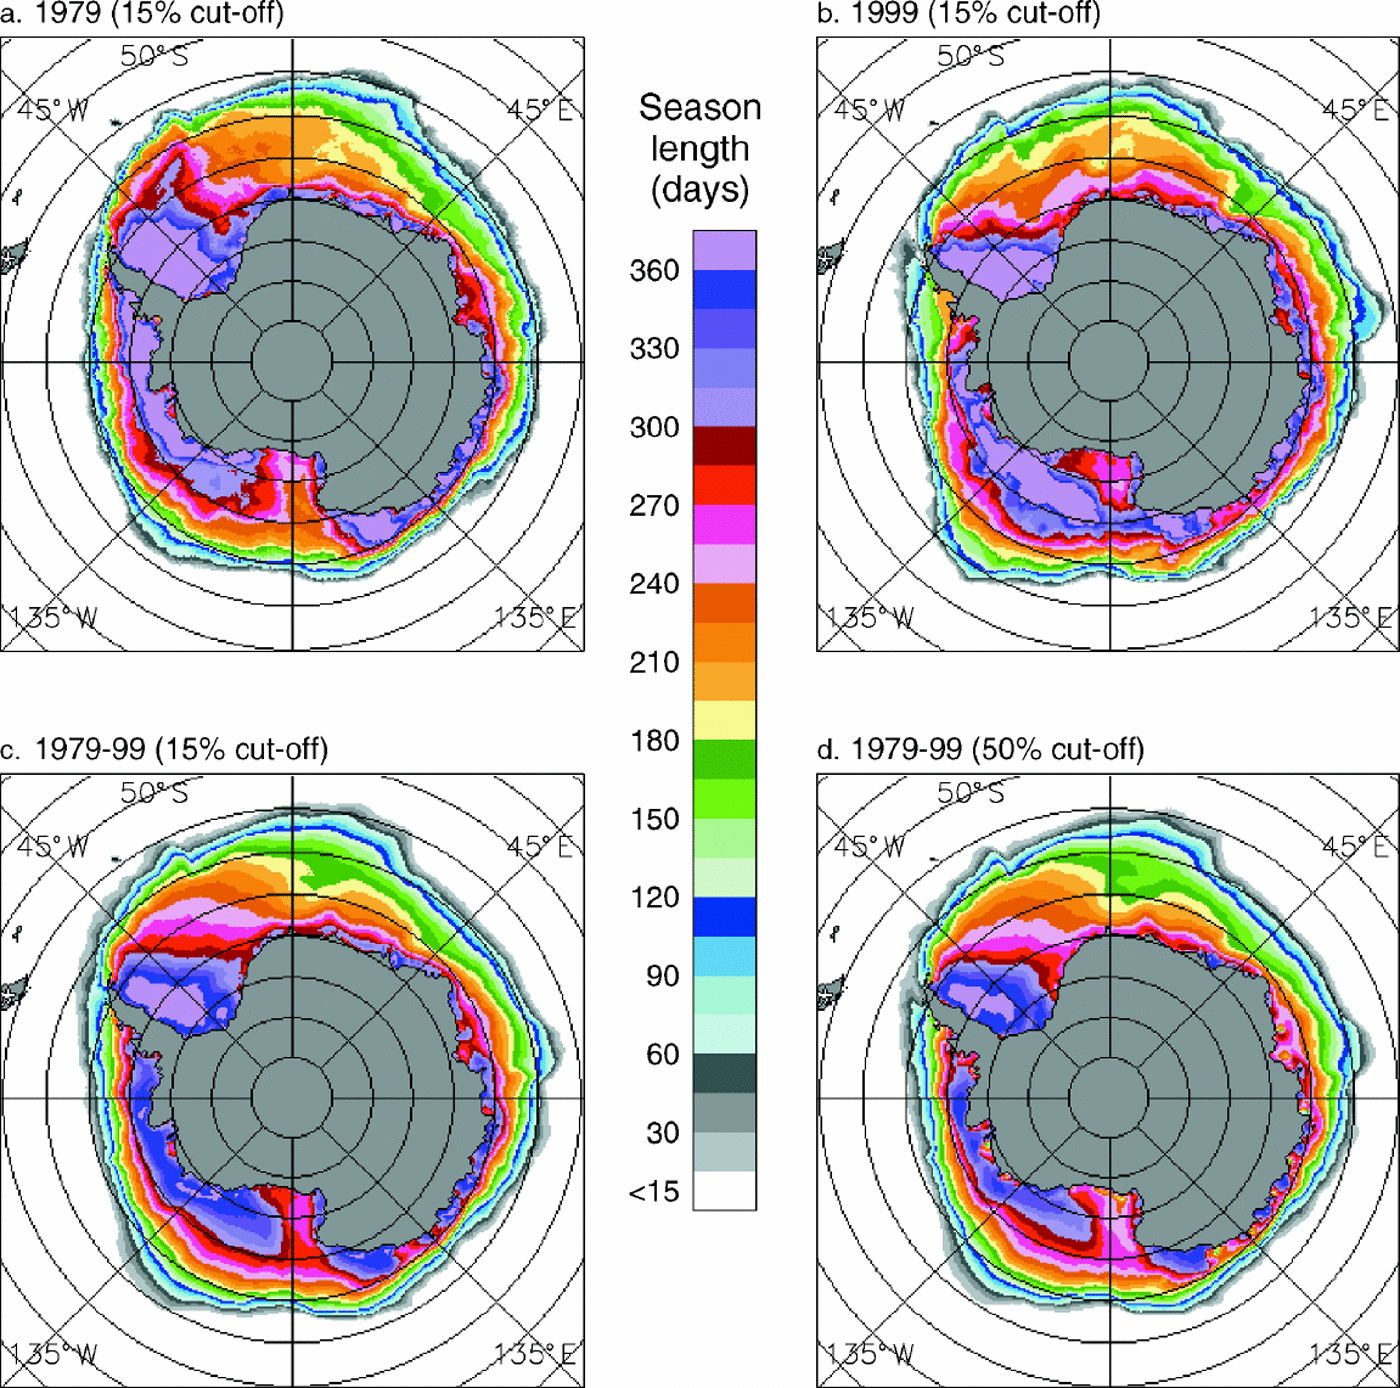
The 21 year averages are presented both for a 15% ice-concentration cut-off and for a 50% ice-concentration cut-off to verify that the basic patterns remain the same irrespective of which cut-off is used (Fig. 2c and d). Naturally, with a stronger criterion for ice coverage, the 50% cut-off yields season lengths that are generally less and never more than those for the 15% cut-off (Fig. 2c and d). For instance, immediately off the Ross Ice Shelf, all gridcells have at least 255 days with ice of concentration at least 15% (Fig. 2c), whereas some pixels have fewer than 195 days with ice of concentration at least 50% (Fig. 2d). This is an extreme case, brought about by the polynyas (areas of open water within an ice pack) that commonly form immediately off the Ross Ice Shelf. Still, despite the few large numerical differences between the 15% and 50% cases, the spatial patterns are quite similar throughout the images (Fig. 2c and d).
Trends
Trends in the length of the sea-ice season over the 21 years are presented in Figure 3a for an ice-concentration cut-off of 15% and in Figure 3b for an ice-concentration cut-off of 50%. The marked similarity of these two images illustrates the robustness of the results with respect to the choice of the specific ice-concentration cut-off used. In spite of the fact that some locations have much shorter seasons with ≥50% ice coverage than with ≥15% ice coverage (Fig. 2d vs Fig. 2c), either cut-off yields a very similar pattern of trends (Fig. 3a and b).
Trends in the length of the sea-ice season over the 21years1979–99, using (a) a15%ice-concentration cut-off, and (b) a 50% ice-concentration cut-off.

Linear least-squares trends for the 21 year period show an overall lengthening of the sea-ice season throughout most of the Ross Sea, around the coast of much of East Antarctica and in part of the south-central Weddell Sea (Fig. 3a). They show an overall shortening of the sea-ice season in almost the entire Bellingshausen Sea, most of the Amundsen Sea, the far western Weddell Sea, the northwestern Weddell Sea, the northern portions of the ice pack at about 15–35°E and 85–110°E, and a few small coastal areas between 25°Wand 80°E (Fig. 3a). In general, the regions of positive and negative trends are fairly coherent and identifiable, with little speckling of the colors. The coherent trend patterns suggest a lack of randomness, reinforcing the interpretation that the trends reflect valid physical changes.
Although the strongest trends indicated in Figure 3 are negative trends within the Bellingshausen Sea, overall the area covered by positive trends exceeds that covered by negative trends. Specifically, for the case using a 15% ice-concentration cut-off (Fig. 3a), the area covered by positive trends of at least 0.5 days per year is 8.36106 km2, whereas the area covered by negative trends of at least 0.5 days per year is 5.66106 km2, making the area covered by positive trends of that magnitude 48% greater than that covered by negative trends (Fig. 4). The contrast is even stronger when considering trends of magnitude at least 1.5 days per year, for which positive trends cover an area of 3.76106 km2 and negative trends cover 1.76106 km2, making the area covered by positive trends 114% greater (using area values to three decimal places, namely, 3.7146106 km2 and 1.7376106 km2, respectively) than the area covered by negative trends (Fig. 4). The positive trends greater than 1.5 days per year are predominantly from the Ross Sea region, while the negative trends greater than 1.5 day sper year are predominantly from the Bellingshausen and Amundsen Seas and those greater than 2.5 days per year are overwhelmingly from the Bellingshausen and Amundsen Seas (Fig. 3 and 4). For a whole-number division, the area experiencing a least-squares-fit lengthening of the ice season of at least 1day per year is 5.66106 km2, while the area experiencing a least-squares-fit shortening of at least 1 day per year is 3.0×10⁶ km2.
Histogram showing the area of the Southern Ocean sea-ice cover experiencing various levels of trends in the length of the sea-ice season over the 21years 1979–99, with bar segmentation to identify the contributions from each of the five sectors of the Southern Ocean identified in Figure 1. The histogram corresponds to Figure 3a, i.e. using a 15% ice-concentration cut-off and the same trend categories as in Figure 3. It compiles the results of all pixels having an average of at least 1day of ≥15% sea-ice coverage per year over the 21years. (Without the latter, or similar, restriction, the bar centered at 0 would peak far off the scale, as it would incorporate a considerable area equatorward of the sea-ice region.)

Comparisons with earlier studies, reversals and confidence levels
When examined for the 8 years 1979–86, the first 8 years of the 21 year dataset used here, the length of the sea-ice season was found to have shortened in the northern portions of the Bellingshausen and Amundsen Seas, the northern Weddell Sea, the eastern Weddell Sea and the near-coastal regions around East Antarctica (Reference ParkinsonParkinson, 1994; Reference Watkins and SimmondsWatkins and Simmonds, 2000). Lengthening of the sea-ice season occurred throughout most of the Ross Sea, in the south-central Weddell Sea and around much of East Antarctica away from the near-coastal region (Reference ParkinsonParkinson, 1994; Reference Watkins and SimmondsWatkins and Simmonds, 2000). So for both the 8 year and the 21 year records, the ice season predominantly shortened in the Bellingshausen, Amundsen, and northwestern Weddell Seas, predominantly lengthened in the Ross Sea and south-central Weddell Sea and had a more mixed pattern around the rest of the continent. However, in the sizable areas where the signs of the trends match, the magnitudes tend to be larger in the shorter, 1979–86 record than in the 21 year record, reflecting rate decreases and/or reversals in the trends since 1986. Indeed, both Reference Parkinson and JeffriesParkinson (1998) and Reference Watkins and SimmondsWatkins and Simmonds, 2000 note some reversals for the periods 1988–94 and 1989–96, respectively, vs 1979–86.
In view of the trend reversals, it is particularly important not to over-interpret the results of Figure 3. This figure gives a clear visualization of the overall changes in the length of the sea-ice season for the 21 year period 1979–99, but it incorporates fluctuations within the record, likely related to various oscillations within the climate system (e.g. Reference GloersenGloersen, 1995; Reference White and PetersonWhite and Peterson, 1996), and its values should not be projected into the future. A reasonable further step with the season-length calculations would be to fit higher-order or harmonic curves to the data, especially if the selected formulation could be justified on theoretical or observational bases.
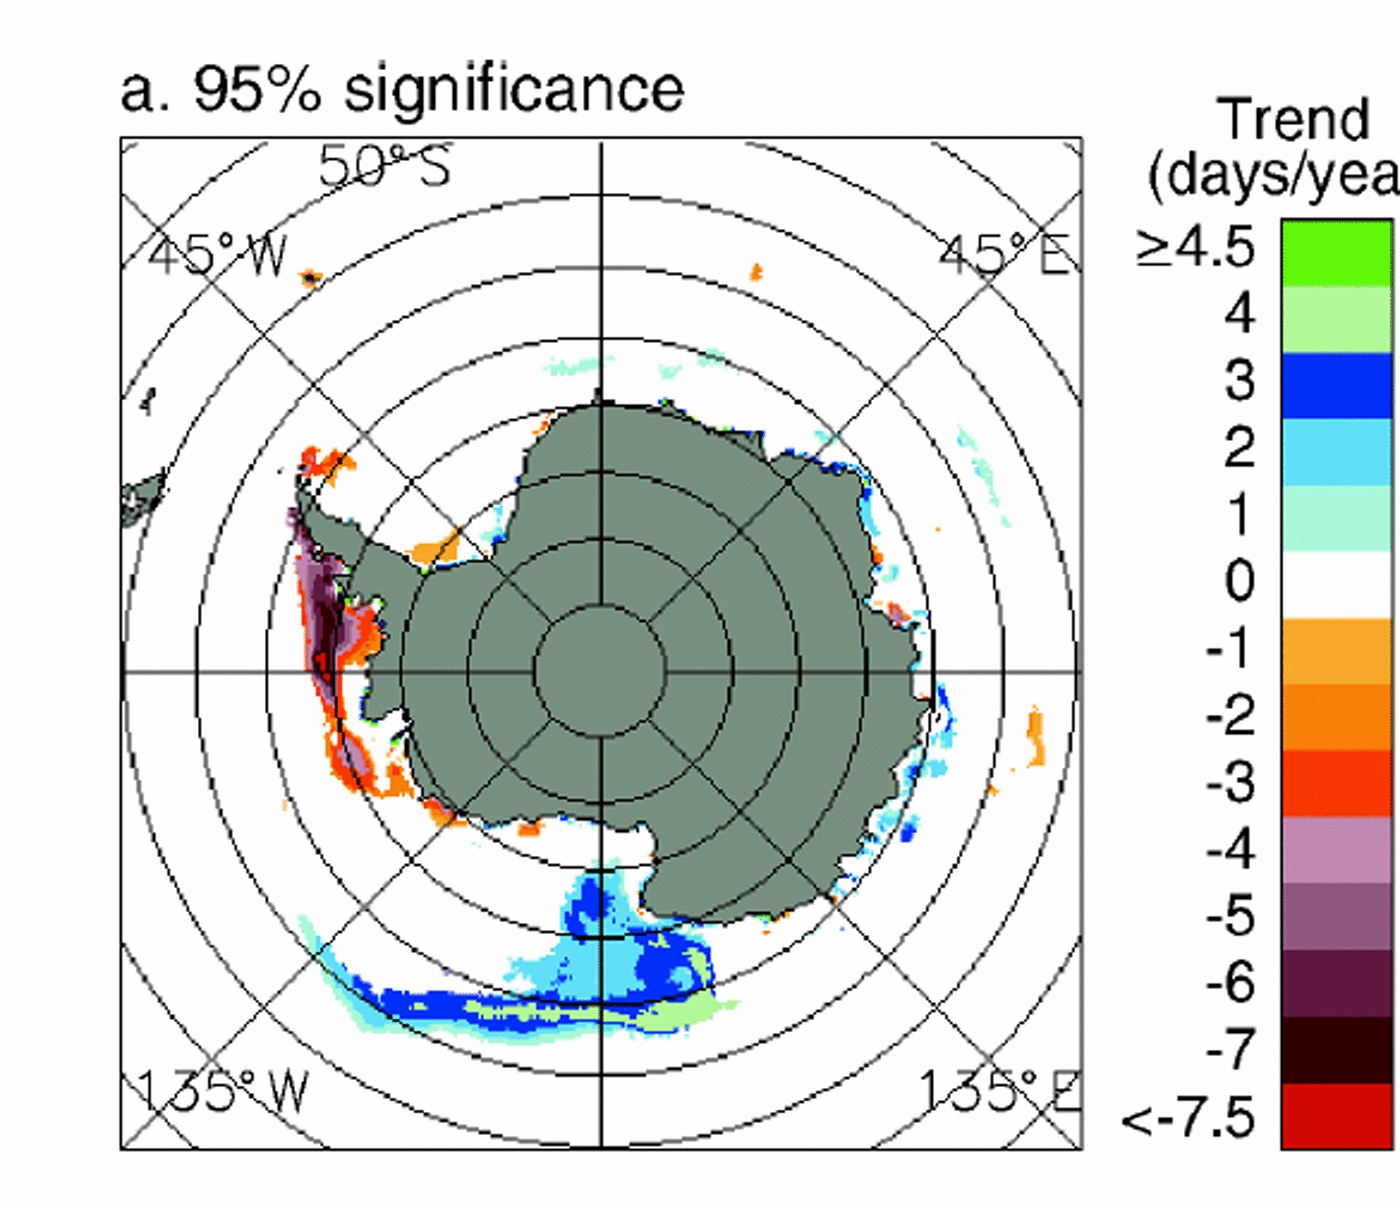
Despite the fluctuations over the 21 year period and the fact that linear least-squares fits are used for the calculation of season-length trends, some of the trends in Figure 3 do reach statistical significance. This is true of many of the trends calculated for locations in the Ross and Bellingshausen Seas, as well as some of the trends in the Amundsen Sea and at other locations scattered around the continent. Figure 5a shows those trends in Figure 3a having statistical significance with a confidence level of 95% or above; and Figure 5b shows the trends having statistical significance with a confidence level of 99% or above. The two largest intact regions with statistical significance center in the Bellingshausen Sea,where the trends are negative, and in the northern and northwestern Ross Sea, where the trends are positive. In both of these regions there are sizable areas where the significance is at the 99% confidence level (Fig. 5b). Still, for most gridpoints within the Southern Ocean ice cover, the calculated trends are not statistically significant (Fig. 5a vs Fig. 3a).
Statistically significant trends in the length of the sea-ice season over the 21 years 1979–99, using a 15%ice-concentration cut-off and zeroing out all trends that do not reach statistical confidence levels of (a) ≥95% or (b) ≥99%.
Summary And Discussion
Satellite passive-microwave data have been used to determine and map the length of the sea-ice season in each year 1979–99, with results showing (a) season lengths generally decreasing outward from the coast except in regions of coastal polynyas, (b) perennial ice cover consistently in the far-western Weddell Sea and more selectively elsewhere around the continent, and
(c) decidedly short ice seasons (for the high latitudes involved) off the Ross Ice Shelf (Fig. 2). Trends in the season lengths over the 1979–99 period show that: (a) most of the Ross Sea underwent a lengthening of the sea-ice season, (b) most of the Amundsen Sea and almost the entire Bellingshausen Sea underwent a shortening of the sea-ice season, (c) the Weddell Sea had a shortening of the sea-ice season in the northwest but a lengthening of the season in a substantial area of the south-central sea, and (d) around much of East Antarctica, the near-coastal region experienced a lengthening of the season, while further from the coast there was a more even mixture of areas experiencing season shortenings and those experiencing season lengthenings (Fig. 3). Integrating spatially, a much larger area of the Southern Ocean experienced an overall lengthening of the sea-ice season over the 21 years 1979–99 than experienced a shortening (Fig. 4).
These results complement results on trends in the Southern Ocean ice extent (defined as the area having sea-ice concentrations of at least 15%) found from the SMMR and SSM/I record. Analyses of the regional and hemispheric ice extents for the 16 year period 1979–94 by Stammerjohn and Reference SmithSmith (1997) and for the 20.2 year period from November 1978 through December 1998 by Zwally and others (in press) reveal positive ice-extent trends for the Weddell Sea, the Western Pacific Ocean, the Ross Sea and the Southern Ocean as a whole and negative ice-extent trends for the Bellingshausen and Amundsen Seas. The mapped results of the trends in the length of the sea-ice season (Fig.3) provide a far more detailed spatial picture of the 21 year changes in the Southern Ocean than is possible when examining the ice extents, but at the same time, they provide a far less detailed temporal picture. Together, the ice-extent and season-length results show an overall increasing Southern Ocean ice cover, with the Bellingshausen and Amundsen Seas and the far-western and northwestern Weddell Sea showing instead ice-cover decreases. These results are consistent with reports of notable warming over the Antarctic Peninsula from 1978 to 1996 (Reference King and HarangozoKing and Harangozo, 1998; Reference Skvarca, Rack, Rott and DonángeloSkvarca and others, 1998; both studies also include years prior to 1978) and with a tendency for air-temperature anomalies in the peninsula region to be opposite in sign to those predominating over much of the rest of the Antarctic (Reference RogersRogers, 1983; Reference Stammerjohn and SmithStammerjohn and Smith, 1997).
The satellite-derived Southern Ocean sea-ice results, with overall lengthening sea-ice seasons (Fig. 3 and 4) and increasing ice extents (Reference Stammerjohn and SmithStammerjohn and Smith, 1997; Zwally and others, in press), provide a sharp contrast with the widely publicized overall ice-cover decreases in the Arctic occurring over the same period. Many uncertainties remain, but one certainty is that the ice covers of the two hemispheres have not been fluctuating synchronously over the past two decades.
Acknowledgements
I thank N. DiGirolamo and J. Eylander of Science Systems and Applications, Inc., for their much appreciated help in generating the figures; T. Scambos, V. Lytle and an anonymous reviewer for their very kind and helpful reviews of the text and figures; and the NASA Cryospheric Sciences and Earth Observing System programs for providing research funding. The sea-ice concentration datasets are available from the U.S. National Snow and Ice Data Center (NSIDC), Boulder, CO.



