


I. INTRODUCTION
Severe plastic deformation (SPD) is fundamental to numerous metallurgical technologies, ranging from materials processing via ball milling, accumulative roll bonding,Reference Saito, Utsunomiya, Tsuji and Sakai1 or friction stir weldingReference Dawes and Thomas2 to in service degradation through wear,Reference Rigney, Chen, Naylor and Rosenfield3 friction, and fatigue.Reference Sundararaman, Chen, Wahi, Wiedenmann, Wagner and Petry4 In all of these situations, plastic deformation tends to cause changes in the alloy microstructure, not only through grain refinement and the creation of complex defect structures but also through chemical mixing and homogenization. Shear-induced mixing, in fact, has been likened to recoil mixing in materials subjected to energetic particle irradiationReference Martin5; in both cases, atoms are forced down gradients in their atomic concentrations with little influence of their chemical potentials. In this sense, they are considered ballistic. At elevated temperatures, thermally activated diffusion also contributes to atomic mixing. This process is often enhanced by the creation of vacancies during shearing or irradiation.Reference Martin5–Reference Dienes and Damask7 For alloy systems that are miscible, these two mechanisms act in parallel and enhance homogenization, whereas for immiscible alloys, the two mechanisms act in competition, with shearing tending to homogenize the alloy and thermally activated diffusion leading to phase separation. Two of the authors had shown previously using kinetic Monte Carlo (KMC) simulations that these two mixing processes are not simply additive and that in immiscible alloys, their competition can lead to compositional patterning.Reference Bellon and Averback8 Patterning in this case means that precipitates reach steady-state size, which is dictated by the shearing frequency and temperature, independent of the initial state of the alloy. The prediction of patterning has since been observed experimentally using transmission electron microscopyReference Zghal, Twesten, Wu and Bellon9 and atom probe tomography,Reference Wu, Isheim, Bellon and Seidman10,Reference Brocq, Radiguet, Le Breton, Cuvilly, Pareige and Legendre11 but the underlying mechanisms have remained unclear.
A closely related question for immiscible alloys subject to SPD is what controls the steady-state solubility in these driven alloys. The solubility is particularly interesting since it is easily accessible experimentally. At low temperatures and high shear rates, the system will clearly homogenize, whereas at high temperatures and low shear rates, solubilities approach their equilibrium values. Between these two limits, however, there are presently no rules guiding a prediction of solubility, although ball milling experiments clearly show that the solubility varies with temperature for a fixed shear rate.Reference Klassen, Herr and Averback12
Our understanding of shear mixing at the atomic scale has been greatly aided by molecular dynamics (MD) simulations.Reference Odunuga, Li, Krasnochtchekov, Bellon and Averback13,Reference Delogu14 These studies have shown that shear mixing in coherent crystalline systems is driven by the passage of dislocations cutting through the sample. The halves of the samples separated by the dislocation glide plane are shifted relative to each other by the Burgers vector of the dislocation. This leads to a convective motion of atoms. A simple measure of the mean square displacements of atoms, therefore, is not overly informative about the homogenization of the alloy. A better description of mixing in this case is provided by the mean square relative displacements (MSRD) between pairs of atoms, as this function determines whether atoms mix within their local environment. Moreover, by measuring the relative motion of atoms as a function of their pair separation, the length scale over which mixing takes place can be characterized.Reference Odunuga, Li, Krasnochtchekov, Bellon and Averback13 This previous MD study revealed, in fact, that the relative pair diffusion coefficient is a linear function of pair separation, i.e., D(r) ∼ r. The reason for the linear dependence is simply that the relative motion of two marker atoms requires the passage of a dislocation between them, and in the case of homogeneous deformation, the probability for such an event is proportional to their distance apart. The thermal pair diffusion coefficient, on the other hand, is naturally independent of pair separation, being just the sum of the individual diffusion coefficients of each atom of the pair. The two pair diffusion coefficients are illustrated in Fig. 1. One sees that on sufficiently short length scales, thermal diffusion dominates over shear mixing, whereas on some longer length scale, the shear component must exceed the thermal component. Based on these simple concepts, it was proposed that the length scales of patterning should be roughly determined by the intersection of these two lines.Reference Wu, Isheim, Bellon and Seidman10,Reference Odunuga, Li, Krasnochtchekov, Bellon and Averback13 We test this hypothesis for patterning in the present study by using KMC simulations.
Illustration of our proposed patterning length scale model based on pair diffusion coefficients. On short length scales, thermal diffusion (black lines) dominates over shear mixing (gray lines). In the case of positive heat of mixing, alloy coarsening on short length scales can be expected. On long length scales, the shear mixing will eventually overtake the thermal diffusion and lead to convective disordering. Large structures are therefore suppressed by convective disordering and small structures are suppressed by thermal coarsening. This leaves structures at intermediate length scales, where thermal diffusion and shear mixing cross and are comparable in magnitude. A common time scale for the two processes results from the definition of the pair diffusion coefficients given in Eqs. (1a) and (1b).

II. KMC MODEL
Rigid lattice KMC simulations of a crystal subjected to shear in the presence of thermally activated diffusion are performed following the model introduced in Ref. Reference Saito, Utsunomiya, Tsuji and Sakai1. The simple model presented in the introduction for predicting the patterning length scale under shear requires two pair diffusion coefficients. First, the particle diffusion coefficient is calculated from our KMC simulations as the number of vacancy jumps per unit time F vac, divided by the number of atoms, d 3, in the computational cell and multiplied by the square of the nearest neighbor distance, a 0. This choice, made for the sake of simplicity, ignores the distinction between marker diffusion and interdiffusion and assumes a correlation factor equal to unity. These simplifications help in achieving a clear presentation of the model of length scale selection. More refined descriptions would result in small quantitative changes, for instance, regarding the composition dependence of the thermal diffusion coefficient, and they are thus ignored in the present work. During the time 1/F vac, each particle in a pair statistically jumps once, changing the relative distance between the particles by two jumps. Thus the thermal pair diffusion coefficient is simply twice the single particle diffusion coefficient, and is given by
 $$D_{{\rm{therm}}}^{\,{p}} = {{2F{}_{{\rm{vac}}}a_0^2 } \mathord{\left/ {\vphantom {{2F{}_{{\rm{vac}}}a_0^2 } {d^3 }}} \right. \kern-\nulldelimiterspace} {d^3 }}\quad .$$
We note that a vacancy trapped at an interface can introduce additional correlations in the diffusion process, which would reduce the correlation factor. This effect, however, should be small if the trapping is not too strong and the vacancy escapes the interface before a significant fraction of the interface atoms have moved.
The shear induced pair diffusion coefficient is calculated from the frequency that dislocations are inserted into the simulation cell, F disloc, divided by the number of atomic planes d in the simulation cell to obtain,
 $$D_{{\rm{shear}}}^{\,p} \left( r \right) = a_0^2 \times F_{{\rm{disloc}}} \times d^{ - 1} \times \left( {{r \mathord{\left/ {\vphantom {r {a_0 }}} \right. \kern-\nulldelimiterspace} {a_0 }}} \right)\quad .$$
The pair separation distance r enters the pair diffusion coefficient as the number of atomic planes r/a 0, as each of these planes contributes a constant probability to host a dislocation passing between the pair. In these simulations, placement of the dislocation glide plane is random and completely independent of chemical microstructure. This is an approximation which is reasonable for coherent systems where dislocations can transfer across interfaces. The KMC model requires a coherent lattice, since it is a fixed lattice technique. MD simulations have shown, however, that two phase Cu–Ag and Cu–Ni fcc–fcc alloys behave very similarly to our model system.Reference Ashkenazy, Vo, Schwen, Averback and Bellon15 An example of a system that cannot be modeled in this way, on the other hand, is Cu50Nb50, a fcc–bcc system; this system exhibits dislocation pile-up and amorphization at the interfaces.Reference Ashkenazy, Vo, Schwen, Averback and Bellon15
The periodic boundary conditions used in our simulations require that dislocations pass through the cell in pairs of opposite sign. For a relative motion to occur between the atoms in a pair, one dislocation must pass within the interval of length r between the atoms, whereas the other dislocation must pass in the interval of length L–r between one atom and the periodic image of the other atom, with r p being the distance between the atoms projected onto the normal vector of the slip plane and L being the length of the simulation cell in the direction of the slip plane normal (i.e., for an fcc system in a cubical simulation cell with {100} faces and an edge length L′, this yields  $L = L\prime /3{^{{1 \over 2}}}$). This results in the probability of a relative displacement of two atoms with distance r being proportional r(βL–r) under periodic boundary conditions. The geometric factor β arises from the limited set of available slip planes and each marker atom pair having the possibility to be crossed by multiple sets of slip planes with normal vectors that are not parallel to the pair-separation vector r. This results in the pair diffusion coefficient having the form,
 $$D\left( {\bf r} \right) = {{\rm{\alpha }} \over L}\mathop\sum\limits_i {{\bf n}_i {\bf r}}\left( {L_i - {{\bf n}_i {\bf r}_i} } \right)} \quad ,$$
where α is the number of dislocations in a certain slip system per unit time and atomic plane. An average over all directions yields the pair diffusion coefficient expressed as a function of the separation distance.
 $$D\left( r \right) = {\rm{\alpha }}r\left( {{\rm{\beta }}L - r} \right)\quad .$$
For a two-dimensional square lattice, β = 4/π, for a three-dimensional simple cubic lattice with three slip planes, β = 3/2, and for a three-dimensional fcc lattice with four slip planes, β = 7/4. The periodicities in the direction of each slip plane normal must be identical. In this work, we are operating in the linear regime of the pair diffusion coefficient, Eq. (1b), as all microstructural length scales are small compared to the dimensions of the simulation box. The constants α and β are included in F disloc.
The probability of selecting a slip system under an applied stress is given by the Schmid factors. In our simulations, however, we assume that the stresses are applied in a random fashion. While this can be rationalized by a comparison with ball milling experiments, where the impact directions on the powder grains are sufficiently random, the primary focus here is to elucidate the mechanism of compositional patterning. The choice of strain path, however, can indeed affect the mixing efficiency in the system, as we have found in our simulations (Schwen, unpublished), but the important linear behavior of the pair diffusion coefficient will be retained as long as the dislocation glide paths are homogeneously distributed in the sample. Even in shear experiments, where the strain is not random, such as extrusion or high-pressure torsion,Reference Bachmaier, Kerber, Setman and Pippan16 the rotation of grains will tend to randomize the directions of the local stresses in a particular grain.Reference Tóth, Neale and Jonas17
As noted above, at long pair-separation distances, the disordering motion is much faster than the precipitation rate, whereas at close distances, precipitation can dominate as the probability for dislocations passing through a local neighborhood is small. A steady-state length scale should thus evolve when these two relative diffusion coefficients are of equal magnitude. Equating  $D_{{\rm{shear}}}^{\,p} \left( r \right)$ and
 $D_{{\rm{therm}}}^{\,p}$ yields for the length scale,
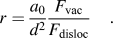 $$r = {{a_0 } \over {d^2 }}{{F_{{\rm{vac}}} } \over {F_{{\rm{disloc}}} }}\quad .$$
For the thermal diffusion, we use a standard n-fold way KMC algorithmReference Bortz, Kalos and Lebowitz18 on a fixed fcc lattice. Details of the algorithm are described in Ref. Reference Saito, Utsunomiya, Tsuji and Sakai1. We note that maintaining exactly one single vacancy in the simulation box at any given time precludes vacancy–vacancy interactions, and even though there is just one vacancy, the vacancy concentration is high compared to the equilibrium value, owing to the small size of realistic computational cells. This results in a vastly accelerated simulation time scale, but it is straightforwardly corrected by dividing the simulation time steps by the expectation value for the number of vacancies in the simulation box at thermodynamic equilibrium. We account for this by taking the sum of vacancy formation probabilities at all lattice sites,
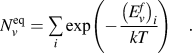 $$N_v^{{\rm{eq}}} = \mathop \sum\limits_i {\exp \left( { - {{\left( {E_v^f } \right)_i } \over {kT}}} \right)\quad .}$$
Note that the vacancy formation energy at a lattice site is a function of the site's local chemical neighborhood. The vacancy concentration is thus dependent on the microstructure of the system. Since the present work focuses on steady-state microstructures, we calculated  $N_v^{{\rm{eq}}}$ for each simulation run, after steady state was achieved. The model also requires a reference energy for the vacancy formation process, typically taken as the binding energy of an atom at a surface step. Since determining the surface composition is beyond the scope of the utilized bulk KMC technique, we assume a regular solution at the surface. We point out that although obtaining a correct timescale is necessary to assign physically meaningful strain rates to our simulation runs, our expression for the predicted microstructural length scale, at steady state, only contains a ratio of two frequencies and the time cancels out. It is also worth noting that in an actual system, the introduction of dislocations during shearing can lead to the production of point defects through mechanisms such as forced climb.Reference Cottrell19 This complicates direct comparisons with experimental observations, but that is not our focus here. For all runs in this study, we use an ordering energy of ω = 55.33 meV (which implies a heat of mixing parameter of 0.332 eV at infinite dilution and thus similar to a Cu–Ag alloy). The cohesive energies of the pure A and B components are both set to E coh = −4.34 eV, and the vacancy formation energies in the pure materials are set to E vf = 1.28 eV. The attempt frequency and migration energy for the vacancy jumps are set to υ = 1015 per second and E mv = 0.8 eV, respectively.
III. RESULTS
A qualitative picture of the patterning behaviors is presented in Fig. 2, where snapshots of the steady-state microstructures in a A50B50 alloy are shown for different rates of shearing. Clearly seen is a systematic reduction in the microstructural length scale as the strain rate increases, similar to that previously reported in Ref. Reference Saito, Utsunomiya, Tsuji and Sakai1. We note that the exact microstructure in the steady-state regime is in perpetual flux and only the length scale appears to be a constant.
Steady-state snapshots of the simulation cell under strain rates (a) 1.0 × 10⁻⁵ s−1, (b) 1.1 × 10⁻⁷ s−1, (c) 4.9 × 10⁻¹⁰ s−1, and (d) 3.0 × 10⁻¹¹ s−1 at T = 400 K and c B = 50%. The corresponding 2D slices across the cells are shown on the right. A visual inspection shows a clear dependence of microstructural length scale on the strain rate, with low strain rate runs producing coarse structures and high strain rates producing fine structures gradually approaching a regular solution state.
We quantify the different length scales obtained during shearing, such as those in Fig. 2, by using a Fourier-transform-based analysis. A cubic Cartesian grid was formed in which each cell location corresponds to a lattice location in the rhombohedral fcc base coordinates. We next choose a grid point value of c B for sites occupied by B-atom site and 1−c B for A atom sites. We then perform a discrete fast Fourier transform on the grid and interpret the grid coordinates of the transform as coefficients of the reciprocal base. A power spectrum for a regular solution is subtracted as background, and radial averaging is performed by binning the power spectrum values according to their distance from the reciprocal cell origin, taking the periodic boundary conditions into account. We then take the first moment of the computed radial power distribution to obtain a single scalar characterizing the length scale of the system. We note that the power spectrum radial averages are not always clearly peaked and that the resulting moment does contain high frequency contributions from interface regions as well as individual solute atoms. For our samples, the values of second and third moments of the frequency distribution follow parallel to the first moment, differing only by a constant factor.
The results of the Fourier analysis are shown in Fig 3, where the microstructural length scales obtained from the first moment of the structure factor are plotted as a function of the length scale predicted by Eq. (3). The different curves correspond to KMC simulation runs for different temperatures, alloy concentrations, and cell sizes. The dashed lines represent Eq. (3). All curves are nearly linear over 3–4 decades of strain rate, and magnitudes are close to the model prediction. A few details, however, warrant mention. First is the effect of temperature. The data for the 15% alloy show that the length scale at the higher temperature, 600 K, is larger than that at 400 K by a factor of ≈3. This cannot be attributed to the faster hopping of the vacancy at 600 K, since the vacancy diffusivity has already been included in Eq. (3). Moreover, the driving force for precipitation at 600 K, i.e., the supersaturation of element B in the A-rich phase, is reduced from that at 400 K, and so this too cannot explain our result. We noted above that the model assumes that the thermal diffusion coefficient is proportional to the number of vacancy jumps. Vacancies, however, are more stable at a precipitate interface, and so it is likely that vacancy jumps are somewhat biased to remain on the interface. This effect will suppress precipitation, and it will become increasingly important at low temperatures. We thus tentatively attribute the smaller length scale at 400 K to correlated vacancy motion not included in Eqs. (2a) and (2b) and thus to a lower effective thermal diffusion coefficient at low temperatures.
Microstructural length scale at steady state as a function of the predicted length scale F vac/F shear × d −2. Systems at 400 and 600 K were simulated. The simulation results are demonstrated to be independent of simulation box size (643 and 1283 lattice site boxes were simulated). Length scale is calculated as the first moment of the radially averaged power spectrum of the simulation cell.
Figure 3 also shows that the length scale increases with increasing solute concentration. This result is expected since for a given precipitate size, the precipitate concentration will increase with solute concentration, and collisions between precipitates will be more numerous. The average size of the precipitates will thus increase. Last, Fig. 3 shows for the 50% alloy that at fixed temperature and shear rate, the length scale of the phase separation is independent of the size of the simulation cell, indicating that finite size effects in the simulations do not create artifacts in the results.
We next analyze the solubilities of the B component in the A-rich phase as a function of the shear rate. An atom is usually considered in solution based on a criterion involving the numbers of A and B first nearest neighbors. This method, however, is largely arbitrary and will depend on the actual solute concentration. We use here a different technique, based on comparing nearest neighbor count distributions of B–B bonds per lattice site in the sample with corresponding calculated distributions in regular solutions of a given concentration c B. If d n is the concentration of solute atoms with n solute nearest neighbors, then for a regular solution, d n(c B) is a nonmonotonous function,
 $$d_n \left( {c_B } \right) = {{12!} \over {\left( {12 - n} \right)!n!}}c_B^{n + 1} \left( {1 - c_B } \right)^{12 - n} \quad .$$
On the other hand, dn/dn+1 is monotonous, and thus, it can be inverted to solve for c B.
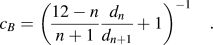 $$c_B = \left( {{{12 - n} \over {n + 1}}{{d_n } \over {d_{n + 1} }} + 1} \right)^{ - 1} \quad .$$
In the KMC sample, all d n are easily obtained by bond counting. We used Eq. (6) for n = 0 and for that case, this method is most sensitive in the lower concentration regions, and it is not much affected by the precipitates or interface regions. Figure 4 shows the results of this solubility analysis for a series of steady states. Each data point is obtained by averaging the solubility over 100 time steps with enough temporal spacing to ensure minimal correlation between successive sampled steps. Error bars are smaller than the graph symbols.
Strain rate dependent solubility of B atoms for total B atom concentrations c B of 15%, 25%, and 50% at temperatures of 400 K and 600 K. Top three horizontal dotted lines indicate the regular solution concentrations 50%, 25%, and 15%, lower dotted line indicates the solubility at 600 K. The inset shows the vacancy jump rate (per atom in the simulation cell). A clear dependence on strain rate and the resulting microstructural length scale is visible.
Three regimes are observed in Fig. 4. At very low strain rates, the solubility is given by the thermodynamic equilibrium. This can be seen for the sample held at 600 K, the curve approaches the thermodynamic equilibrium solubility at zero strain rate, denoted by a horizontal line in the graph. At intermediate strain rates, the solubility becomes strongly dependent on strain rate, increasing approximately as γ1/3, whereas at high strain rates, all samples saturate with all of the B atoms in solution, as expected. The higher shear rates required for dissolution at 600 K results from the much higher diffusion coefficient at this temperature. For example, the diffusion coefficient in pure A or B increases by a factor of ∼6 × 10⁸ on increasing the temperature from 400 to 600 K, and this largely explains the higher shear rate, 3 × 10⁷, required for dissolution. Last, we note that our method to determine solubility works well, even for the 50% solution, despite our numbers being based on statistical analysis of solute atoms with zero or one solute neighbor.
In understanding the dynamic competition between shear mixing and thermal diffusion in real experiments, it is of interest to examine the effect of shearing on the thermal diffusion coefficient. We noted above that shearing can result in an increased steady-state vacancy concentration, but it can also significantly alter the vacancy jump rate. This is shown in the inset of Fig. 4, where F vac is plotted as a function of F disloc at T = 400 K. Note that this increase is due to faster hopping of each vacancy, since shearing does not increase the concentration of vacancies in this model. At low shear rates, F vac increases nearly as fast as Fshear,  $F_{{\rm{vac}}} \propto \,F_{{\rm{disloc}}}^{0.8}$, whereas at high shear rates, F vac becomes nearly constant. These results reflect comments made earlier concerning trapping of vacancies at various sites in the lattice. At low shear rates, vacancies often remain trapped at these sites until shear-induced mixing changes the local environment of these trapped vacancies and frees them to migrate. For example, at 400 K, the jump frequencies of vacancies completely surrounded by A (or B) atoms are ≈120 times smaller than those for vacancies at sharp (111) interfaces. At high shear rates, local environments change quickly relative to the fastest vacancy jump frequencies, and the vacancy jump frequency becomes independent of shear rate. We point out that Fig. 3, which plots length scale versus the ratio F vac/F disloc, has taken this effect into account by directly counting vacancy jumps. For experiments, however, such accounting would be very difficult.
Last, we consider the effect of precipitate curvature on patterning, i.e., the Gibbs–Thomson effect. It has been suggested in the past that increased solubilities during shearing are possibly due to the Gibbs–Thomson effect.Reference Yavari20 We evaluate this possibility by first determining the steady-state microstructures during shearing and subsequently evolving these systems in time without shear, and plotting solubility versus microstructural length scale. This is reported in Fig. 5 for the 15% alloy sheared at 600 K. The samples first enter a transition regime, as the solubility first begins to equilibrate with the local microstructure, and then coarsening sets in. Since the solubility equilibrates faster than the microstructure coarsens above a certain microstructural length scale, a quasiequilibrium is reached and all curves merge. The horizontal dotted gray line denotes the equilibrium solubility at 600 K of about 0.6%, while that predicted by Gibbs–Thomson is shown as a dotted line. For the latter, we used the average of the interfacial free energies of {100}, {110}, and {111} interfaces which were found to be isotropic to good approximation. It is seen that the theoretical enhancement of solubility at 600 K, according to the Gibbs–Thomson equation, is well below the measured values during shearing for all but the very smallest length scales at both temperatures (400 K not shown). Moreover, the solubility is found to decrease monotonically when the shearing is turned off, starting at any steady-state length scale investigated. We thus conclude that solubility is dominated by kinetic processes (shearing) rather than thermodynamic effects (Gibbs–Thomson).
Solubility under shearing and without applied shear plotted as a function of microstructural length scale. The symbols show steady-state solubilities under shearing at 400 K and 600 K for various solute concentrations. The steady-state configurations at 600 K for the 15% B atom concentration at various strain rates were stored and the runs continued in the absence of shearing. The solubilities of these runs are plotted as thin gray lines. A transient can be seen for each configuration at small r until all curves converge onto a common solubility law (indicated by two black dashed parallel lines). Top three horizontal dotted lines indicate the regular solution concentrations 50%, 25%, and 15% and the horizontal dotted gray line denotes the equilibrium solubility at 600 K of about 0.6%. Theoretical solubility enhancement according to the Gibbs–Thomson equation at 600 K is plotted as a dashed black curve and found to be below the measured values for all length scales except the very smallest at both temperatures (400 K not shown).
IV. CONCLUSIONS
The principal finding of this KMC investigation is that the patterning length scale of a simple phase separating alloy during SPD at elevated temperatures can be reasonably understood by the intuitive model leading to Eq. (3). For all three alloys studied, the linear dependence of length scale on the ratio F vac/F disloc is observed over several decades of this ratio. The simulations show, however, that the detailed kinetic behavior of an immiscible alloy during shear is quite complex, making detailed comparisons of the model with experiments very difficult. For example, the strong dependence on the vacancy jump rate during shearing, while directly accessible in simulations, is generally not available in experiments or easily included in analytical models. The dependence of alloy solubility on shearing rate was also obtained. We find that the solubility increase with shearing rate arises from the glide of dislocations, shear mixing and cannot be attributed to the Gibbs–Thomson effect.
ACKNOWLEDGMENTS
This research was supported by the U.S. National Science Foundation under Grant Nos. DMR 1005813 and 0906703. Part of this work was performed with support from the Center for Materials at Irradiation and Mechanical Extremes, an Energy Frontier Research Center funded by the US Department of Energy (Grant No. 2008LANL1026) at Los Alamos National Laboratory.



