INTRODUCTION
Many sea cucumber fisheries have dramatically declined worldwide in the last twenty years due to overexploitation and ineffective management arrangements (Purcell et al. Reference Purcell, Mercier, Conand, Hamel, Toral-Granda, Lovatelli and Uthicke2013). The typical boom and bust trajectory of these fisheries suggests that lack of effective information and management puts sea cucumber resources at high risk in the short term, as for other similar high-value invertebrate resources (Castilla & Defeo Reference Castilla and Defeo2001; Andrew et al. Reference Andrew, Agatsuma, Ballesteros, Bazhin, Creaser, Barnes, Botsford, Bradbury, Campbell, Dixon, Einarsson, Gerring, Hebert, Hunter, Hur, Johnson, Juinio-Meňez, Kalvass, Miller, Moreno, Palleiro, Rivas, Robinson, Schroeter, Steneck, Vadas, Woobdy and Xiaoqi2002). Sea cucumbers are indeed highly commercially attractive and vulnerable to overexploitation due to their ecological and biological features (Anderson et al. Reference Anderson, Flemming, Watson and Lotze2011). They are depensatory mortality species, which means that reproductive success and recovery are far less effective when population density decreases, ultimately with a risk of local extirpation (Uthicke et al. Reference Uthicke, Schaffelke and Byrne2009). To sustain these fisheries in the long term, the fundamental goal is to implement precautionary management that maintains sea cucumber resources above their biological recovery threshold, whilst also supporting sustainable harvesting activity (Shepherd et al. Reference Shepherd, Martinez, Toral-Granda and Edgar2004).
Conceptual indicator-based approaches to fisheries have expanded considerably and provided theoretical guidelines for the application of the precautionary principle to fisheries management (Garcia Reference Garcia1994). Specifically, uncertainty in resource assessments needs to be taken into account to establish regulatory measures in the case of vulnerable species, such as sea cucumbers. Monitoring biological, socioeconomic and environmental indicators is recommended to evaluate the effectiveness of invertebrate fisheries management on an adaptive basis, given the natural variability and the inherent uncertainty of survey data (Caddy Reference Caddy2004). The temporal variation of indicators can be analysed across a time series and compared to critical threshold values of these indicators, named reference points (Caddy & Mahon Reference Caddy and Mahon1995). However, approaches based on indicators and reference points have been considered expensive and difficult to implement in data-limited contexts, such as those of small-scale invertebrate fisheries. Indeed reference points in fisheries management are usually based on biological and fishing parameters (such as natural mortality, virgin biomass or optimal fishing mortality) that cannot easily be calibrated to the local conditions of most small-scale invertebrate fisheries due to knowledge gaps (Perry et al. Reference Perry, Walters and Boutillier1999; Seijo & Caddy Reference Seijo and Caddy2000; Uthicke et al. Reference Uthicke, Welch and Benzie2004). These parameters may be affected by subjective decisions, which contribute to create uncertain reference points and complicate their interpretation (Patterson et al. Reference Patterson, Cook, Darby, Gavaris, Kell, Lewy, Mesnil, Punt, Restrepo, Skagen and Stefánsson2001; Trenkel & Rochet Reference Trenkel and Rochet2003). For instance, although the maximum sustainable yield (MSY) of a fishery is widely used in total allowable catch (TAC) based fisheries management, this target reference point can not be considered in most small-scale sea cucumber fisheries due to gaps in biological and fishing data (Purcell Reference Purcell2010a).
Recent reviews of sea cucumber fisheries management have highlighted sustainable practices to meet conservation, social and economic objectives in the long term (for example see Friedman et al. Reference Friedman, Purcell, Bell and Hair2008, Reference Friedman, Eriksson, Tardy and Pakoa2011; FAO [Food and Agriculture Organization of the United Nations] 2010; Anderson et al. Reference Anderson, Flemming, Watson and Lotze2011; Purcell et al. Reference Purcell, Mercier, Conand, Hamel, Toral-Granda, Lovatelli and Uthicke2013). However such recommendations remain largely hypothetical because their effects remain poorly documented. Information on the ability of management options to achieve predefined management objectives is needed for selecting the most appropriate regulatory measures and for ruling out those unlikely to succeed. For instance, the heterogeneous distribution of sea cucumber populations calls for spatially-explicit regulatory measures although complementary large-scale regulations (such as minimum harvest sizes and gear restrictions) are also appropriate. This requirement is typical for sedentary and low-mobility species whose growth, mortality, recruitment and aggregation vary with habitat distributions (Caddy Reference Caddy and Caddy1989). Defining regulatory measures on a scale too large, given the ecological traits of the target species, may not stop local overexploitation and local extirpation. For example, TAC or quota of sea cucumbers should be set at an appropriate management level since national or provincial TAC may not prevent serial depletion of separate stocks and fishery collapse, even if the overall TAC has not been reached. Identifying the factors and conditions that lead to successful sea cucumber fisheries management at a local level would help with implementing large-scale strategy that involves stakeholders and fishery agencies across management levels (Cash & Moser Reference Cash and Moser2000).
In Oceania, the effectiveness of coastal fisheries management largely relies on the support and compliance of fishers and local communities. This is due to the fact that on the one hand, territorial fishing rights and customary ownership of inshore marine resources are usually enforced through customary marine tenure, and on the other hand, the government has a limited capacity to collect and process biological and fishing data, and enforce national fishing regulations. These national fishing regulations usually include gear restrictions to prohibit the use of destructive fishing practices, the setting of minimum sizes of animals exploited to reduce the mortality of immature and sub-adult individuals, and fishing, processing and/or export licensing. As part of this study, sea cucumber fisheries management was examined in Vanuatu and New Caledonia (South Pacific). In Vanuatu, both community-based and governmental management did not prevent the sea cucumber fisheries collapse, although a multispecies national quota of 26 t yr−1 and minimum landing sizes were established in 2005, followed by a five-year national moratorium in 2008. The Fisheries Department of Vanuatu planned to lift the fishing ban in 2013 on the sites where resources have recovered sufficiently. In New Caledonia, sea cucumber exports have declined from 94 to 34 t yr−1 for the last five years, and local overexploitation of the highest-value species has been reported by Purcell et al. (Reference Purcell, Gossuin and Agudo2009) and provincial fisheries departments. This has encouraged the latter to seek more effective management alternatives.
The overall objective of this study was to revise the strategy applied to New Caledonia and Vanuatu for the operational management of artisanal sea cucumber fisheries in data-limited contexts. Specifically, we first put into effect an adaptive comanagement system in New Caledonia to manage a previously depleted small-scale fishery for sandfish Holothuria scabra, one of the highest-value sea cucumber species. Since the 1990s, this fishery has been operated and ruled by the fishers from the Melanesian village of Boyen (200 inhabitants) and, occasionally, by two neighbouring villages. The only restrictive provincial fishing regulations were a ban on night fishing and a minimum harvest length of 20 cm (fresh whole sandfish). Fishing gear restrictions (namely a ban on the use of scuba equipment and drag nets) were not applicable in the shallow waters of the study area. In the early 2000s, fishers reported a decline in commercial sized sandfish, suggesting that the resources had been depleted. Thus, landowners and the local fishers’ organization temporarily closed the fishery in 2007. They then requested assistance from the provincial Fisheries Department to define the catch level according to the biological capacity of the fishing ground. As part of this study, the initial harvestable stock biomass was assessed in 2008 and has been regularly monitored since then. This has then been used as a reference biomass to implement local TAC and regulations of fishing effort. We evaluate biological and economic performance and the key factors for success of the comanagement system. We then generalize the methodology for estimating the reference biomass to multispecies sea cucumber fisheries in Vanuatu. Lessons from these case studies provide fresh insights into the spatial upscaling (from one site to multiple sites) of the resource assessment method and have been used to develop an operational framework to inform sea cucumber fisheries policy in these two countries.
METHODS
Defining the appropriate reference indicator of a small-scale sandfish fishery
The study focused on the main sandfish fishery in New Caledonia. This was a single-species fishery located in the Northern Province on a 26 km2 shallow coastal reef flat covered by seagrass beds (Fig. 1a). To define an appropriate TAC, we selected the harvestable stock size (all legal-sized animals), as a biological indicator characterizing stock status. This local reference indicator (hereafter reference biomass or RB, in tonnes of live-weight animals) may be used to address the risk of recruitment overfishing. According to Conand (Reference Conand1993), wild sandfish reach maturity at a length of c. 16 cm in New Caledonia, which corresponds to around one to two years of age depending on growth rates (Hamel et al. Reference Hamel, Conand, Pawson and Mercier2001; Purcell & Kirby Reference Purcell and Kirby2006). The RB was linked to the abundance and length of sea cucumbers and was therefore expected to decrease when the exploitation rate increased. The expected sensitivity to short-term effects of fishing allowed for near real-time tracking of the resource status. In addition, abundance and length of targeted sea cucumbers were two variables that were easy for fishers and fisheries department officers to interpret and measure. High sensitivity, significance and measurability of the RB were desirable characteristics for the planned management scheme (Rochet & Trenkel Reference Rochet and Trenkel2003).
Sites of field surveys in (a) New Caledonia and (b, c, d) Vanuatu. (a) Quickbird satellite image of the sandfish Holothuria scabra fishing grounds. The 25 polygons were defined by photointerpretation and correspond to different habitat zones according to seagrass density, sediment patches and reef edges. The 123 permanent transects for sandfish census (white circles) were randomly located within each habitat proportionally to the habitat surface area and expected sandfish abundance (see methods for more details on sampling design). (b) Malikolo Island, (c) Maskelynes Islands, (d) Efate Island: coloured zones were defined by photointerpretation of Worldview II satellite images and correspond to different habitat zones according to seagrass density, sediment patches, reef edges, exposure, depth and geomorphological entities.

We also assessed four additional biological indicators: total stock abundance (in number of individuals), total stock biomass (t), mean density of sandfish (individual km−2), and mean individual weight of sandfish (g). The expected exploitation rate of the sandfish fishery was defined a posteriori by the ratio of the TAC to the estimated total stock size (live-weight animals).
Estimating the reference biomass of the fishery
We estimated the RB eight times between June 2008 and April 2012 using field census data from the fishing area, obtained using a rapid and cost-effective survey method. The observation units were 100 m × 2 m belt transects (200 m2 per transect). The centre of the transect was marked using a 100-m long tape. All individuals found up to 1 m from the tape were counted and measured to the nearest 5 mm (length (L) and width (W)). We calculated the individual weight (P) using (Purcell et al. Reference Purcell, Gossuin and Agudo2009):
 \begin{equation}
P = 1.186 \times \left( {\pi \times \frac{{L \times W}}{4}} \right)^{1.259}\end{equation}
Depending on the stage of the tides, counts were conducted either by walking on the reef flat or snorkelling in areas down to 2-m depth. The teams consisted of two observers comprised of fishers and New Caledonia Fisheries Department officers. A map of marine habitats was used to spatially stratify data collection in the fishery (see Skewes et al. Reference Skewes, Dennis, Koutsoukos, Haywood, Wassenberg and Austin2002; Aumeeruddy et al. Reference Aumeeruddy, Skewes, Dorizo, Carocci, Coeur de Lion, Harris, Henriette and Cedras2005). This map was created using a multispectral 2.4-m spatial resolution Quickbird satellite image (Fig. 1a), as large-scale reef geomorphology maps derived from Landsat 7 sensors were inadequate in resolution for the purpose of this study. The image was imported into a geographical information system (GIS, ArcGIS v9.2) and processed following a simplified user-oriented protocol derived from Andréfouët (Reference Andréfouët2008). Twenty-five polygons were defined using differences in colour and texture due to different seagrass densities, sediment patches and reef edges visible on the image. We thus assumed that the 25 polygons reflected different habitat zones, although they were all variations of seagrass habitats. Habitat surface areas were calculated through GIS. This simple mapping process was used to compute stock estimates using habitat surface areas (km2) and sea cucumber density (individual km−2) (Hamel & Andréfouët Reference Hamel and Andréfouët2010).
The area considered for most surveys corresponded to the highly productive and heavily targeted 12–15 km2 area of the eastern reef flat. However, the entire fishing area (26 km2) was surveyed during the first and seventh surveys (June 2008 and October 2011, respectively). The sampling effort resulted from a compromise between data quality issues and survey duration. The GIS was used to randomly allocate 2–20 transects to each habitat zone, resulting in a sample of 40–112 fixed transects according to the extent of the survey area (Fig. 1a). Initially the sampling rate was set proportionally to the area of each habitat zone. However, the strong involvement of fishers allowed us to perform more intensive survey of habitat zones that showed high sandfish abundance to increase accuracy of the RB. The mean sampling rate therefore increased across the study period from 2.5 transects km−2 in 2008 (namely 2–5.5 transects km−2 among habitat zones) to 4.2 transects km−2 since 2009 (2.1–6.8 transects km−2 among habitat zones).
Count data were integrated into a database that performed statistical estimations using user-defined algorithms. We firstly calculated the mean density (individuals km−2) and biomass (live-weight, kg km−2) of all and legal sized sandfish within each habitat zone. We then multiplied these values by the habitat surface area to estimate the abundance and biomass of the entire and harvestable stocks within each habitat zone, respectively. We then summed these across habitat zones to give the estimated total and harvestable stock abundance and biomass, respectively. The mean density of sandfish was estimated by dividing the total stock abundance by the survey area. The mean individual weight of sandfish was estimated within each habitat zone and then extrapolated to the entire survey area. The associated 95% confidence intervals of all estimates were calculated using common statistical inference procedures for stratified random sampling (Cochran Reference Cochran1963). The RB corresponded to the lower limit of the 95% confidence interval of the estimated harvestable stock biomass (live-weight legal-sized animals) at the time of survey.
Generalizing the assessment of the reference biomass for multispecies sea cucumber fisheries
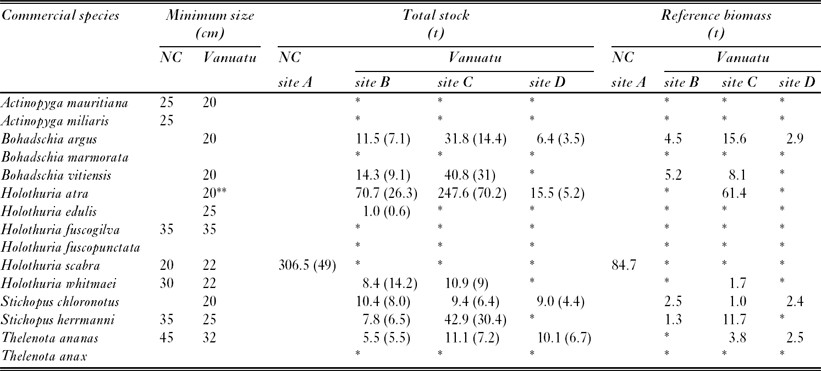
The RB was estimated for 15 low- to high-value commercial sea cucumber species at three sites in Vanuatu, located on the islands of Malikolo, Maskelynes and Efate (Fig. 1b, c, d; Table 1). Communities in these sites temporarily closed their marine territory to sea cucumber fishing due to the heavy depletion of the resources before the national moratorium came into effect. A map of marine habitats was created for each site using multispectral 1.8-m spatial resolution Worldview II satellite images following the procedure described above. The habitat maps of the sites exhibited a much greater diversity than the New Caledonian study site, with 37–72 habitat polygons per site (Fig. 1b, c, d). Sampling effort reached 171–286 transects per site, namely 10–15 transects km−2. Data were collected in 2011 using the same methods as previously described for the survey in New Caledonia. Nevertheless, the use of scuba equipment, although not essential, sometimes facilitated counts of species up to a depth of 10 m, which was, in practice, the average depth limit for sea cucumber harvesting in Vanuatu. Simultaneously, habitat was qualitatively described (by depth and gross substrate cover categories: mud, sand, rubble, coral, rock and seagrass) for each sampling transect. If appropriate, we used these observations to adjust the habitat zone borders in the GIS. We determined suitable habitats for each species based on literature (Conand Reference Conand, Carpenter and Neim1998; Tuya et al. Reference Tuya, Hernandez and Clemente2006; Bellchambers et al. Reference Bellchambers, Meeuwig, Evans and Legendre2011), and in situ habitat description and species occurrence during the surveys. The length-weight relationships for each species were taken from Conand (Reference Conand1989).
Sea cucumber reference biomass (in t) at the survey site (A) in New Caledonia and the three survey sites (B, C, D) in Vanuatu in 2012 and 2011, respectively. Live minimum harvest sizes are shown for both countries. The width of the 95% confidence interval of total stock biomass estimates is in parenthesis. *Estimated biomass lower than one tonne. **Lollyfish Holothuria atra minimum harvest size may decrease from 30 cm to 20 cm in 2014. NC = New Caledonia.
RESULTS
Biological change in the New Caledonia sandfish fishery
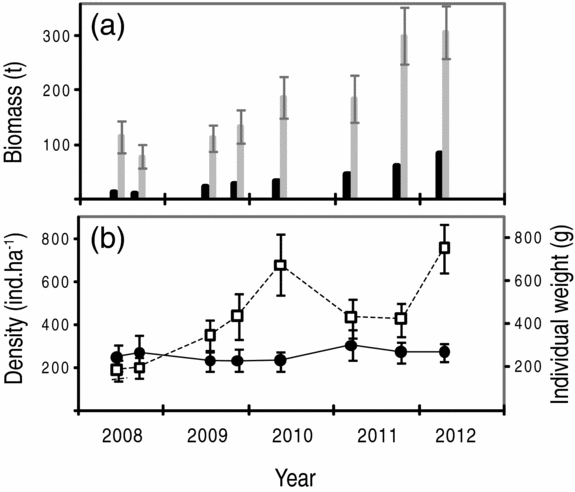
The RB and total stock of sandfish regularly increased across the study period, emphasizing the strong positive biological effects of the comanagement regime across all of the size classes. The RB rose from 13 t to 85 t (+566%), from 28 000 to 224 000 individuals (Fig. 2a). Similarly, the total biomass markedly increased from 115 ± 30 t (95% confidence interval) to 307 ± 49 t (+167%), or from 471 000 ± 126 000 to 1 138 000 ± 167 000 individuals (+142%). While the RB represented 11% of the total stock in 2008, it reached 28% in 2012. The increase in RB was spatially restricted to the reef flat area perceived as very productive by local fishers.
Evolution of biological indicators across the eight comanagement cycles (2008–2012) in the surveyed sandfish Holothuria scabra fishery in New Caledonia. (a) Reference biomass (black bars) and total stock biomass (grey bars). (b) Average density (white squares) and average individual weight (black circles). Vertical bars represent 95% confidence intervals. Reference biomass assessments were conducted in June 2008, September 2008, July 2009, November 2009, May 2010, March 2011, October 2011 and April 2012.
Other biological indicators showed less marked and irregular fluctuations compared to the RB across the study period (Fig. 2b). The change in mean individual weight of sandfish ranged from –6% to +24% during the eight monitoring surveys, as compared to its initial level, with an overall increase of 11% between 2008 and 2012. The mean sandfish density increased by 312% from 18 300 to 75 400 individual km−2 between 2008 and 2012, despite a sharp decline in 2011 due to unidentified factors.
Integrating the RB in a comanagement cycle in the New Caledonia sandfish fishery
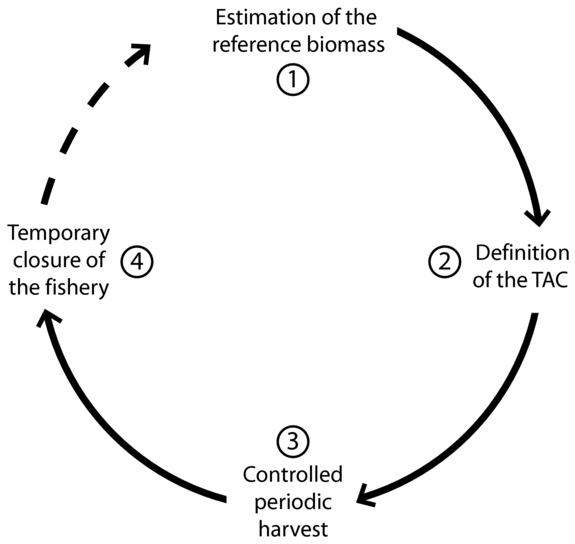
The occurrence of overfishing prompted, at a local level, a desire to improve resource stewardship and achieve greater accountability in the management of the sandfish fishery. Specifically, the fishers’ organization developed an iterative and adaptive management procedure to set fishing restrictions based on biological monitoring data. The RB was implemented following an innovative comanagement cycle structured in four steps (Fig. 3).
Four-step comanagement procedure implemented in the surveyed sandfish Holothuria scabra fishery in New Caledonia between 2008 and 2012. (1) Statistical estimation of the harvestable stock biomass and the reference biomass using habitat-based stratified sampling and participative biological surveys; (2) definition of the total allowable catch (TAC) based on the reference biomass; (3) controlled periodic harvest of sea cucumbers including regulations of fishing effort and the monitoring of sales; and (4) temporary closure of the fishery when the TAC has been reached.
Firstly, the RB was estimated following the methods described above. Secondly, the provincial Fisheries Department officers and the fishers’ organization discussed the RB, and used it to set a collective TAC (live weight) equal to or lower than the RB. Fishers were therefore allocated the lower limit of the 95% confidence interval or a lower level of the total harvestable biomass. As fishers eviscerated sea cucumbers at sea and marketed the salted product, the initial TAC was converted into a TAC of gutted and salted products. The rate (conversion from wet to salted) was set at 0.85 for the first six surveys due to measurement errors with the local conversion rate, and then reduced to 0.5 for the last two surveys following the recommendations of Skewes et al. (Reference Skewes, Smith, Dennis, Rawlinson, Donovan and Ellis2004).
Thirdly, the fishery was reopened, together with the introduction of regulations on fishing effort. Specifically, the fishers’ organization imposed a limitation on fishing periods and allocation of fishing rights. Each fishery was opened for short periods of time (1–3 days) to control the level of catch and prevent illegal fishing, followed by interval closures of 1–4 weeks duration. There were 2–7 open periods in each comanagement cycle, depending on the size of the TAC and the measured fishing yields. Open periods occurred at the end and at the beginning of the year in particular, to cover expenses related to Christmas holidays and school costs. Local fishing rights were regulated through both individual quotas per open period, to prevent a ‘race’ to exploit sea cucumbers and individual appropriation of the TAC, and annual fishing licences per vessel (i.e. 1–5 fishers). The total number of licences has been limited to 27 since 2009. Sales to middlemen took place immediately after each open period. Sale prices, individual catch and the cumulative catch sold since the first opening day of the comanagement cycle were monitored by a provincial Fisheries Department officer and a representative of the fishers’ organization to check compliance with the TAC.
The fishery was closed again as soon as the TAC was reached, remaining closed until the fishers’ organization planned a new survey to estimate the RB, 1–8 months later, marking the beginning of a new comanagement cycle.
Management outputs in the New Caledonia sandfish fishery
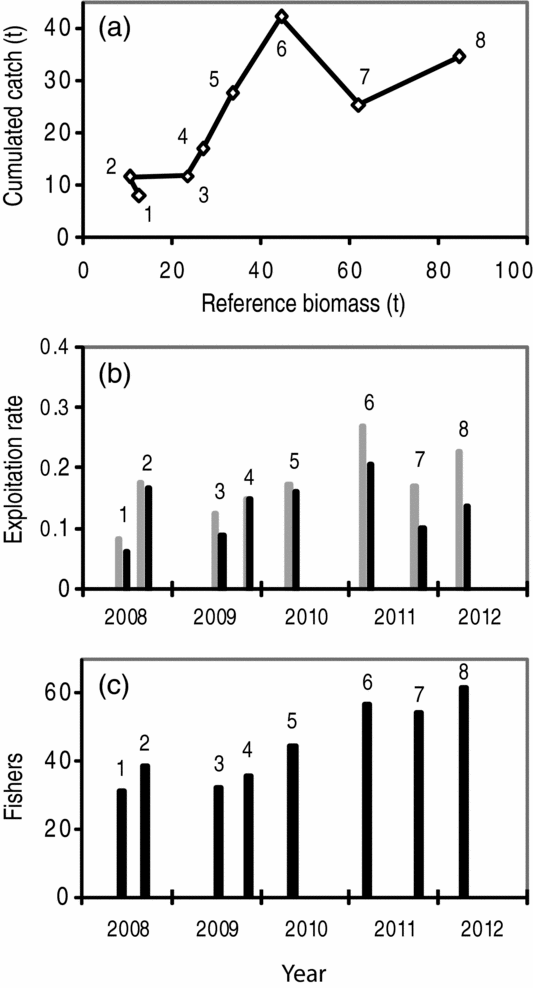
The comanagement cycle was repeated eight times between 2008 and 2012 (once or twice per year) in the sandfish fishery, and each time the TAC was updated based on the RB. The cycle duration ranged from three to ten months and included from six to twenty fishing days (closures represented 92–97% of cycle duration). Catches recorded at each cycle increased from 8 t to 35 t (+338%) proportionally to the RB (Pearson r = 0.746, p = 0.03). It peaked at 42 t during the sixth comanagement cycle (Fig. 4a). Although the RB regularly increased, a 40% drop in catch was observed during the second half of 2011. This drop corresponded to the 54% decrease in the TAC of salted products, following the reduction of the conversion rate of live weight to salted weight from 0.85 to 0.5 between the sixth and seventh comanagement cycles. The expected exploitation rate fluctuated between 6% and 21% over the period (Fig. 4b). The observed exploitation rate was estimated by the ratio of the observed catches to the total stock size (converted to salted products). It ranged from 8% to 27% over the period, indicating that the catch generally exceeded the TAC (Fig. 4b). Excess catches have been recorded at sale dates since 2011, in particular, as returns from catches generated high incentives among fishers to increase allowed catches.
Evolution of fishing activities across the eight comanagement cycles (1–8) in the surveyed sandfish Holothuria scabra fishery in New Caledonia between 2008 and 2012. (a) Catches relative to the reference biomass. (b) Expected (black bars) and observed (grey bars) exploitation rates. (c) Number of fishers.
The mean number of fishers and the income gained by each fisher increased from 30 to 61 (+103%) and from US$ 1900 to US$ 3700 (+95%) between the first and last comanagement cycles, respectively (Fig. 4c). The catch value generated at each cycle grew from US$ 57 000 to US$ 225 000 (+295%) between 2008 and 2012 (or US$ 2200–14 900 km−2), although average prices slightly decreased from c. US$ 7 kg−1 (salted products) to US$ 6.5 kg−1 (–8%). Annual catches rose from 20 t in 2008 to 50 t in 2012 (+150%), generating a return of US$ 138 000 and US$ 341 000, respectively (+146%).
Estimates of the RB and management outputs in Vanuatu multispecies fisheries
In Vanuatu, the RB of sea cucumber stocks in the three study sites was very low for almost all surveyed species. The RB was < 1 t for 67–86% of the species in all sites (Table 1). This suggested that the sea cucumber resources had barely recovered, despite the four year moratorium. In particular, the RB for sandfish was < 1 t. This was well below the level observed in New Caledonia before the comanagement process was initiated (13 t in 2008; Fig. 2a).
Although most sea cucumber stocks appeared depleted in the survey sites, biomass estimates showed marked spatial difference (Table 1). Specifically, total stock and RB of four low- to medium-value species were significantly higher in site D: lollyfish Holothuria atra (total stock = 248 ± 70 t [95% confidence interval] and RB = 61 t, respectively), leopardfish Bohadschia argus (total stock = 32 ± 14 t and RB = 16 t), curryfish Stichopus herrmanni (total stock = 43 ± 31 t and RB = 12 t) and brown sandfish Bohadschia vitiensis (total stock = 41 ± 31 t and RB = 8 t). The RB of these species comprised 11–49 % of the total stock biomass.
The moratorium on sea cucumber harvesting in Vanuatu at the time of the survey did not allow for the implementation of a RB in these study sites. However, the RB would indicate extension of the fishing ban for most species given the very low expected catch and incomes. Based on these results, the Vanuatu Fisheries Department has recommended to extend the moratorium for five additional years for all sea cucumber species and to estimate the RB in other sea cucumber fisheries of the country.
DISCUSSION
Addressing uncertainty issues in stock estimates
A minimum density of sea cucumbers has commonly been recommended as a biological threshold for fisheries (see Purcell Reference Purcell2010a; Friedman et al. Reference Friedman, Eriksson, Tardy and Pakoa2011), although quantitative data on the related density-dependent processes (such as recruitment and mortality) is lacking for most exploited species (Lovatelli et al. Reference Lovatelli, Conand, Purcell, Uthicke, Hamel and Mercier2004). Similarly, although an optimal fishing mortality has been prescribed to determine TAC in certain cases (see Skewes et al. Reference Skewes, Taylor, Dennis, Haywood and Donovan2006; Purcell Reference Purcell2010a), the sustainable exploitation rate of the sandfish fishery in New Caledonia could not be precisely defined, despite current knowledge on sandfish ecology. The unexpected rapid recovery of the resources has allowed for a relatively high exploitation rate. This may be partly attributed to high recruitment rates of sandfish in the area due to higher initial density (c. 20 000 individuals km−2) compared to survey sites in Vanuatu and other Pacific countries, where depleted sea cucumber stocks showed low replenishment rates (see Skewes et al. Reference Skewes, Taylor, Dennis, Haywood and Donovan2006; Friedman et al. Reference Friedman, Eriksson, Tardy and Pakoa2011). Echinoderms may exhibit rapid population density increases following positive environmental conditions and pulses of recruitment (Uthicke et al. Reference Uthicke, Schaffelke and Byrne2009).
To address these uncertainties, our methodology used (1) high sample size and robust statistical assumptions based upon stratified random sampling to quantify the accuracy of stock estimates, and (2) a precautionary RB to limit the risk of overestimating the TAC. On the one hand, uncertainties in survey data collection may occur due to stage-specific detectability and/or burying behaviour of most target species (for example see Shiell & Knott Reference Shiell and Knott2008; Purcell Reference Purcell2010b; Purcell et al. Reference Purcell, Samyn and Conand2012). Although these measurement errors are not quantifiable, the stock biomass was probably underestimated. On the other hand, RB is defined using the lower bound of the 95 % confidence interval of the harvestable biomass at the time of survey, while excluding the hypothetical stock growth during comanagement cycles. A conservative TAC may be set lower than RB if the latter represents a significant part of the total stock biomass, as observed for some species in the survey sites in Vanuatu.
Missed opportunities for higher catches are intrinsic to precautionary approaches and may not be well accepted by fishers. However, this study shows that this cost may be acceptable in sea cucumber fisheries ruled by territorial fishing rights (as in our survey sites), because sea cucumbers are sedentary resources and traditional rights held by fishers are valid over the long term (Scott Reference Scott, Neher, Arnason and Mollett1989).
Reducing the uncertainty in the implementation of a RB
We have converted the theoretical approach of fisheries monitoring using indicators of pressure, state, impact and response as advocated by Caddy (Reference Caddy2004) to a simplified state-response cycle. The RB characterizes resource status, and provides immediate and measurable change in exploitation through the TAC.
This ‘short-cut’ approach has greatly facilitated the use of a RB in the decision-making process in Vanuatu and New Caledonia, in contrast with other indicators such as mean density and individual weight, which did not follow the same temporal dynamics as the RB in the sandfish fishery. This difference may derive from the confounding effects of fishing and environment on sea cucumber resources due to the high spatial and temporal variability of holothurian populations (Clark et al. Reference Clark, Pritchett and Hebert2009). A change in mean density or individual weight of sea cucumbers would not directly and accurately determine a percentage increase or decrease in catches. Further uncertainties in setting the TAC may then cause discrepancies among stakeholders’ perceptions about local regulatory measures, which would certainly affect the adaptive capacity and precautionary orientation of comanagement (Charles Reference Charles1998).
High economic returns, highly adaptive regulatory measures and shared governance of the fishery have also created strong incentives to implement the RB, and demonstrated the success of this comanagement system in New Caledonia. The study provides evidence that this system has performed more efficiently than previous regulations set by the provincial Fisheries Department, in particular the minimum harvest size for sandfish. Difference in management outputs may result from the higher biological performance of and compliance with the TAC and associated regulatory measures in the area. Conservative levels of RB have probably allowed for harvesting only part of the legal-sized biomass and, consequently, set a lower fishing mortality than that induced by a harvest size limit alone. The TAC and short open fishing periods may have also mitigated the opportunistic harvest of sandfish, as observed in other high-value sea cucumber stocks (Purcell et al. Reference Purcell, Mercier, Conand, Hamel, Toral-Granda, Lovatelli and Uthicke2013). Overall, local fishing restrictions have very likely contributed to the rapid recovery of sandfish resources and the resulting increase in catches. Both factors have prompted comanagers to continue to enforce the local regulatory measures in the absence of permanent outside controls. More globally, these results suggest that the enforcement of conservative minimum harvest sizes (larger than maturity sizes) for commercial sea cucumber species would likely efficiently sustain resources. In Pacific Island countries, enforcing minimum harvest sizes seems both an achievable and affordable method for managing exported species; the limited export avenues would facilitate catch monitoring by government agencies when sea cucumber are not consumed locally. Further biological studies are nonetheless required to extend knowledge of sizes at maturity (Conand Reference Conand1993) for all commercial sea cucumber species.
Incorporating the reference biomass into spatial multispecies fisheries policy
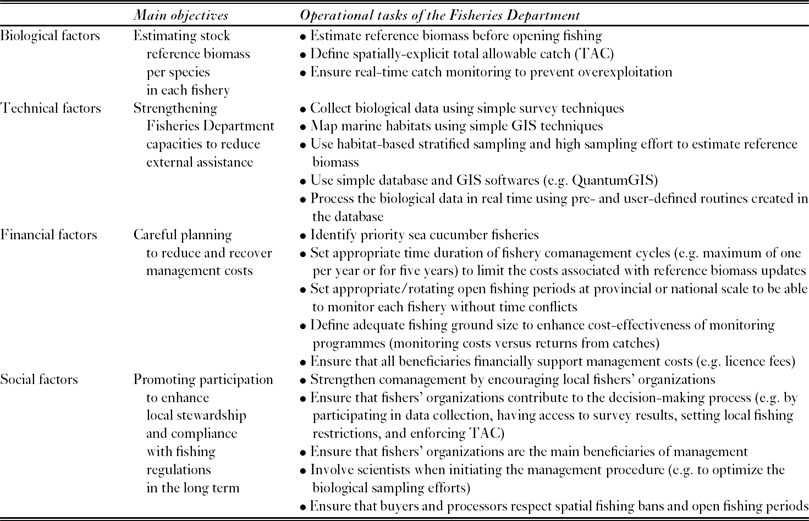
As agreed by relevant stakeholders, a RB forms the basis of the local comanagement system in New Caledonia. Although, we cannot be certain whether the measures can be applied generally, an extended comanagement system may improve the resource sustainability of artisanal sea cucumber fisheries over larger spatial scales. Our results suggest that multispecies sea cucumber fisheries management at large spatial scales should account for spatially-explicit regulatory measures, individually set for each commercial species, given marked difference in biomass estimates among fishing grounds. The Vanuatu Fisheries Department plan to implement this strategy at a national level, while this is initiated at a provincial level in New Caledonia. A spatial management framework is currently under development to fine-tune fishing regulations to the ecology of the resources and the activities of the fishers (Perry et al. Reference Perry, Walters and Boutillier1999; Orensanz et al. Reference Orensanz, Parma, Jerez, Barahona, Montecinos and Elias2005) (Table 2).
Methodological guidelines for implementing a spatial comanagement framework for small-scale sea cucumber fisheries. Biological, technical, financial and social factors should be considered by fisheries departments to fine-tune fishing regulations to the ecology of the resources and the activities of the fishers. GIS = geographical information system.
This framework should be rationalized using the long-term technical, financial and enforcement capacities available to government agencies. Specifically the spatial generalization of RB-based comanagement involves determining and enforcing TAC-based regulations on an appropriate spatial scale. For statistical and stock assessment purposes, we required habitat surface areas, which we derived from the interpretation of high-resolution satellite images using GIS. There is evidence that different habitat typologies and thus different maps yield different stock estimates (Andréfouët et al. Reference Andréfouët, Gilbert, Yan, Remoissenet, Payri and Chancerelle2005, Reference Andréfouët, Friedman, Gilbert and Remoissenet2009; Gilbert et al. Reference Gilbert, Andréfouët, Yan and Remoissenet2006; Hamel & Andréfouët Reference Hamel and Andréfouët2010). An optimal habitat typology was generated in the New Caledonian case study through remote-sensing image processing. This did not markedly alter the initial spatial segmentation and number of habitats (described in the Methods section) and yielded stock estimates similar to those identified by the initial simplified map. Validation of the method for seagrass-dominated habitats proved that simple habitat mapping methods can provide reliable and accurate estimates of sea cucumber stocks. This provides an important lesson about the spatial generalization of sea cucumber fisheries management for countries with little remote-sensing expertise (Andréfouët Reference Andréfouët2008). Easy access to free user-friendly GIS softwares (such as QuantumGIS) may strengthen the GIS capacities of government agencies in a growing number of countries in the near future.
Management costs (for monitoring, participative planning and decision-making, enforcement and controls) represent common limitations for small-scale fisheries comanagement and should be closely considered when implementing the framework. Our study showed that a single snapshot stock survey would be adequate to update the RB and set the TAC in single and multispecies sea cucumber fisheries. Allowed catch may also be concentrated by setting few and short open fishing periods, as in the New Caledonian sandfish fishery. This would permit a significant reduction in the costs of data collection as compared to the biological and fishery monitoring programmes that are usually recommended for quota-based management systems. In our case studies, the start-up and recurrent costs of the RB monitoring ranged from US$ 47 km−2 to US$ 93 km−2 and from US$ 147 km−2 to US$ 514 km−2, respectively (Table 3). These costs varied according to the extent of the survey area and the transport costs incurred by Fisheries Department officers. Recurrent catch monitoring costs were US$ 58–204 km−2 in the New Caledonian study site according to the number of fishing periods (and therefore sale dates) opened to reach the TAC. In this fishery, total recurrent costs averaged US$ 240 km−2 in 2008 and 2012, namely 10.9% and 1.6% of the returns from sandfish catches, respectively.
Start-up and recurrent costs for monitoring sea cucumber reference biomass (RB) in the survey sites in New Caledonia (A) and Vanuatu (B, C, D). Catch and associated incomes were not monitored in Vanuatu due to the moratorium on sea cucumber harvesting at the time of the survey. Start-up costs included marine habitat mapping by Fisheries Department officers (such as high resolution satellite image purchase and analysis through geographical information system) in fishing areas. Recurrent costs included RB and catch monitoring costs at each comanagement cycle. RB monitoring costs included field surveys for collection of sea cucumber data (namely transport costs, daily Fisheries Department officers’ field allowances and wages and other functioning costs), data analysis (namely data entry in a database and estimation of biological indicators using pre- and user-defined routines), and shared decision process between Fisheries Department officers, fishers’ organizations and local communities (such as meetings for survey planning and setting of total allowable catch [TAC] before and after field surveys, respectively). Catch was monitored at sale dates for each open fishing period to check compliance with the TAC. TAC was reached after two to seven open fishing periods among comanagement cycles. The comanagement system did not led to greater infrastructure and equipment depreciation costs for the Fisheries Departments. These costs were therefore omitted here. *Reference costs of Fisheries Department officers: US$ 350 day−1 (New Caledonia) and US$ 50 day−1 (Vanuatu).
Management costs have been fully covered by public institutions (scientists and Fisheries Departments) and fishers in our case studies. However, this option would not be affordable on a large scale or in the long term in countries with limited financial resources. Fisheries management costs should rather be internalized, proportional to expected financial returns from catches and supported by all beneficiaries following the widely accepted ‘user-pays principle’ (FAO 2003; Hilborn et al. Reference Hilborn, Parrish and Litle2005; Purcell Reference Purcell2010a). The shift from high- to low-value species and the slow replenishment of severely depleted sea cucumber fisheries (see Uthicke et al. Reference Uthicke, Welch and Benzie2004; Friedman et al. Reference Friedman, Eriksson, Tardy and Pakoa2011) would undermine the financial levy of fisheries departments to support RB assessments and comanagement processes. However, management costs may be rationalized with expected returns from catches by (1) implementing the spatial management framework in key sea cucumber fisheries, (2) setting fishing, processing and/or exporting licence fees proportionally to allowed catches, and/or (3) decreasing the frequency of open fishing periods and RB assessments in depleted and/or low-value fisheries (Table 3). Cost-benefit analysis may be performed to use the RB as a limit reference point, so only fisheries that are expected to provide appropriate returns from catches relative to management costs would be opened.
We found that local social factors also played an important role in the implementation of the RB, through comanagement and the participation of different stakeholders, in particular fishers, landowners, Fisheries Department officers, buyers and scientists (Table 2). Notably, the enhanced responsibility and accountability of the fishers’ organization in New Caledonia promoted complex management arrangements that would not have been achieved if the Fisheries Department had acted in isolation. The fishers’ organization improved the legitimacy and therefore the acceptability of long-term regulatory measures (Jentoft Reference Jentoft1989). Our results indicate three arguments for involving local fishers’ organizations in sea cucumber fisheries comanagement. Firstly, sparse scientific data on the spatial dynamics of sea cucumber populations mean that social and economic conditions often drive the spatial boundaries of fisheries and therefore define the area appropriate for RB monitoring (Sen & Nielsen Reference Sen and Nielsen1996; Wilson et al. Reference Wilson, Ahmed, Siarb and Kanagaratnamb2006). Secondly, biological monitoring should involve both fishers’ organizations and Fisheries Department officers given the widely-recognized advantages offered by participatory monitoring programmes (see Danielsen et al. Reference Danielsen, Burgess and Balmford2005). As highlighted by Walters and Pearse (Reference Walters and Pearse1996), we also observed that the precautionary approach encouraged fishers to get involved in the field surveys (a recurrent weak point of TAC-based management) as a means of increasing sample size and improving the accuracy of the RB. Lastly, monitoring the RB is largely contingent on the sustainability and enforcement of regulatory measures by both government and local management institutions and on a shared decision-making process. This means that the responsibility for fisheries management should be partly held by fishers’ organizations operating at small spatial scale (for example Yamamoto Reference Yamamoto1995; Castilla & Defeo Reference Castilla and Defeo2001). Fishers’ organizations may mobilize the local social capital more easily than Fisheries Departments. They facilitate the decision-making process, improve conflict management and have distributive effects based on collective and individual preferences (Willmann Reference Willmann and Shotton1999). For example, the role of the fishers’ organization in restricting fishing effort and allocating fishing rights in the sandfish fishery in New Caledonia was an essential support to TAC-based management. It greatly facilitated catch monitoring and acted as an additional precaution against possible excessive catches (Stefansson & Rosenberg Reference Stefansson and Rosenberg2005). Allocating individual quotas while the number of fishers was increasing has also secured individual returns, and therefore encouraged the involvement of fishers in a long-term comanagement strategy (Scott Reference Scott and Shotton1999; Parma et al. Reference Parma, Hilborn and Orensanz2006). Fisheries Departments may retain responsibility for large-scale planning, estimating RB, fixing TAC size, setting and enforcing complementary national regulations through increased technical, financial and enforcement capacities. Innovative comanagement arrangements between government and fishers’ organizations may be required to optimize the implementation of local and government regulatory measures in the long term.
CONCLUSIONS
The comanagement system implemented in a small-scale sandfish fishery in New Caledonia since 2008 has succeeded in markedly increasing both resources and catches. Harvestable stock biomass was a very effective sustainability indicator when incorporated in this TAC-based comanagement system. We found that spatial collective quotas associated with territorial fishing rights could be appropriate management tools under certain conditions in small-scale sea cucumber fisheries, both ecologically and economically, as widely observed in artisanal comanaged fisheries (Gutiérrez et al. Reference Gutiérrez, Hilborn and Defeo2011). We observed that the synergy between biological and economic performance of fisheries may improve the resilience of comanagement at a local level. It may also buffer the effects of market fluctuations and any change in local leadership. More globally, the study therefore confirms that community-based management may offer suitable conditions for the implementation of TAC and comanagement arrangements in sea cucumber fisheries in Pacific Island countries, where resource status is a major concern (Aswani Reference Aswani2005).
This study proposes an innovative TAC-based management strategy to artisanal sea cucumber fisheries based on both fine-scale and large-scale regulatory measures. The assessment method of the RB can provide reliable and accurate estimates of sea cucumber stocks in multispecies fisheries. The spatial and social upscaling of the comanagement system will be challenging, as it has thus far only been applied to a single species fishery. As part of a new management strategy, the generalization of this system to multispecies fisheries involving a large number of fisher communities is currently being investigated at a provincial level in New Caledonia and a national level in Vanuatu, using the practical assessment and management guidelines provided by this study.
ACKNOWLEDGEMENTS
This study was funded by the French Ministry of Environment (LITEAU Program, COGERON Project), the French Ministry of Foreign Affairs (Pacific Fund), the Government of New Caledonia, the Northern Province of New Caledonia, and the Government of Vanuatu (Fisheries Department). We thank the chiefs, the landowners, the fishers and other stakeholders in the communities for their trust and commitment to improving the management of sea cucumber fisheries in New Caledonia and Vanuatu. We thank Kalna Arthur, Rocky Kaku and Georges Amos for their help in data collection. We are also grateful to Jon Galligan and two anonymous reviewers for their careful reading of the original manuscript and their valuable comments and suggestions.