

1. Introduction
Diagrams and all types of doodles are widely used in theoretical physics. They help physicists to create new models and to understand their implications. However, the exact way physicists work with graphic representations is still poorly understood. The main reason why the analysis of non-verbal scientific representations is still at its beginnings is that we lack sophisticated tools for understanding the semantic properties of these representations, while we already possess a rich toolbox for the analysis of formal languages, and, to a lesser extent, natural language. Moreover, it is not certain that the semantic analysis of diagrams, understood as the study of the conditions at which they can be seen as conveying meaning about a situation, can be unified. Even though research regarding the use of diagrams in logic is very active (see for instance Chandrasekaran et al. Reference Chandrasekaran, Glasgow and Narayanan1995; Hammer Reference Hammer1995; Shin Reference Shin1994) and research on the use of diagrams in mathematics is developing (Mancosu et al. Reference Mancosu, Jørgensen and Pedersen2005), it is difficult to apply the results of research when it comes to empirical sciences because more aspects are involved, including visual appearance and resemblance, whose role in the epistemology of pictures in general is highly controversial (Lopes Reference Lopes1996; Hopkins Reference Hopkins1998).
The purpose of the present paper is to investigate the content of diagrams and doodles and study the impact they may have on scientific practice. The main claim of the paper is that diagrams efficiently contribute to the cognitive process that enables understanding a theoretical model in physics. In order to establish this claim, I provide an analysis of the role of diagrams in the practice of theoretical modeling. This analysis relies on a fictional account of models based on Walton's approach.
The diagrams and doodles drawn by theoretical physicists, either during the research phase or when teaching or writing papers and textbooks, are usually highly ambiguous in the sense that they can be understood only relying on background information. For instance, a physicist who displays a diagram during a talk always points to some parts of it and gives the audience the relevant information to understand it clearly. In papers and textbooks as well, the legend and the cross-references to the figures in the text constitute obligatory supplementation to the figures. Physicists’ diagrams do not stand on their own and they cannot be understood independent of the legend and text, and have thus to be accompanied by natural language (sometimes connecting them to mathematical formulae or equations). For sure, this feature of non-verbal representation does not disjoin diagrams from linguistic representations, since hardly any single sentence in a physics paper can stand on its own either. Usually, it cannot be understood unless the reader knows a lot about the topic of the paper. Diagrams and linguistic representations are thus comparable with respect to their lack of semantic and epistemic autonomy when they are part of a paper in physics. Admittedly, sentences form linguistic units and are easier to analyze as such than diagrams from the semantic point of view; however, from the reader's point of view, both sentences and diagrams are impossible to grasp without relevant background information. So, neither diagrams nor sentences stand on their own, as both lack autonomy in the sense that they depend on context in order to be interpreted and understood.
Nevertheless, it has long been taken for granted by historians and philosophers of science that non-verbal representations are redundant vis à vis the text and that they cannot be understood without it. For instance, Baigrie regrets the “privilege given to theory in the image of science inherited from logical positivism” (Baigrie Reference Baigrie1996, xvii): “scientific knowledge has traditionally been taken to be encapsulated in theories which, in turn, are interpreted by the logical empiricists as axiomatic systems. The primary mode of scientific representation for the logical empiricists is linguistic.” He adds that
despite the publication of a number of important historical studies on the role of pictorial devices in particular sciences during the last quarter century [see Rudwick Reference Rudwick1976 and Ferguson Reference Ferguson1977], the textual deposits of scientists and scientific illustration are still generally regarded by science studies scholars as fundamentally different modes of expression. . . . Coupled with the deep-seated conviction that human thinking takes place in words, the supposition persists that the pictures in science are psychological devices that serve as heuristic aides when reasoning breaks down. . . . What distinguishes pictorial devices as resources for doing science, and the special problems that are raised by the mere presence of visual elements in scientific treatises, tend to be eclipsed by philosophical worries about the nature of representation. (Baigrie Reference Baigrie1996, xviii)
Giere develops this point further:
In the framework of logical empiricism, . . . there can be no fundamental role in science for non-linguistic entities like pictures or diagrams. Such things might, of course, play some part in how scientists actually learn or think about particular theories, but unless their content is reduced to linguistic form, they cannot appear in a philosophical analysis of the content or legitimacy of any scientific claims to knowledge. (Giere Reference Giere and Baigrie1996, 270; emphasis in orginal)
He insists that “Kuhn himself did not highlight the role of visual or other non-propositional modes of representation in science” (ibid.). As a consequence of this past situation, diagrams and pictures have only recently been studied as interesting objects of historical or philosophical enquiry (among the recent papers taking the role of scientific pictures seriously, let us mention Kaiser Reference Kaiser2005; Lynch Reference Lynch1988; Lopes Reference Lopes2009; Perini Reference Perini and Malcom2004 and Reference Perini2005a, Reference Perinib, Reference Perinic).
It remains that physicists make massive use of diagrams and doodles. The present paper investigates how they impact scientific practice. It assumes that the elaboration of theoretical physics is not only a matter of mathematics and other formalized languages and that much has to be gained from the systematic study of various representational formats (as Humphreys Reference Humphreys2004 convincingly argues). Humphreys does not focus on the pictorial format in his book, but his claim that “syntax matters” may be applied to pictures as well as to equations: in the same way that finite difference equations differ from differential equations, so does a naturalistic line drawing of a teal differ from a photograph of a teal of the same species. These differences are highly relevant to the role scientists assign to equations, in respect to pictures.
In Section 2, I present examples in which diagrams do participate in building up the model and, consequently, in transmitting its meaning. Section 3 is devoted to an analysis of the role of diagrams in the practice of theoretical modeling. To elaborate on such an analysis, I rely on a fictional account of models. In Section 4, I show the advantages of the fictional approach.
2. Examples
The diagrams I am going to analyze in this section are commonly used in polymer science since the 1970s. They are not pictures of actual polymer chains, the relevant features of which are not observable, but of idealized chains. Thus they display theoretical models of the behavior of these chains in various circumstances.
2.1. The self-similar grid
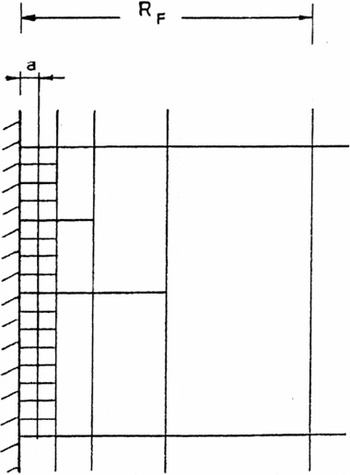
The diagram reproduced in fig. 1 represents, as indicated in the original caption, an (idealized) adsorbed polymer layer. A polymer is a macromolecule, that is, a molecule with a high molecular weight. It is made out of a sequence of several macromolecules (typically several hundreds) called “monomers,” which are the chemical units of the polymer chain. The polymer chain, when put into a liquid (in a solution) can be imagined as a very long noodle.
Diagram of the concentration gradient of polymer chains in solution at an interface (de Gennes Reference Gennes1987, 27). (Original caption: “An adsorbed polymer layer represented as a ‘self-similar grid.’ At any distance, z, from the wall, the local mesh size is equal to z.”)

Polymers have numerous industrial applications. In order to improve them, it is important to have detailed knowledge of the chains’ behavior in various situations. The situations in which manufacturers want to better control the interfaces, that is, the contact surfaces between a solution of polymer and a solid, or air, have been studied extensively. Theoretical accounts of the behavior of polymers at an interface are rather recent, but already substantial. Polymer chains are said to be “adsorbed” when some of them, those which are close to the interface with a solid surface, get attracted to it, and hang on to it. As the detailed behavior of polymer chains at an interface cannot be seen through a microscope, because it occurs in three dimensions, how and why the chains are adsorbed is a matter of theoretical investigation. Moreover, the validity of the involved hypotheses cannot be assessed in any simple way by currently available observations.
The diagram presented in fig. 1 is part of a theoretical model of adsorption in which the concentration of adsorbed polymer chains increases as they get closer to the surface. This model has been proposed by Pierre-Gilles de Gennes (1932–2007), a theoretical physicist who has mainly worked in the field of condensed-matter physics. He won the Nobel Prize in 1991 for his pioneering work on liquid crystals and polymer physics. In the paper from which the diagram is taken, he puts forward (among other achievements) a new theoretical model of adsorption. This model was entirely different from the ones that had been proposed beforehand, which tried to describe the adsorption phenomenon from complex calculations based on the analysis of the individual motions of the polymer chains. By contrast, de Gennes first figures out the global geometrical aspect of the solution in the vicinity of the interface. In this new approach, the goal is to discover the ratio at which the concentration of adsorbed polymer chains increases as they get closer to the wall. The ratio is given both as a graphical representation in the diagram and a symbolic representation in the text, in the form of a power law of ratio a/z, a being the size of a monomer, and z the distance to the wall. The diagram thus presents the geometrical structure of the adsorption schema.
Let me now analyze the way in which the diagram displays the logic of the adsorption phenomenon. First, it is important to notice that the diagram represents the variation of the polymer chains’ density relative to the distance from the interface. The geometrical structure of the diagram is a “self-similar grid,” which means that the ratios among the sizes of the diagram's cells is the same throughout the whole grid, except for their size: in the diagram, the left half of each cell is cut into two equal cells, and this construction procedure goes on like that (this is what “self-similarity” means) until the interface is reached. Anyone familiar with the notion of self-similarity will recognize it just by taking a quick look at the diagram. Moreover, the notion of self-similarity is contained in the power law which is at the heart of the mathematics of the model. Thus, the diagram appears to be “just” a graphical expression of the power law equation. But is it really?
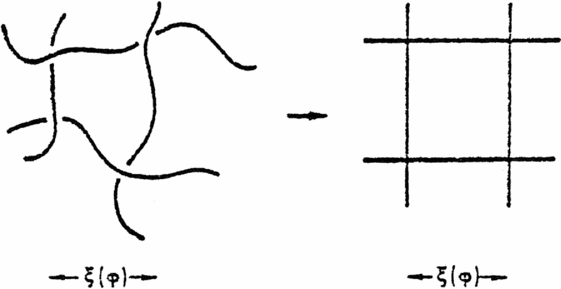
The foregoing figure in the paper (here, fig. 2) graphically explains the idealization governing the make-up of the diagram presented in fig. 1. Whereas polymer chains build up supple entanglements when placed into a solution (as shown on the left), the structure they form can be represented in a more mathematically tractable way by replacing their noodle-like aspect with a grid composed of straight lines (as shown on the right). Replacing the curved shape of the polymer chains by straight lines allows for a simpler geometrical treatment.
Idealization procedure explaining the construction of fig. 1 (de Gennes Reference Gennes1987, 27). (A polymer solution (volume fraction φ) idealized as a “grid” with the same mesh size, ξ(φ). ξ = aφ−3/4)
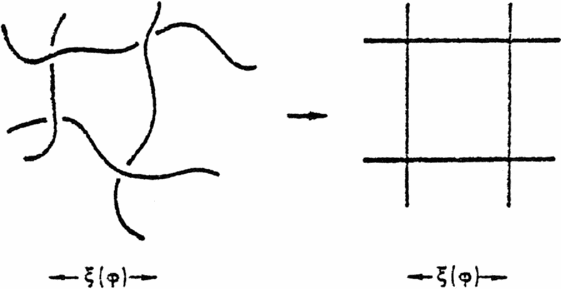
It has to be further noted that fig. 2 is self-sustaining as a vehicle of meaning (for someone who already possesses the background knowledge about polymer physics that is needed to understand the paper). Its content is not otherwise expressed anywhere in the paper. As it is critical to understand it in order to fully understand the diagram of the self-similar grid, it can be said that this diagram contains a part of the content of the paper which is not repeated in the text: someone who understands fig. 2 will also understand that fig. 1explains why polymer chains can be seen as building up a self-similar grid when they get adsorbed at an interface. According to de Gennes’ hypothesis in the paper, they indeed get entangled in such ways as to build up a concentration gradient idealized by a self-similar grid.
To sum up, this example shows that a diagram (fig. 1), accompanied by its generation procedure (fig. 2), may have a richer content than the equation it accompanies. The diagram in fig. 1 is not just a graphical display of a mathematical formula, since it also contains a physical hypothesis about how polymer chains get entangled near an interface: the physical hypothesis is that the adsorption phenomenon follows a power law, represented by the structure of the self-similar grid.
2.2. Grafted surfaces
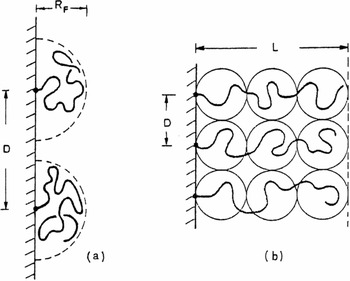
Fig. 3 shows two more models of the behavior of polymer chains at an interface. The surface in contact with the polymer solution is “grafted,” namely, it has been prepared in such a way that the polymer chains get chemically attached to it (and not only adsorbed). Two grafted regimes are hypothesized through these images: the “mushroom regime,” fig. 3 (a), and the “brush regime,” fig. 3 (b). These diagrams show the behaviors of polymer chains in two limiting situations in good solvents: the “brushes” appear when the grafting density is high, whereas the “mushrooms” are hypothesized when the grafting density is low. So, the solution at low densities is modeled in the following way: each chain is isolated, occupying roughly a half-sphere with a radius comparable to the radius of gyration. At high densities, polymers stretch away from the interface to avoid overlapping, forming a “brush.” Even though the words “mushroom” and “brush” strongly suggest the way the polymer chains are arranged close to the wall, the diagrams add important information. Let me quote the paper:
In good solvent conditions, the chains repel each other and the grafting reaction terminates when the chains are disposed like adjacent “mushrooms” [reference to figure 3 (a)]. In some favorable cases, one can push the density of grafted points to higher values; the result is the “brush” [of figure 3 (b)], with a relatively thick region of constant concentration. (de Gennes Reference Gennes1987, 192)
The diagram conveys information about the meaning of the non-overlapping condition: without it, one may have to imagine that the chains could stretch further from the wall in the low density regime, for instance.
Grafted surfaces. Two types of grafted surfaces: a) low grafting density – the distance between heads D is larger than the coil size RF (this is the “mushroom” regime); b) high grafting density D < RF (the “brush”).

What is thus remarkable in these examples is the interplay between the drawings and the metaphors (“brush,” “mushroom”) coming from everyday language. This interplay provides the models’ users with a mnemonic device helping them to keep track of the difference between the various hypothesized regimes.
3. What Theoretical Models Represent
The examples presented in Section 2 show that diagrams can be on the same footing as mathematical and linguistic representations when theoretical models are introduced and discussed. Why is it so? Two complementary answers may be given to this question. (i) It is only a matter of cognitive ease; using only mathematical and linguistic expressions would be too awkward, and cognitively difficult to handle. (ii) Diagrams do make a positive contribution to the presentation and understanding of theoretical models; they allow for a richer and more precise presentation.Footnote 1 I shall first elaborate on the implications of answer (i) and then begin an argument in favor of answer (ii) that will go on in Section 4. The starting point of this argument is a discussion on the nature of theoretical models.
3.1. About the cognitive tractability of diagrams
The use of diagrams in physics may be considered both a virtue and a vice: first, physicists can communicate quicker and easier by diagrams than by complicated equations, this cognitive ease is the virtue; second, the price paid for this cognitive ease of access is vagueness, the vice. In his severe criticism against models and modeling in chap. 4 of his book, Pierre Duhem (Reference Duhem1906) claims (in his own terms) that vagueness is too high a price to pay for cognitive ease. Duhem does not focus on diagrams; he rather contrasts (British) models and (French and German) abstract theories. However, Maxwell's and Thomson's papers are full of diagrams, so that Duhem's criticism may legitimately be conceived as applying to diagrams as well as models. Let me analyze further the balance between cognitive ease of access and vagueness in this section.
Why are diagrams so efficient in conveying information about what they represent? The main reason is that our visual system is particularly apt at processing two-dimensional (as well as three-dimensional) information (see for instance Kennedy Reference Kennedy1974; Cavanagh Reference Cavanagh1995). The ubiquity of drawing in all human cultures is probably due to this physiological and cognitive characteristic. Our aptitude for processing visual information is much used in everyday life. There is no reason why it should not be used in scientific activity, except for ideological reasons (as an example of such a denial of images, one can mention the group of French mathematicians Bourbaki, who forcefully forbids the use of pictures in mathematics).
From a cognitive-science perspective, ease of understanding is the advantage of diagrams; however, their use in mathematics and physics is commonly associated with the cognitive limitations of human beings, as if ease was deemed to entail potential misunderstanding. In this common view, diagrams are just temporary expedients that are only used in contexts where mathematical rigor is either not necessary because everyone in the audience could introduce it if needed, or not yet available. In the latter case, diagrams are provisional and indicate a road toward a more complete formulation, whereas in the former, they are used as reminders of the more rigorous formulation. The traditional attitude does not take diagrams seriously, as genuine vehicles of information. It assumes that physicists make doodles when they cannot find the right words, equations, or even concepts, or that these doodles are only cognitive aids, without playing any role of their own.
The traditional view regarding diagrams is based on another widely shared assumption according to which content is most adequately conveyed by language, more precisely by formal language. In this view, formal language is conceived as the ideal means of representation and communication. For sure, the defenders of this view admit that scientists do not only, or even mostly, communicate with formal language, but they interpret this fact as a sign that, as human beings, scientists are cognitively limited. Another consequence of the traditional view is that diagrams are seen as merely aids to help readers understand propositions that are already expressed in a text, or that could at least be expressed linguistically. However, we would like to know how diagrams help people understand the parts of physics in which they appear. Laura Perini has proposed an interesting hypothesis in the case of some models in biology (Perini Reference Perini2005b, Reference Perinic).
3.2. The nature of theoretical models
In section 3.1, I have examined answer (i) to the question why diagrams are capable as mathematical and linguistic representations to introduce theoretical models: because their use is cognitively easier than the use of equations. I now turn to the second answer, according to which diagrams make a positive contribution to the presentation and understanding of theoretical models because they allow for a richer and more precise presentation. In this section, my aim is to analyze how diagrams are involved in the modeling activity. Relying on the examples presented in section 2, I shall show that diagrams are even indispensable in the modeling practice. In order to fulfill this aim, I first turn to a proposal about the nature of theoretical models.
Theoretical models are used in virtually every field of science, but no one has yet proposed an analysis of their nature upon which there might be general agreement. On the one hand, theoretical models are usually seen as too heterogeneous to be analyzed on some common ground; on the other hand, the historical and philosophical literature on models is despairingly copious (see for instance Black Reference Black1962; Chadarevian and Hopwood Reference Chadarevian and Hopwood2004; Frigg Reference Frigg2010; Giere Reference Giere2004; Godfrey-Smith Reference Godfrey-Smith2006; Hughes Reference Hughes1997 and Reference Hughes, Morgan and Morrison1999; Morgan and Morrison Reference Morgan and Morrison1999). In this section, I rely only on a small part of the abundant literature in order to present a view of models that provides a conceptual framework in which the role of diagrams in modeling is better understood than in other views.
Following Nancy Cartwright's claim that “models are works of fiction” (Cartwright Reference Cartwright1983, 153), I claim that a theoretical model is a representation of a fictional situation (Barberousse and Ludwig Reference Barberousse, Ludwig, Barberousse and Ludwig2009). There are other fictionalist positions with respect to models (Woods Reference Woods2010; Suarez Reference Suarez2009). The main argument in favor of this thesis is that models often represent situations which we know are impossible according to our best theories of the phenomena in question. The prima facie paradox arising from the claim that scientists play with fictions vanishes when it is added that these fictions are related to investigated phenomena through intricate relationships of idealization and approximation. The main point of theoretical modeling, and its main difficulty, is evaluating the validity of hypotheses by justifying the use of such and such idealization or approximation in given cases. This is a notoriously difficult task (cf., e.g., Redhead Reference Redhead1980; Laymon Reference Laymon1991). Even the plausibility of these hypotheses is usually hard to assess. In most cases, we do not know how to describe, in a precise and unproblematic way, the relationships between the fictional situation represented by a model and the experimental situation whose meaning and structure the model is supposed to make clear, for instance by explaining some aspects of it. This is the reason why diagrams may also be useful in suggesting new experiments: as their meaning is not entirely fixed, they may prompt new ways of investigating the phenomena they aim at representing, ways that were not used before.Footnote 2
The above characterization of models has to be complemented with an account of their epistemic value and fruitfulness. In order to achieve this goal, let us first describe the cognitive relationship we entertain with fictions. From the point of view of the producers and users of fictions, a fiction is a representation whose function is to help its interpreter imagine a certain content. A novelist, for instance, implicitly asks her readers to develop a certain type of attitude towards the propositions expressed in the narration. The required type of attitude, which we, as readers, usually adopt without effort, is the attitude of make-believe or imaginative implication (Currie Reference Currie1990, 18). In a nutshell, the intention of the novelist is that the reader will make believe that the story is true.
In reading novels or watching movies, we adopt the attitude of make-believe for the sake of entertainment. In working on theoretical models, by contrast, we look for explanations or other epistemic goods. Needless to say, the imaginative game is severely constrained by this quest. Here is an attempt to describe it: the scientific-imaginative game consists in bracketing the concepts that lead to contradictions between the model and commonly accepted theories within the relevant field. These contradictions are the reason why models are often qualified as literally false representations (see for instance, Redhead Reference Redhead1980; Godfrey-Smith Reference Godfrey-Smith, Barberousse, Morange and Pradeu2008). They are indeed literally false about the experimental situations they contribute to describing and explaining; however, to leave off at that point would be unsatisfactory. It is the epistemic fruitfulness of models that requires explanation, not their bare falsehood. In order to account for the fruitfulness of models in spite of their being literally false, let us take a simple example. In so-called “billiard ball” models of gases, the term “molecule” takes on a meaning different from the meaning it has in our best physicochemical theories: in the model, “molecule” refers to perfectly elastic spheres, whereas in our best physical theories about molecules, they are far from being elastic. Thus, what the model implies about molecules contradicts what the best available theories of molecules say they are. However, more has to be said about the meaning of the word “molecule” in the billiard-ball model than mentioning this contradiction. What is more important than the bland contradiction is that the meaning of the concept of molecule is left partially indeterminate within the model. When exploring the implications of the model, we only assume that “molecules” are perfectly elastic spheres, without knowing, e.g., how atoms are combined within such spheres. Generally speaking, models are (sometimes) the way to theoretical innovation precisely because the meanings of some concepts within them are left indeterminate. This important feature sets the rules of the game of scientific make-believe in modeling.
The conception of models presented above relies on the commonly accepted assumption that the meaning of a concept depends on its context of use (cf. for instance Preyer and Peter Reference Preyer and Peter2005). In the case of fiction, the context of use includes the imaginative project of the interpreter. Now, the interpreter's project, that is, its aim in entering the fiction, participates in determining the meaning of the very concepts that are used in the description of the imagined situation. For instance, when reading a novel from Jane Austen, the reader's knowledge and expectations about nineteenth-century English society influence her understanding of the plausibility of the ongoing engagements. Contemporaries’ plausibility appraisal were probably slightly different from ours. The construction of theoretical models proceeds in the same way: they are made up of concepts the meaning of which is not the usual one. It is not completely fixed, which gives way to (controlled) theoretical innovation.
An important consequence of this conception of theoretical models is that when we grasp a model, as when we look at or read an artistic fiction, part of our concepts are reorganized. This reorganization is sometimes deep and upsetting, for instance when a student discovers the specificities of quantum physics.Footnote 3 However, it may be more benign. My point here is that as soon as one is willing to try to understand the content of a model, she is also willing, consequently, to accept a (sometimes provisional) change in her epistemic framework. Some relationships between concepts, as well as the very meaning of these concepts, may be transformed. For instance, physicists working with the so-called “liquid-drop model of the nucleus,” which is a semi-empirical model (both relying on currently accepted fundamental principles, and on relationships that have been empirically established), have to (provisionally) change their view on electromagnetic forces and nuclear forces within the nucleus relative to what the standard model, which is the best available theory of elementary particles, implies.
The conceptual reorganization required by the use of models is often guided by words or other symbols acquiring new meanings as they appear in the model. For instance, the words “brush” and “mushroom” acquire new meanings when they are used within de Gennes’ model of grafted polymers. The new meanings that symbols acquire within models have two important peculiarities: (i) they are given by idiosyncratic concepts, which are built up within the model itself and (ii) they are not always expressed by words or other symbolic notations, but may also be presented by means of diagrams. In the next section, I give an account of the way diagrams may contribute to the content of theoretical models.
4. Diagrams as Parts of Models
In section 3, I have presented a fictional framework in which models are analyzed as fictions. Within this framework, it is the cognitive abilities of scientists to handle fictional situations that account for the fruitfulness of models in spite of their being literally false about the investigated situations. The aim of the present section is to show that this approach makes the role of diagrams in modeling clearer. I first present an analysis of how diagrams may contribute to modeling that is based on Walton's work. In section 4.2, I provide illustrations of this analysis in two contexts where scientific diagrams are used: teaching and research.
4.1. Diagrams as “props”
In a nutshell, the main claim I am going to argue for in this section is that diagrams, like equations and verbal descriptions, are tools that enable scientists to imagine the situation represented by a model. When seeing and understanding a diagram, a scientist is guided toward the idealized situation it points to, in the same way as a written sentence steers the reader's mind toward the situation it describes, be it real or fictional. The difference between a diagram and a sentence is that usually a diagram is worth several sentences.
Let us now investigate the ways in which a diagram facilitates cognitive access to a model. The first point to notice is that as a model represents a fictional, that is, an unreal situation, there are aspects of it that are radically different from the situations we are acquainted with, either through perception or through theoretical knowledge. Already known situations are of limited guidance when one is trying to grasp a new, theoretical model. More precisely, as we saw in section 3, the fictional situation represented by a model usually conflicts with the implications of the best available theories in the field. For this reason, the fictional situation is especially difficult to figure out – even by the designers of the model. In this context, which is highly specific to scientific activity because a model, even though accessible only by imagining a fictional situation, is nevertheless strictly constrained by the requirements of empirical adequacy. Diagrams may play a distinguished role: they may be more efficient than sentences, either in formal or natural languages, to guide the formation of an imagined situation in the reader's mind that would be compatible with the available information on the model.
In the context of the current theories of imagination, the role I just described for diagrams has been termed “prop” by Walton. I thus claim that diagrams presenting theoretical models (on a par with equations and verbal descriptions) may be analyzed as “props,” or “generators of fictional truths.” Here is how Walton characterizes props:
Props are generators of fictional truths, things which, by virtue of their nature of existence, make propositions fictional. . . . A doll makes it fictional in a child's game that there is a blonde baby girl. Representational works of art are props also. (Walton Reference Walton1990, 37–38)
Diagrams, as well as mathematical and linguistic expressions, may usefully be considered as props guiding the physicists’ minds toward the model's theoretical content, and helping them to figure out what this content may be. Before coming back to the examples given in section 2 in order to give more flesh to this analysis, let me note that this interpretation is corroborated by Walton's description of the role of props:
The role of props in generating fictional truths is enormously important. They give fictional worlds and their contents a kind of objectivity, an independence from cognizers and their experiences. (Ibid., 42)
Can the diagrams presented above be analyzed as props? Let us first focus on fig. 2. By first giving a picture of entangled polymer chains that is close to what a realistic picture could be, fig. 2 is aimed at convincing the reader that the diagram on the right, which is the building block of the diagram in fig. 1, is nothing but a further idealization. It does not add or retrieve anything important. The function of fig. 2 is thus to induce in the reader's mind the conception that the idealization on the right, and thus the basic components of fig. 1, are scientifically acceptable. Let me add that this conception would be very awkward to express by words (even the ongoing comment is much clumsier that the figure!): a wordy paraphrase would claim that it is plausible to idealize the basic element of polymer-chain entanglement as a rectangle. But it may immediately be recollected that the paraphrase looks arbitrary, whereas the diagram is a plausible idealization.
Let us now turn to fig. 3. For sure, the verbal metaphors “brush” and “mushroom” can already be considered as props: they guide the reader's mind toward grafted regimes that are neither random nor entirely ordered. However, the diagrams make the reader understand that not every imaginable “brush” or “mushroom” are meant. They give details about the mushroom's size and about the layout of the brush's hairs, so to speak. Whereas the equations describing the two limiting regimes only bear on quantifiable properties of the polymer chains, the diagrams give an idea of their spatial layout. What is important here is that the spatial layout can only be imagined, not exactly represented; relying on this specificity, the diagrams strongly add to the model's plausibility. May it be only a sort of rhetorical effect, if the extension of the term “rhetoric” to diagrams is allowed? It is difficult to answer this question. What is testified, however, is that both the metaphors and the diagrams are commonly used by now in papers investigating the properties of grafted chains of polymers. At least, the diagrams are props in the sense that they give the model “a kind of objectivity,” detaching it from its inventor, and allowing inter-subjective reference.
I have just sketched an analysis of diagrams as props, considering them in the same way as sentences in natural or formal languages in scientific papers. The question may arise as to the nature of the difference between diagrams and sentences with respect to this function. The above examples can guide us toward possible answers. Take fig. 2. The schema on the left (a) manifests itself, so to speak, as a first idealization, for real polymer chains can hardly be found in such a configuration. To put it differently, it generates the fictional truth that polymer chains implement this configuration. The schema on the right (b) exhibits how this configuration can be further idealized. This part, when complemented with fig. 1, generates in turn the fictional truth that the mathematical treatment of the phenomenon in terms of a power law is plausible. It seems hard to find sentences that play this two-step role so efficiently. This may be because we are dealing with geometrical idealizations. The explanation of the epistemic power of diagrams may thus rest on the human mind's specific ability to interact with (simple) geometrical figures.
Fig. 3, however, drives us toward a different explanation. One of its main characteristics is that it suggests that the detailed constitution of the “mushrooms,” that is, the precise way polymer chains are gathered on the surface, does not matter. What counts is that they are gathered into clearly separated “mushrooms.” Besides their capacity to express geometrical properties, diagrams thus have the power to suggest indeterminacy, contrary to a widely shared view about pictures, which holds that pictures are always more determinate than sentences. These remarks suggest in turn that the epistemic power of diagrams, as opposed to sentences, will probably be revealed when the semantic and pragmatic properties of pictures in general are disclosed, e.g. in the ongoing work of Lopes Reference Lopes1996; Hopkins Reference Hopkins1998; Kulvicki Reference Kulvick2006; and Willats Reference Willats1997 and Reference Willats, Hecht, Schwartz and Atherton2003, etc.
4.2. Various uses of diagrams: teaching vs. research
Analyzing diagrams as props that help physicists imagine the fictional situations represented by models allows for an easy understanding of their pedagogical role. In this respect, the following two questions are to receive different answers:
(1) How do diagrams express theoretical content?
(2) How do diagrams express new theoretical content?
Let us look at an example of a pedagogical diagram: Figs. 4a and 4b show a common, pedagogical representation of what Nils Bohr called the “atom-model” in his early contributions to this topic. In the papers of 1913 and 1914 (Bohr Reference Bohr1913 and Reference Bohr1914), the Danish physicist resorted to scholarly prose and equations only. But the atomic model is usually iconically represented or depicted by some diagrams in introductory lessons on quantum mechanics. In such diagrams, physics students would immediately associate the circles that represent the supposed trajectories of the electrons around the nucleus with the regular trajectories of planets around the Sun. This association of the circles with the graphical representation of planetary motion emphasizes the fictional character of the situation embodied by the model, since according to the best electromagnetic theories available at Bohr's time, the electrons must collapse on to the nucleus instead of describing circular or elliptical orbits. Thus, the background knowledge of electrons having a negative electric charge and of protons having a positive one conflicts with the perception of the circles and ellipses, respectively. This is what makes the situation represented by Bohr's model fictional: it is not compatible with the accepted picture of the microscopic world at the time. The reason why Bohr postulated in his model that electrons did not collapse, in contradiction with the accepted electromagnetic theories, is that this allowed him to explain recently discovered empirical phenomena concerning the inner structure of atoms.
The iconic representation of an unnamed atom possessing three electrons provided by Arnold Sommerfeld according to Bohr's theoretical model (Sommerfeld Reference Sommerfeld1921, 67).

A much later depiction of Bohr's atomic model.Footnote 4

In this example, we can understand how diagrams are used within pedagogical contexts, that is, how to answer question (1) as opposed to question (2). In a classroom or in a textbook, the meaning of every line in the diagram has a clear explicit and implicit meaning for both the teacher and the students who understand what the lesson is about. This is the reason why the diagram helps students figure out the content of the model by relying of their previous experiences of looking at other diagrams in the physics class.
Diagrams of new theoretical models, on the other hand, such as the ones presented in section 2, are used for prospective, not only pedagogical, purpose. They represent theoretical content that is not completely understood yet, that is, the meaning of the new concepts building up the model is open. The interpretation of these diagrams surely relies on previously experienced images in the same domain, but in a way that leaves their meaning partially open.
5. Conclusion
Diagrams representing theoretical models are pervasive in all branches of theoretical physics. Contrary to what could be inferred from the usual reconstructions of philosophers of science, equations do not reign supreme over papers presenting theoretical models. Diagrams sometimes convey an important part of the theoretical content expressed in these papers. When models are interpreted as fictions, diagrams can be conceived as “props” generating theoretical content in their interpreters’ minds. This conception helps to understand the differential roles diagrams play in pedagogical contexts and in the presentation of new theoretical content.
Acknowledgments
Many people helped me refine my ideas in previous versions of this paper: Dominic Lopes, Alfred Nordmann, Laura Perini, and Catherine Allamel-Raffin. Marion Vorms, Alexandre Guay, Cyrille Imbert, Vincent Israel-Jost, and Christoph Hoffmann provided me with helpful comments on the penultimate version. I wish to warmly thank all of them, as well as two anonymous referees who forced me to clarify many aspects.