Introduction
The accelerating rate of land-use change in tropical regions – hosting more than 50% of the terrestrial species – makes it imperative to evaluate the effect of anthropogenic disturbance on populations and communities, as well as on the key interactions among species (McCauley et al., Reference McCauley2015; Young et al., Reference Young2015). Specifically, the anthropogenic modifications of natural landscapes at multiple spatial scales, and the consequent changes in the environmental conditions and resources availability, can significantly affect complex species interactions such as the host–parasite interaction (Suzán et al., Reference Suzán, Aguirre, Ostfeld and Daszak2012). To this respect, the species playing critical roles in ecosystems, such as bats and their corresponding parasites (i.e. bat flies), deserve special attention.
On one hand, bats play important roles in ecosystems, providing important ecological services such as pollination (more than 573 plant species), seed dispersal (more than 549 plant species), control of invertebrate and vertebrate populations, recycling and translocation of nutrients and energy, and the promotion of forest regeneration (Muscarella and Fleming, Reference Muscarella and Fleming2007; Lobova et al., Reference Lobova, Geiselman and Mori2009; Kunz et al., Reference Kunz2011). On the other hand, bat flies can exert significant selective pressures on their hosts, affecting their fitness and their population dynamics (Pilosof et al., Reference Pilosof2012). Bat flies could be vectors of bat-borne infectious diseases, carrying and transmitting pathogens (i.e. Bartonella) and therefore shaping bat populations and risks to humans (Bai et al., Reference Bai2012; Judson et al., Reference Judson, Frank and Hadly2015; Leulmi et al., Reference Leulmi2016; Abundes-Gallegos et al., Reference Abundes-Gallegos2018). Therefore, a significant change on bat diversity and population dynamics due to induced changes by parasites and pathogens can have a cascading effect on biological communities, ecosystem processes and landscape structure and function (Ostfeld et al., Reference Ostfeld, Keesing and Eviner2008).
The host–bat fly interactions can be potentially affected by several factors operating at the level of the host, the parasite and the environment, determining the presence and prevalence of the parasites among host individuals, the intensity of parasitic infection and the topology of host–parasite interaction networks (Fonseca et al., Reference Fonseca2016; Zarazúa et al., Reference Zarazúa-Carbajal2016). In this sense, direct and indirect factors can be simultaneously operating and determining the way in which host and parasites interact. On one hand, bat fly populations can be directly affected by changes in microhabitat conditions, affecting their development and reproduction rate (i.e. changes on reproductive rate due to changes on temperature) (Pilosof et al., Reference Pilosof2012). On the other hand, host attributes (i.e. health, body size, sex, population size, social/mating system, nesting/roosting system, dispersal capacity) and behaviour, which can be modulated by environmental changes at larger spatial scales (i.e. vegetation and landscape attributes), can indirectly affect bat fly populations and the way in which they interact with potential host species (i.e. changes on the likelihood of host–ectoparasites encounters) (Presley, Reference Presley2011; Avila-Cabadilla et al., Reference Avila-Cabadilla2012, Reference Avila-Cabadilla2014; Pilosof et al., Reference Pilosof2012).
Host–bat fly interactions constitute an adequate biological model for addressing the effect of anthropogenic disturbance on host–parasite interactions. Bats occur in both undisturbed and human-disturbed areas (Avila-Cabadilla et al., Reference Avila-Cabadilla2009), and show a high functional diversity that allows them to occupy virtually every trophic level, to interact with a large spectrum of organisms and to regulate complex ecological processes. This makes them sensible and good indicators of habitat disturbance (Jones et al., Reference Jones2009). Bat flies (i.e. Streblidae, a family of bat flies found in the Neotropics), on the other side, are obligated blood-sucking ectoparasites of bats, with a holometabolous life cycle, but with an indirect transmission cycle (pupation takes place in the bats’ roost), making them sensible to both the response of their host to habitat modification and changes in microenvironmental conditions (Pilosof et al., Reference Pilosof2012). Additionally, the interaction between bat and flies can be characterized by using well-defined sampling units (each bat host is a sample of the parasite community) (Presley, Reference Presley2011). Finally, as both taxa are species-rich and abundant in tropical forests (where most of the human emerging diseases arise), this model system will allow us to determine if the response of host–parasite interactions to anthropogenic disturbance is idiosyncratic or shows a general pattern.
One of the most endangered systems within the tropical region is the tropical dry forest (TDF), which has been highly modified due to human activities such as agriculture, cattle ranching and urban growth (Dirzo et al., Reference Dirzo2011). This forest, which is one of the most diverse in term of species richness and presents a high number of endemic species, has suffered a significant reduction in its original area (66% of reduction) in the Neotropics (Portillo-Quintero and Sánchez-Azofeifa, Reference Portillo-Quintero and Sánchez-Azofeifa2010). Nevertheless, the TDF is still one of the least protected ecosystems and has received relatively little attention from the scientific community in relation to other systems (Sanchez-Azofeifa et al., Reference Sanchez-Azofeifa2005; Sánchez-Azofeifa et al., Reference Sánchez-Azofeifa2013).
Our main goal in this study is to identify potential drivers influencing host–bat fly interactions at different spatial scales (at the host, vegetation stand and landscape level), in TDF anthropogenic landscapes (proximate mechanisms shaping host–bat fly interactions). We specifically evaluated the changes in the composition and diversity of bats and streblids communities, as well as the changes on the way in which both taxa interact (i.e. degree of specialization of host–bat fly interaction, parasite prevalence and intensity of infestation), along gradients of vegetation structural complexity and landscape coverage and fragmentation.
While most of the previous studies on bat–streblid interaction have focused on ectoparasite communities inhabiting a single host species, in this study we analyse such interactions at two levels: (1) considering the overall parasite community associated with phyllostomid and mormoopid bats, specifically evaluating change to the topology of host–bat fly interaction networks, and (2) considering the parasite community specifically associated with Artibeus jamaicensis (one of the most abundant bat species in the study region), specifically evaluating the effect of host body condition and population abundance. We hypothesize the following relationships: (1) a reduction in the body condition scores of bats as a consequence of changes on resources availability and habitat conditions (resources would be affected by habitat loss and fragmentation), would favour an increase in the prevalence and intensity of parasite host infestation; (2) a reduction on the availability of refuges (i.e. roosts and temporary perchs), could favour host crowding and consequently an increase in the prevalence and intensity of parasite infestation as well as a reduction on the specialization degree of interaction networks, due to an increase in the likelihood of host–parasite encounters; (3) due to the high degree of mobility of bats and their sensibility to changes in habitat attributes at larger spatial scales, the host–bat fly interaction could be more affected by changes in landscape attributes than by changes in vegetation structural complexity.
Despite the multiscale nature of the factors shaping host–bat fly interactions, none of the studies performed to date have simultaneously looked to identify, across different spatial scales, the drivers affecting host and parasite populations as well as the way in which both groups of species interact. To our knowledge, this is the first study evaluating the potential effect of the variation in landscape, vegetation and host attributes, over the bat fly communities, and specifically, considering how the variation in landscape attributes (composition and configuration) could modulate the way in which bat parasites interact with their host.
Materials and methods
Study region, sampling sites and vegetation characterization
The study was conducted along the Pacific coast of Mexico, where the predominant vegetation type is the TDF (Lott, Reference Lott, Noguera, Vega, García and Quesada2002). This region is characterized by a markedly seasonal precipitation regime, with a dry season lasting approximately 7 months (from November to May). In the past two decades (from 1997 to 2017) the average annual precipitation was 915 ± 311 (s.d.) mm (range: 373–1394) and the average maximum and minimum temperature were 32 ± 1 (s.d.) °C and 20 ± 0 (s.d.), respectively (Chamela Biological Station 2016). Because of the massive use of the forest, the natural vegetation has been replaced by a complex mosaic of patches representing cattle ranching, agricultural fields, secondary forests, and remnants of old growth forests (Sanchez-Azofeifa et al., Reference Sanchez-Azofeifa2005).
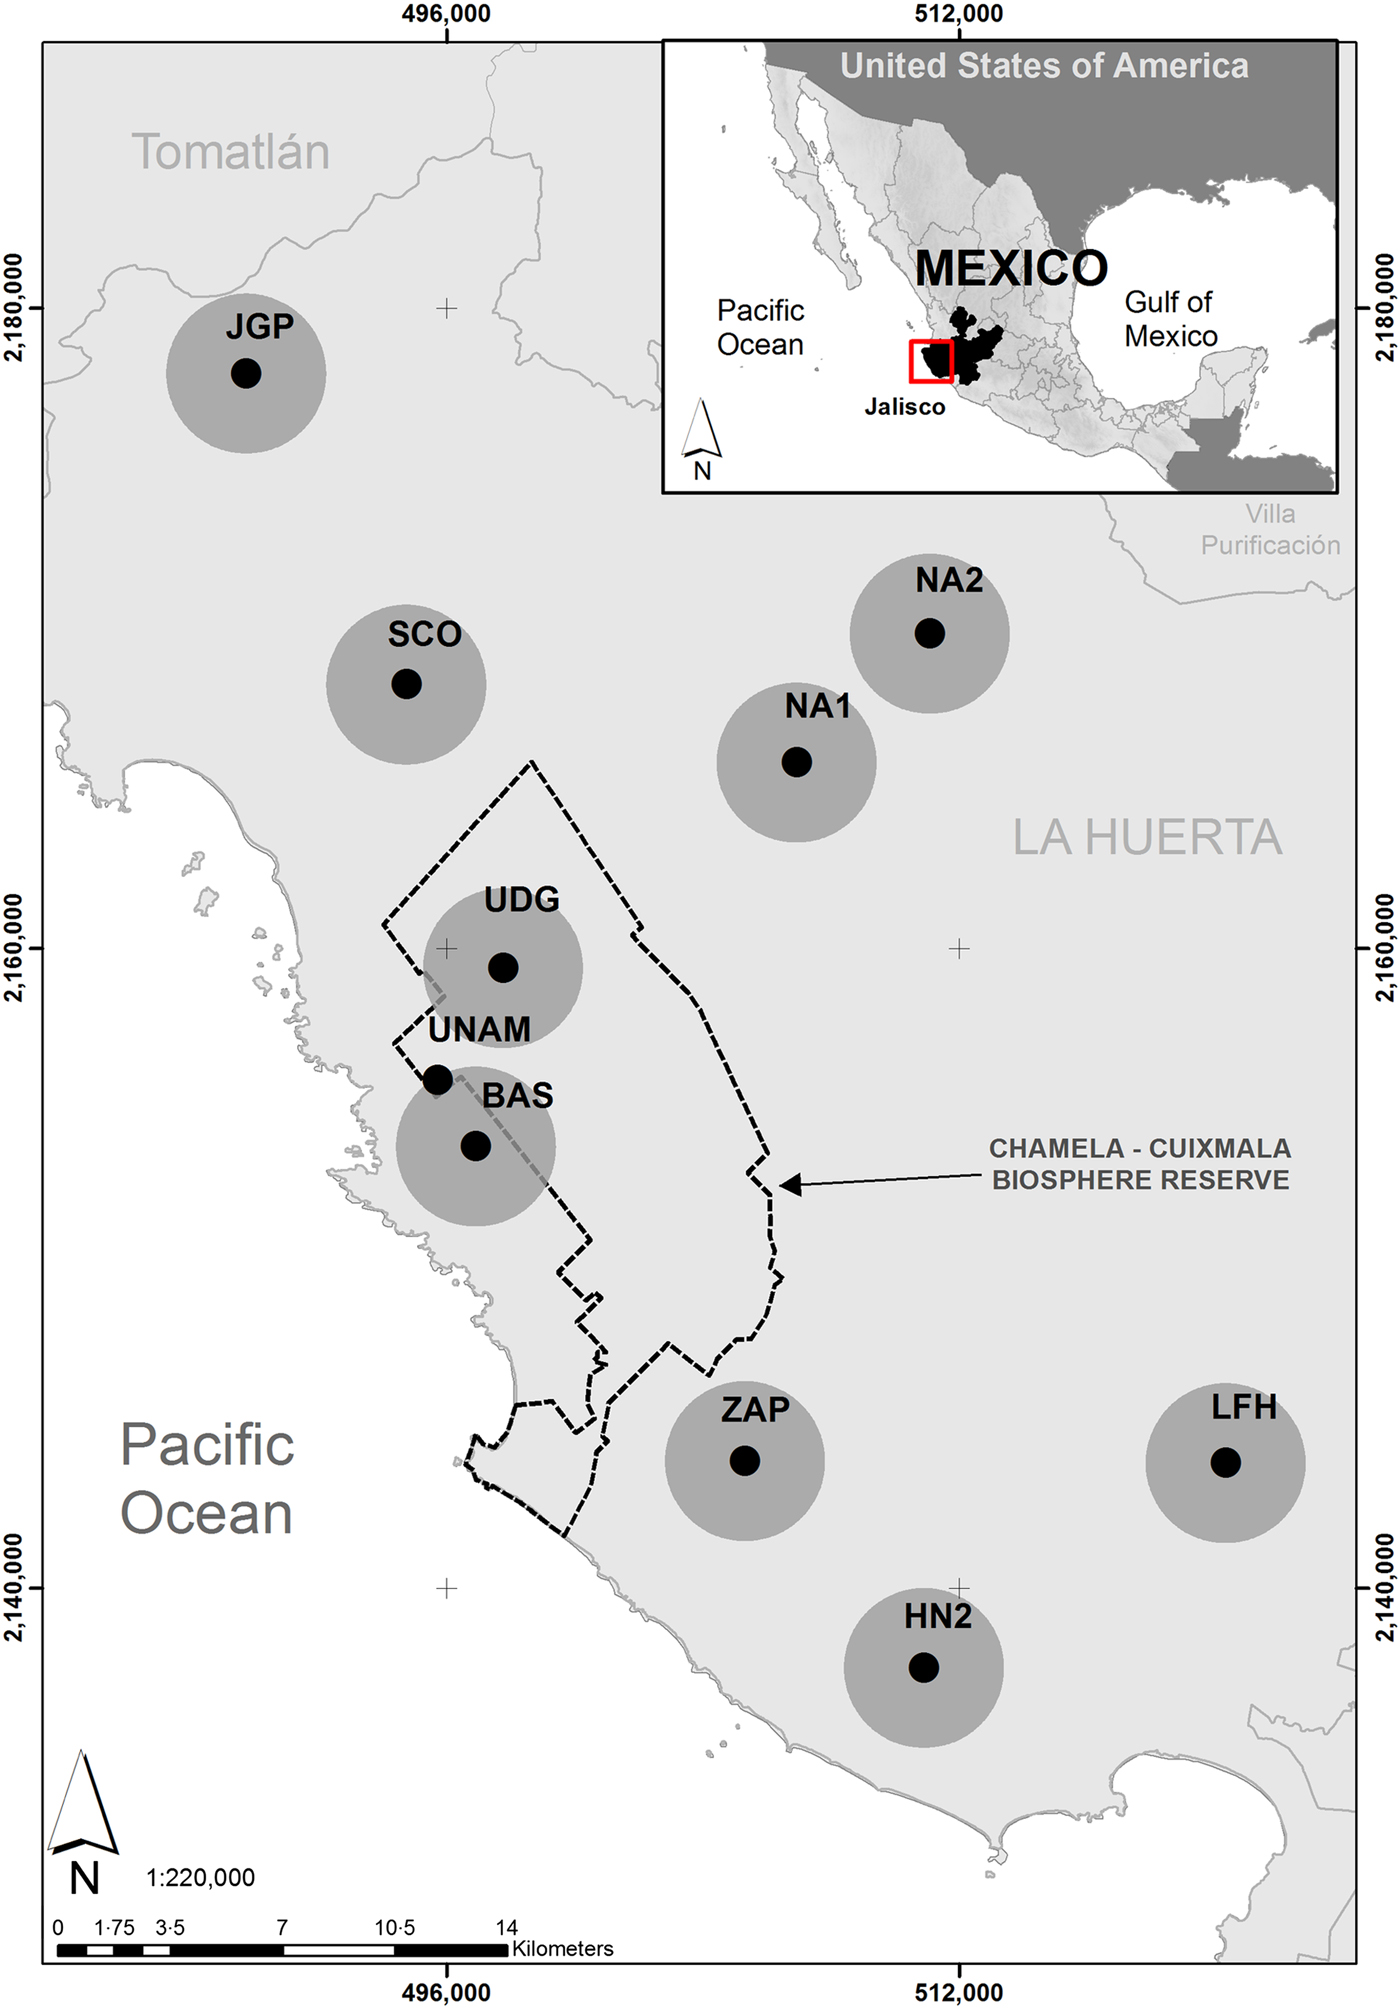
For this study, we selected 10 sampling plots (8 secondary forest and 2 old growth forest) in and around the Chamela-Cuixmala Biosphere Reserve (CCBR), representing a gradient of vegetation structural complexity and of the degree of preservation of the original vegetation coverage (a forest cover and fragmentation gradient), which is representative of the land cover composition and configuration in the study region (Eigenbrod et al., Reference Eigenbrod, Hecnar and Fahrig2011) (Fig. 1). Most sites were separated by a Euclidean distance of at least 3000 m, in concordance with the sampling design used in previous studies, including some carried out in the study region (Gorresen and Willig, Reference Gorresen and Willig2004; Klingbeil and Willig, Reference Klingbeil and Willig2009; Bobrowiec and Gribel, Reference Bobrowiec and Gribel2010; Avila-Cabadilla et al., Reference Avila-Cabadilla2012; De la Peña-Cuellar et al., Reference De la Peña-Cuellar2015; Cisneros et al., Reference Cisneros, Fagan and Willig2016), and considering the expected home range of small and medium size bats inhabiting the forest (i.e. 500 m radius for Glossophaga soricina and 636 m radius for Sturnira lilium) (Lemke, Reference Lemke1984; Fenton et al., Reference Fenton2000). This spacing among sites allowed us to estimate parameters from the bat and fly communities from statistically independent sampling units, to avoid violation of the basic assumptions of several statistical analyses while preventing the effect of biogeographic factors.
Distribution of sampling sites along the Jalisco coast, Mexico, and their corresponding buffers (circle) representing the maximum focal scale (2500 m) considered for landscape characterization. UNAM and UDG sites correspond to old growth forest and the rest of the sites (JGP, SCO, NA1, NA2, BAS, ZAP, LFH and HN2) correspond to secondary forest. The polygon represents the limits of the Chamela–Cuixmala Biosphere Reserve.

In each site, we established a set of five transects of 2 × 100 m, located at 25 m from each other, for vegetation characterization. Along each transect, we identified all woody plant individuals with a diameter at breast height (DBH) of at least 2.5 cm. For these individuals, we registered the species, DBH and number of branches at the breast height. The height of the 10 tallest trees was also measured for each transect. In addition, we estimated the leaf area index in 28 reading points with the LAI-2000 Plant Canopy Analyzer (LI-COR, EE.UU), and the understory density by measuring, in 16 vertical quadrants of 3 × 3 m2, the percentage of space filled by vegetation (more details on these measurements can be found on Fraga et al., Reference Fraga-Ramírez2017). At the end, for each sampling site, we obtained the following parameters: (1) plant species richness, (2) number of woody individuals, (3) total number of branches, (4) vegetation stand basal area, (5) vegetation height, (6) mean leaf area index and (7) mean understory density.
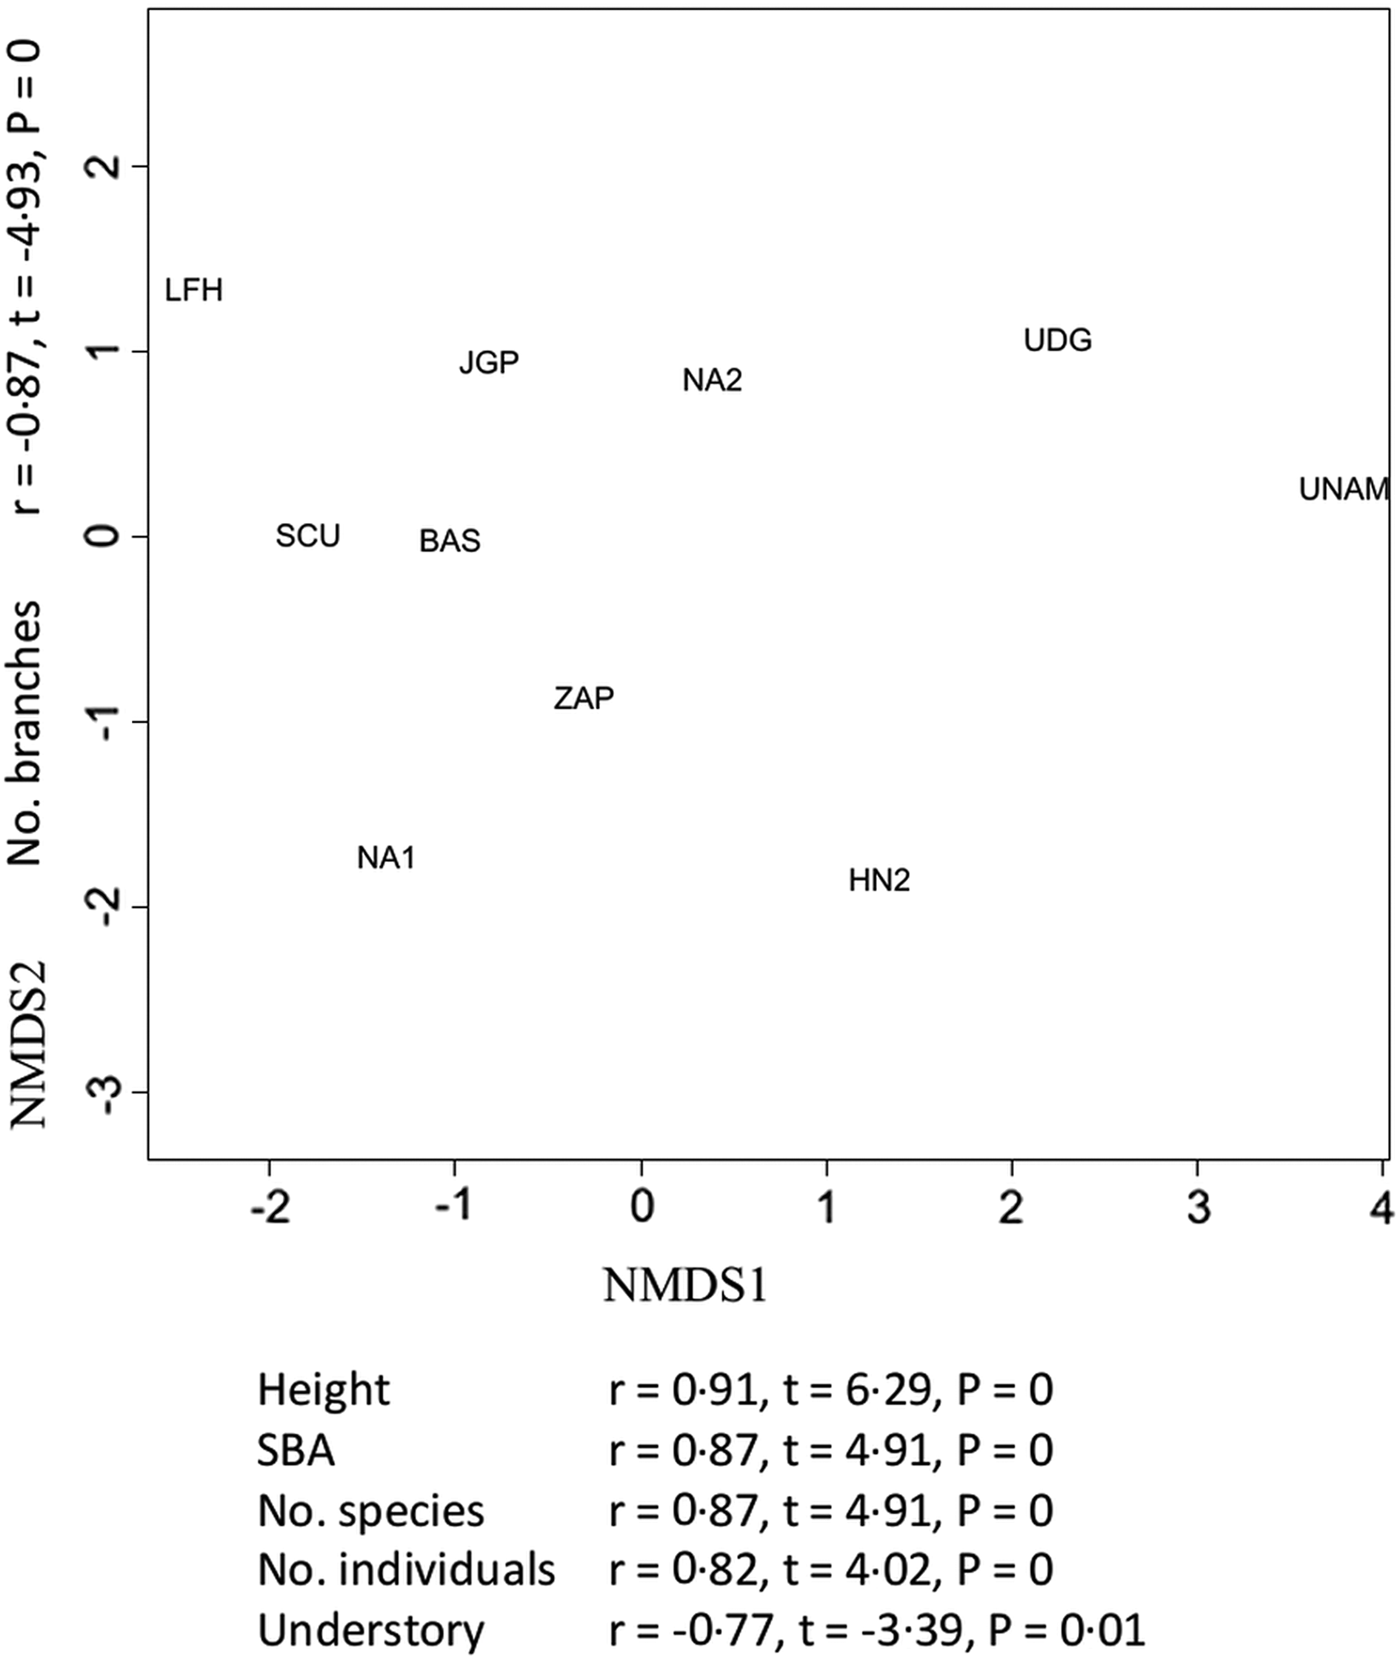
To graph site variations regarding the attributes of the vegetation stand, we carried out a non-Metric Multidimensional Scaling ordination (NMDS), based on a dissimilarity matrix created with the Euclidian distance metric (McCune and Grace, Reference McCune and Grace2002). Then, the scores of the sampling sites in the resulting NMDS axes (Fig. 2) were used as continuous synthetic variables summarizing site variation regarding vegetation structural complexity.
Ordination of plant communities according to their structural attributes. The structural attributes significantly correlated with the axis 1 were: average height of the tallest tree (height), vegetation stand basal area (SBA), number of woody species (No. species), total number of individuals (No. individuals) and percentage of vegetation coverage at the understory level (understory). The total number of branches (No. branches) was the only attribute significantly correlated to the axis 2 (NMDS2). The results of the Pearson correlation test among structural attributes and ordination axes are shown aside each axis. UNAM and UDG sites correspond to old growth forest and the rest of the sites (JGP, SCO, NA1, NA2, BAS, ZAP, LFH and HN2) correspond to secondary forest.

Landscape characterization
For the characterization of the landscape surrounding each study site, we first classified SPOT-5 images with the following attributes: (1) 10 m of spatial resolution, (2) confirmed by the first four band of the SPOT-5 sensor, plus two bands corresponding to the spectral vegetation indexes ‘Normalized Differences Vegetation Index’ (NDVI) and ‘Single Ratio’ (SR), (3) atmospherically corrected and (4) projected onto the coordinate system WGS84/UTM. This classification allowed us to identify the areas corresponding to the main vegetation types on the region: dry forest (DF) and riparian forest (RF) (see Fraga et al., Reference Fraga-Ramírez2017 for more details about the classification process). Second, we calculated two independent landscape metrics at three different focal scales, defining concentric circles (buffers) of 500, 1500 and 2500 m radius, which were centered on each site (Fig. 1). With these focal scales, we encompassed the expected home range of small and medium-size bats inhabiting the region (mentioned above). We specifically estimated the percentage of landscape (PLAND), and the effective mesh size (meff) regarding the TDF and the RF (Jaeger, Reference Jaeger2000; McGarigal, Reference McGarigal, El-Shaa-rawi and Piegorsch2002). We used the PLAND as a measure of the amount of habitat available, and the meff as a measure of the degree of habitat fragmentation. The UNAM site (Fig. 1) was excluded from the analysis regarding the landscape effect to avoid spatial overlap among neighboring buffers. This minimizes the likelihood of making a Type I error (reject a true null hypothesis) because of the effect of pseudoreplication, that arise when the values of the predictor variables from nearly the same concentric circles, are considered as multiple and independent observations in the dataset (Eigenbrod et al., Reference Eigenbrod, Hecnar and Fahrig2011). The image classification and the estimation of landscape metrics were carried out with the help of the QGIS software (v.2.6) and its complement LecoS (QGIS Development Team, 2015; Jung, Reference Jung2016).
Bat and ectoparasite community characterization
We sampled each site every 96 ± 4 (s.d.) nights, totaling 8 sampling sessions per site (four sessions during the dry season and four sessions during the rainy season) (10 sites × 8 sampling sessions = 80 sampling nights [480 hours]). Bats were sampled using a standardized sampling unit composed by a set of six mist nets (12 m long × 2.6 m height and 30 mm mesh), covering an area of 187 m2. On each sampling site, mist nets were located crossing natural corridors, which represent potential flyways for bats. We always opened mist nets 1 hour before sunset; nets remained opened during 6 hours covering the main foraging peak for bats (Fenton and Kunz, Reference Fenton, Kunz, Baker, Jones and Carter1977). We did not sample bats during windy, rainy and full moon nights to avoid capture variation because of these environmental conditions. We also avoided the effect of the trap-shy behaviour of bats by sampling each site for only one night during each session (Marques et al., Reference Marques, Ramos-Pereira, Marques, Santos, Santana, Beja and Palmeirim2013). During sampling nights, mist nets were checked every 30-min, removing and processing in situ all captured bats. For every captured individual we determined the species, weight and the forearm size as a proxy of individual size. With this information, we estimated, for the most abundant bat species (A. jamaicensis), the Scaled Mass Index (SMI) that characterizes the individual body condition. This index is based on the estimation of the slope (b: scaling exponent) of a standardized major axis regression (SMA) relating body mass (as Y) and body size (as X), and reflects the energy capital accumulated in the body through feeding: SMI = M i (L 0/L i)b: where M i and L i are the body mass and the body size of individual i respectively; b is the scaling exponent; and L 0 is the arithmetic mean value for the study population (Green, Reference Green2001; Peig and Green, Reference Peig and Green2009).
Bat flies (streblids) were collected with tweezers from captured bats. Each bat was examined until no more flies were found. Special care was taken when reviewing inside the pelage and on the patagia, which are the flies preferred areas. All collected flies were stored in labelled vials with 70% ethanol and were deposited at the Collection of the National School of Higher Education, UNAM campus Morelia (90%) and at the Morales-Malacara Collection (10%) housed at the Laboratory of Speleobiology and Acarology of the Faculty of Sciences campus Juriquilla, UNAM. We identified bat species with the help of the dichotomous keys of Medellín et al. (Reference Medellín, Arita and Sanchez2007). Bats taxonomic designation follows Reeder and Wilson (Reference Reeder and Wilson2005), Velazco and Patterson (Reference Velazco and Patterson2013), and Ceballos (Reference Ceballos2014). All the processed bats were released at the same place of capture. Bat fly species were identified with several dichotomous keys or taxonomic descriptions (Wenzel et al., Reference Wenzel, Tipton and Kiewlicz1966; Peterson and Hurka, Reference Peterson and Hurka1974; Wenzel, Reference Wenzel1976; Guerrero, Reference Guerrero1995). They were examined using a stereoscopic Zeiss microscope (Göttingen Niedersachen, Germany).
We estimated the following parameters for each community: (1) observed bat richness (S), (2) capture rate (individuals/night) as indicator of the local bat abundance (Ab), (3) exponential of Shannon index (eH′), which is sensible to the variation in the number of common species, and (4) inverse of the Simpson index (1/D), which is sensible to the variation in the number of dominant species. The observed species richness and diversity indexes (eH′ and 1/D) were also used to characterize bat fly communities (Magurran and McGill, Reference Magurran and McGill2011).
In addition, we evaluated the way in which bats and streblids interact, by quantifying for each study site the degree of complementarity specialization of their bipartite interaction networks (interaction networks with two trophic levels). For this purpose, we used the specialization index (H 2′), which integrates the species-level degree of specialization across the entire network (Blüthgen et al., Reference Blüthgen, Menzel and Blüthgen2006). Although the unequal number of observations per species does not affect this index, it can be sensitive to random allocation of species interactions in small networks (Blüthgen and Klein, Reference Blüthgen and Klein2011; Luna et al., Reference Luna2017). To avoid this bias, we did not include small networks in this study – all analysed networks presented a web size equal or higher than 10 species (Table 1). In fact, we did not find a significant correlation between H 2′ and the web size (r Spearman = 0.06, P = 0.87). We also estimated the streblid prevalence (proportion of infested bats) and average infestation intensity (mean number of parasites per infested hosts) on the populations of the most abundant bat, A. jamaicensis.
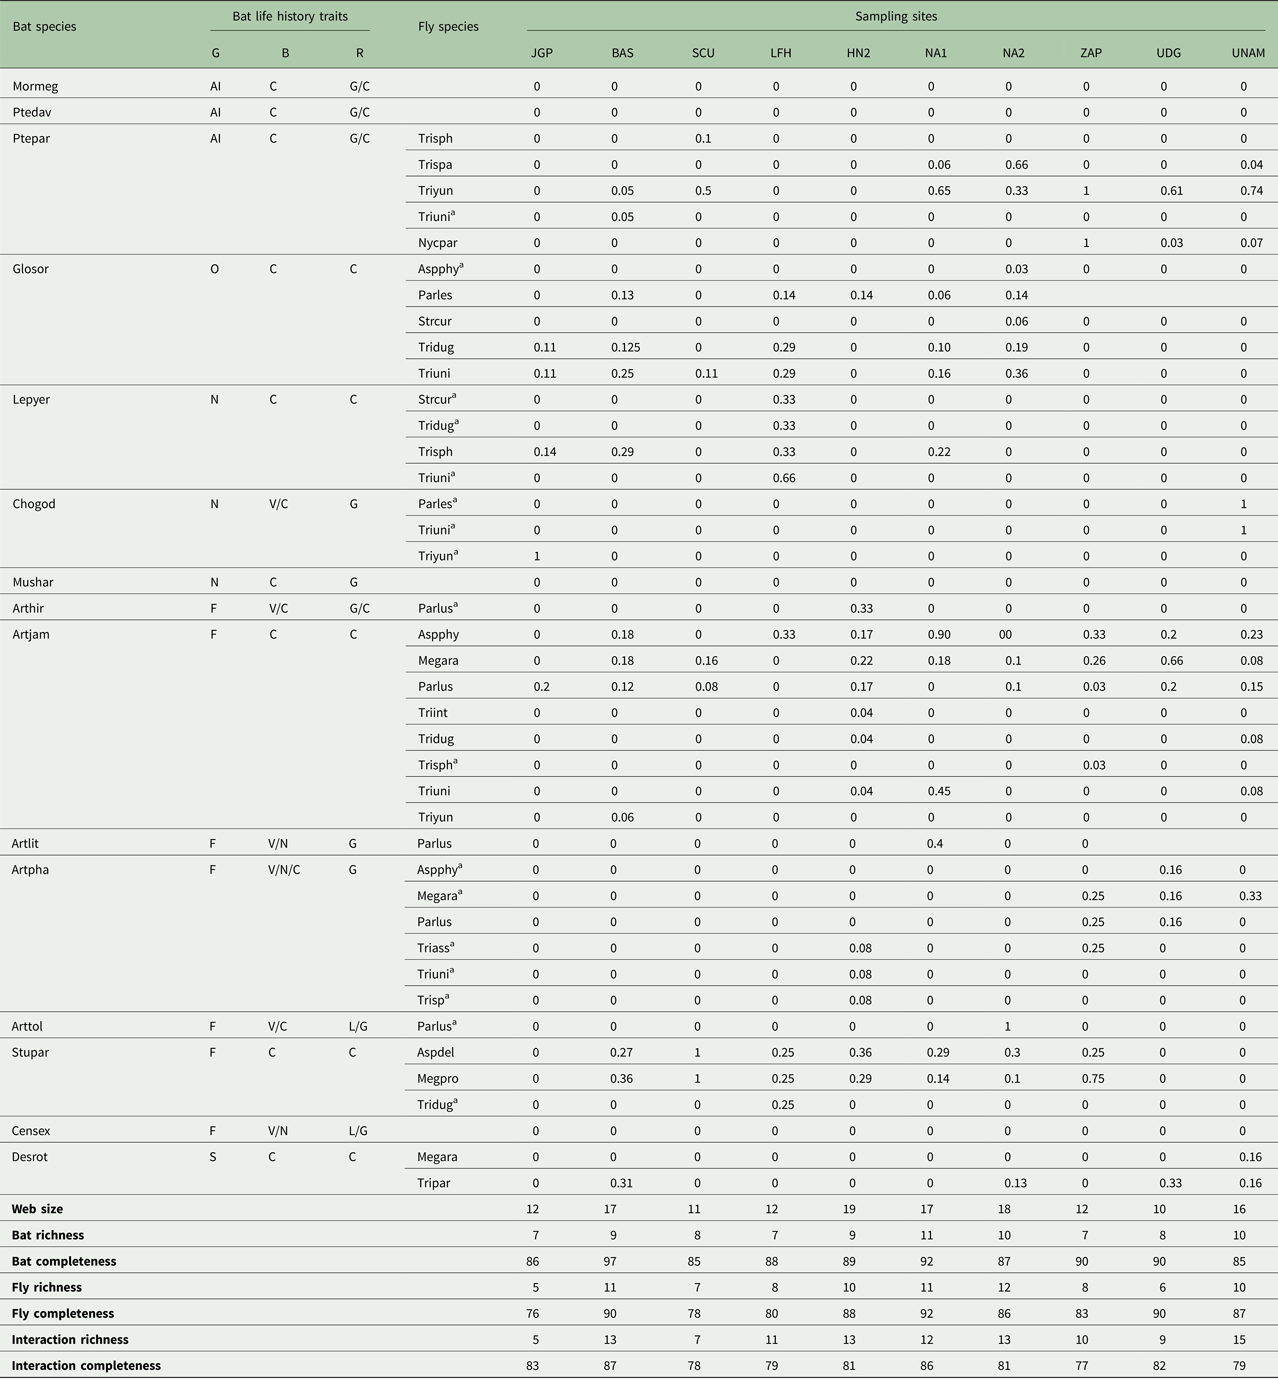
Bat species, bat life history traits, fly species interacting with bats and the proportion of captured bats parasitized by streblids in each sampling site. The species richness and sample completeness of bats and flies per sample site, as well as the information related to the host-bat fly interaction, are also shown

Bats species are: Mormoops megalophylla (Mormeg), Pteronotus davyi (Ptedav), P. parnellii (Ptepar), Glossophaga soricina (Glosor), Leptonycteris yerbabuenae (Lepyer), Choeroniscus godmani (Chogod), Musonycteris harrisoni (Mushar), Artibeus hirsutus (Arthir), A. jamaicensis (Artjam), A. lituratus (Artlit), A. phaeotis (Artpha), A. toltecus (Arttol), Sturnira parvidens (Stupar), Centurio senex (Censex), and Desmodus rotundus (Desrot). Bat flies’ species are: Aspidoptera delatorrei (Aspdel), A. phyllostomatis (Aspphy), Megistopoda proxima (Megpro), M. aranea (Megara), Nycterophilia parnelli (Nycpar), Paratrichobius longicrus (Parlus), Parauctenodes longipes (Parles), Trichobius intermedius (Triint), T. dugesii (Tridug), T. parasiticus (Tripar), T. sparsus (Trispa), T. sphaeronotus (Trisph), T. sp., (Trisp), T. uniformis (Triuni), T. yunkeri (Triyun), Strebla curvata (Strcur). Bat life history traits: guild (G) includes the categories ‘aerial insectivores’ (AI), ‘omnivores’ (O), ‘nectarivores’ (N), ‘frugivores’ (F) and ‘sanguivores’ (S); burrow type (B) includes the categories ‘on vegetation’ (V), ‘on natural cavities’ – tree hollow – (N), and ‘on caves’ (C); roosting system (R), includes the categories ‘lonely’ (L) -bats who are alone or accompanied by another bat-, ‘gregarious’ (G) -group of bats including few individuals of different species-, and ‘colony’ – group of bats of the same species including a large number of individuals –. In bold appear the species richness and sample completeness of bats (Bat richness and Bat completeness), and flies (Fly richness and Fly completeness) per sample site. The total number of bat and fly species interacting (Web size) as well as the number of detected host-bat fly interactions (Interaction richness), and the completeness of the interaction sample (Interaction completeness), in each sampling site, is also presented.
a New host–bat fly interactions.
Finally, we conducted a bibliographic survey for all identified streblid species (Wenzel et al., Reference Wenzel, Tipton and Kiewlicz1966; Peterson and Hurka, Reference Peterson and Hurka1974; Wenzel, Reference Wenzel1976; Guerrero and Morales-Malacara, Reference Guerrero and Morales-Malacara1996; Whitaker and Morales-Malacara, Reference Whitaker, Morales-Malacara, Sánchez-Cordero and Medellín2005; Cuxim-Koyoc et al., Reference Cuxim-Koyoc2015, Reference Cuxim-Koyoc2016; Zarazúa-Carbajal et al., Reference Zarazúa-Carbajal2017; Colín-Martínez et al., Reference Colín-Martínez, Morales-Malacara and García-Estrada2018) gathering information on specificity to validate core species or peripheral species (including cross-host contamination) (see Table 1). Core fly species are the ones with the largest number of interactions with bats in relation to other less connected fly species (peripheral species).
Data analysis
Bat and fly samplings and their interaction networks
We evaluated the completeness of bat and streblid surveys on each sampling site by calculating the percentage of the total estimated species richness that was covered by samples. For this purpose, we used the Bootstrap estimator (incidence-based) of species richness implemented on the EstimateS software (http://viceroy.eeb.uconn.edu/estimates/) (Smith and van Belle, Reference Smith and van Belle1984). We selected this estimator because, regarding our dataset, it showed low sensibility to the variation in sampling effort (Colwell and Coddington, Reference Colwell and Coddington1994). The same procedure was used to evaluate the completeness of the identified interactions among bats and streblids. In addition, we visualized host–bat fly interaction networks by using quantitative bipartite graphs. A dendrogram was used to identify clusters of the bat and fly species defined by their degree of similarity with respect to the species with which they interact. Regarding the fly communities associated with A. jamaicensis, we identified the core and peripheral fly species by estimating their corresponding network core-peripheral index (G c), which is calculated as: G c = (K i − K mean)/SDK × K i; where K i is the number of links (interactions) for the fly species i; K mean is the mean number of links in the network for all fly species; and SDK is the standard deviation of the number of links for the fly species (G c > 1 for core species and G c < 1 for peripheral species) (Dáttilo et al., Reference Dáttilo, Guimaraes and Izzo2013).
Potential drivers influencing bat and fly communities and their interactions
First, we explored the variation in species composition and structure among bat and fly communities by using an unconstrained ordination, the non-Metric Multidimensional Scaling (NMDS) based on Bray–Curtis dissimilarity matrices (McCune and Grace, Reference McCune and Grace2002). Before the analysis, we calculated the square root of the number of individuals per bat species to avoid biases toward species with the largest differences in abundance (Kindt and Coe, Reference Kindt and Coe2005). For the ordination of streblid communities, we used as a measure of abundance the proportion of captured bats with parasites. This analysis was also used to map the variation in fly communities specifically associated with A. jamaicensis. The goodness of fit of the obtained ordinations was assessed by estimating their corresponding stress values, scaled from 0 to 100 (McCune and Grace, Reference McCune and Grace2002), where a lower stress value indicates a more reliable ordination. Finally, we tested the associations between the variation on the bat (independent) and streblid communities (dependent) by comparing their corresponding ordinations through the ‘Procrustes’ and ‘Protest’ functions implemented in the ‘vegan’ R package (Oksanen, Reference Oksanen2015). These functions allowed us to rotate the final configurations of the ordinations until they reach their maximum similarity, as well as to test for correlations between such configurations. The significance (P ⩽ 0.05) of the correlation like statistic used was evaluated through a randomization test (10 000 permutations).
Second, we performed constrained ordinations – distance-based Redundancy Analyses (dbRDA) based on Bray–Curtis dissimilarity matrices – to test for the potential association among bat and fly communities (also considering bat fly communities associated with A. jamaicensis), and the variation on the habitat attributes at different spatial scales. For this purpose, we considered different groups of predictors that were separately analysed: (1) at the landscape level, estimates of PLAND and meff regarding DF and RF at 500, 1500 and 2500 m spatial scales; (2) at the vegetation level, scores of the NMDS corresponding to the vegetation structural complexity; (3) at the community level, estimates of bat species richness, diversity (1/D) and abundance, quantifying bat community structure; and (4) at the population level (only for A. jamaicensis), the abundance and body condition of the host. We avoided tautology by excluding the data regarding A. jamaicensis when evaluating the effect of bat community structure on the composition of fly communities associated with A. jamaicensis.
Third, through Generalized Linear Models (GLMs) we tested the hypothesis that habitat attributes were associated with (a) attributes of bat and fly communities and (b) attributes of the bat–fly interaction network. To test this hypothesis, we considered as explanatory variables the four groups of predictors already introduced: (1) the habitat attributes at landscape level, (2) the habitat attributes at vegetation stand level, (3) the structure of the bat community and (4) the abundance and body condition of the host, plus and additional group of predictors at the community level (group 5): the scores of a NMDS mapping the variation in bat species composition. Group of predictors 1–2 were used to model the variation in bat communities, groups 1–3 to model the variation in overall bat fly communities and in the general bat–fly interaction networks, and 1–5 to model the variation among fly communities associated with A. jamaicensis as well as the variation on the prevalence and intensity of fly infestation on this bat species. We avoided tautology by excluding the data regarding A. jamaicensis when performing the NMDS corresponding to group 5. The response variables were modeled using the following error distributions and link functions: Gamma distribution with ‘reciprocal’ link function for analysing species diversity indexes (eH′ and 1/D) and the specialization index (H 2′); Poisson distribution with ‘log’ link function for analysing species richness and abundance data and the intensity of fly infestation; and Binomial distribution with ‘logit’ link function for analysing the prevalence of fly infestation, this in the form of a two-vector variable indicating the number of successes and failures. We identified the best combination of predictors for each response variable by selecting the most plausible models from several sets of models considering the different predictors combinations. In this sense, we estimated for each model the following parameters: (a) the Akaike's information criterion corrected for small sample size (AICc), and (b) the AIC weights (w i), which represents the weight of evidence that a certain model is the best model given the dataset and the set of candidate models. In the set of most plausible models were included all the models with a AICc lower than the AICc of the null model (without explanatory power), with a delta AICc (the difference between their AICc and the one corresponding to the best model) lower than 2, and with a sequential sum of w i reaching the value of 0.95 (Burnham and Anderson, Reference Burnham and Anderson2002). We also explored if all the explanatory variables included in the set of most plausible models presented a corresponding significant P value (P < 0.05). We avoided the effect of multicollinearity by: (1) evaluating the degree of correlation among predictors (with Pearson and Spearman correlations), (2) estimating the variance inflation factor (VIF) for each predictor (VIF > 4 for possible collinearity and VIF > 10 for severe collinearity) (Neter et al., Reference Neter, Wasserman and Kutner1990), and (3) no including pairs of correlated predictors in the same model, as well as predictors showing a VIF > 4. In order to detect potential spatial structure on the response variables, we calculated its corresponding semi-variogram and plotted it vs distance. We made this by fitting generalized linear mixed models with penalized quasi-likelihood (glmmPQL), using five different correlation structures (corRatio, corSpher, corExp, corGaus, corLin). As any of these variables displayed evidence for a significant spatial structure, we used the GLMs (mentioned above), instead of other models accounting for spatial autocorrelation, for the analysis of our response variables. This analysis was carried out with the help of the nlme R package (Pinheiro et al., Reference Pinheiro2016). All analyses were carried out with R software (R Core Team, 2016).
Results
Bat and fly samplings and their interaction networks
The overall sampling effort (89 760.0 m h−1) resulted in the capture of 836 individuals of phyllostomidae and mormoopidae bats, representing 15 species and 10 genera (Table 1). The bat sampling completeness reached an average value of 89%, ranging from 85 to 97%. We captured the 70% of the phyllostomid species and the 75% of the mormoopid species reported for the study region (Ceballos and Miranda, Reference Ceballos and Miranda2000). The most speciose family was Phyllostomidae (12 species) and the most speciose genus was Artibeus (5 species). Among the captured species, there are 5 trophic guilds, with frugivores being the most represented. In general, the bat species richness presented a low variation among study sites, ranging from 7 to 11 species.
Likewise, the inspection of 821 individuals of bats (98% of captured bats) resulted in the collection of 526 streblid flies, representing 16 species and 7 genera (Table 1). In this case, the sampling completeness was on average 85%, ranging from 76 to 92%. Trichobius was the most speciose genus, being represented by 8 species (50% of collected species). Unlike bats, streblid species richness showed a higher variation among study sites, varying from 5 to 12 species.
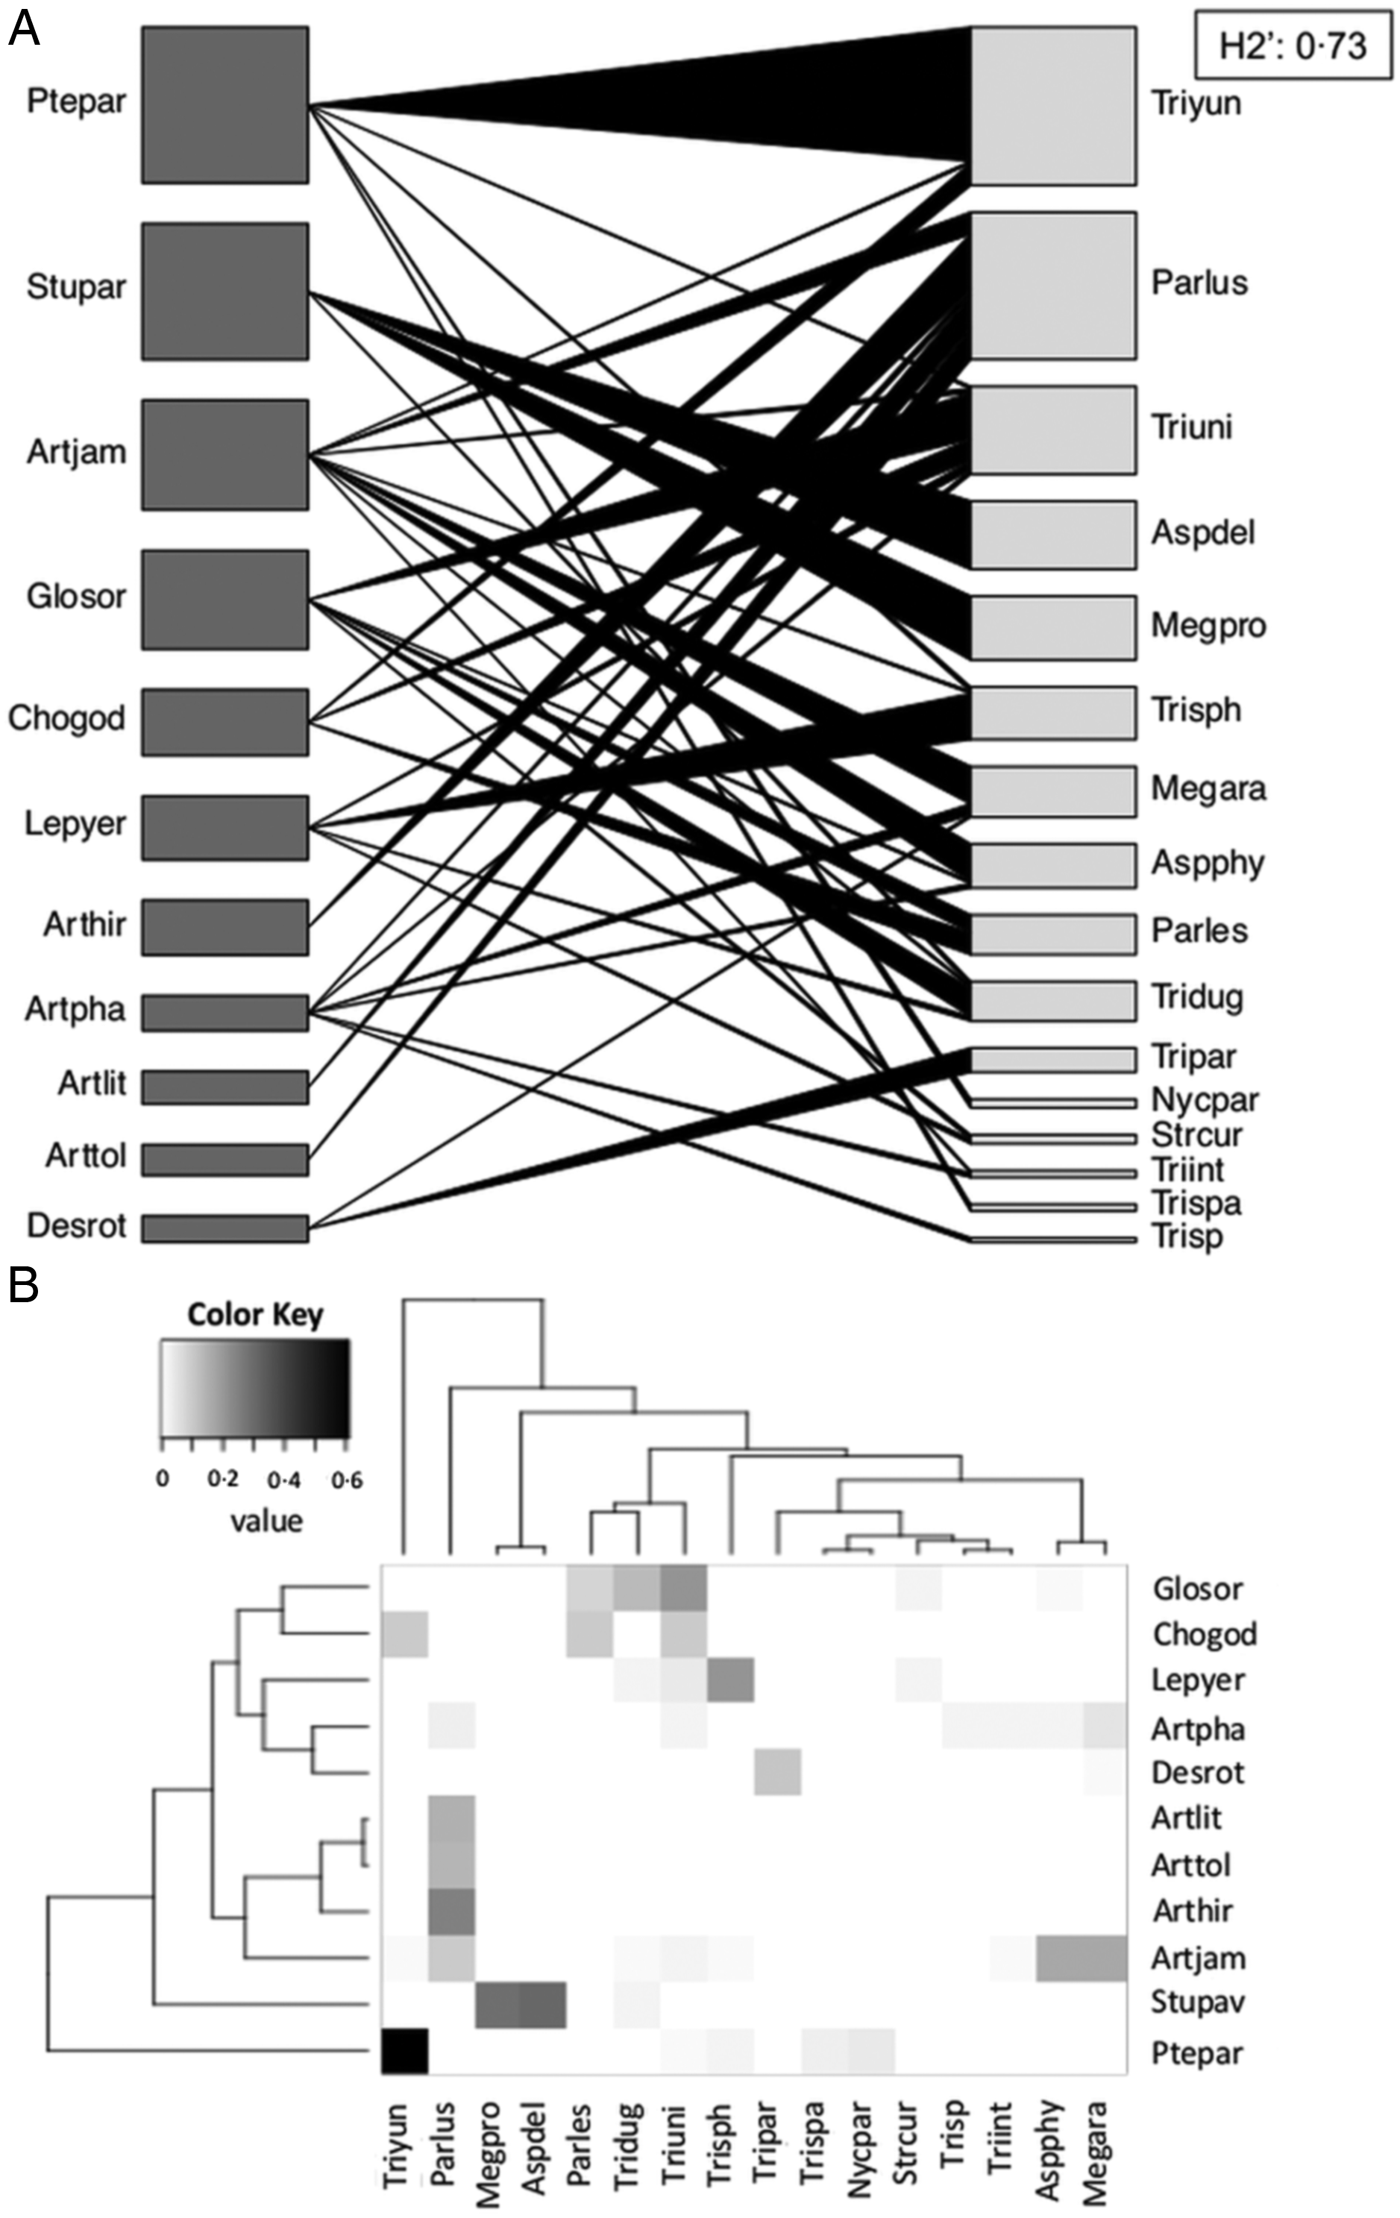
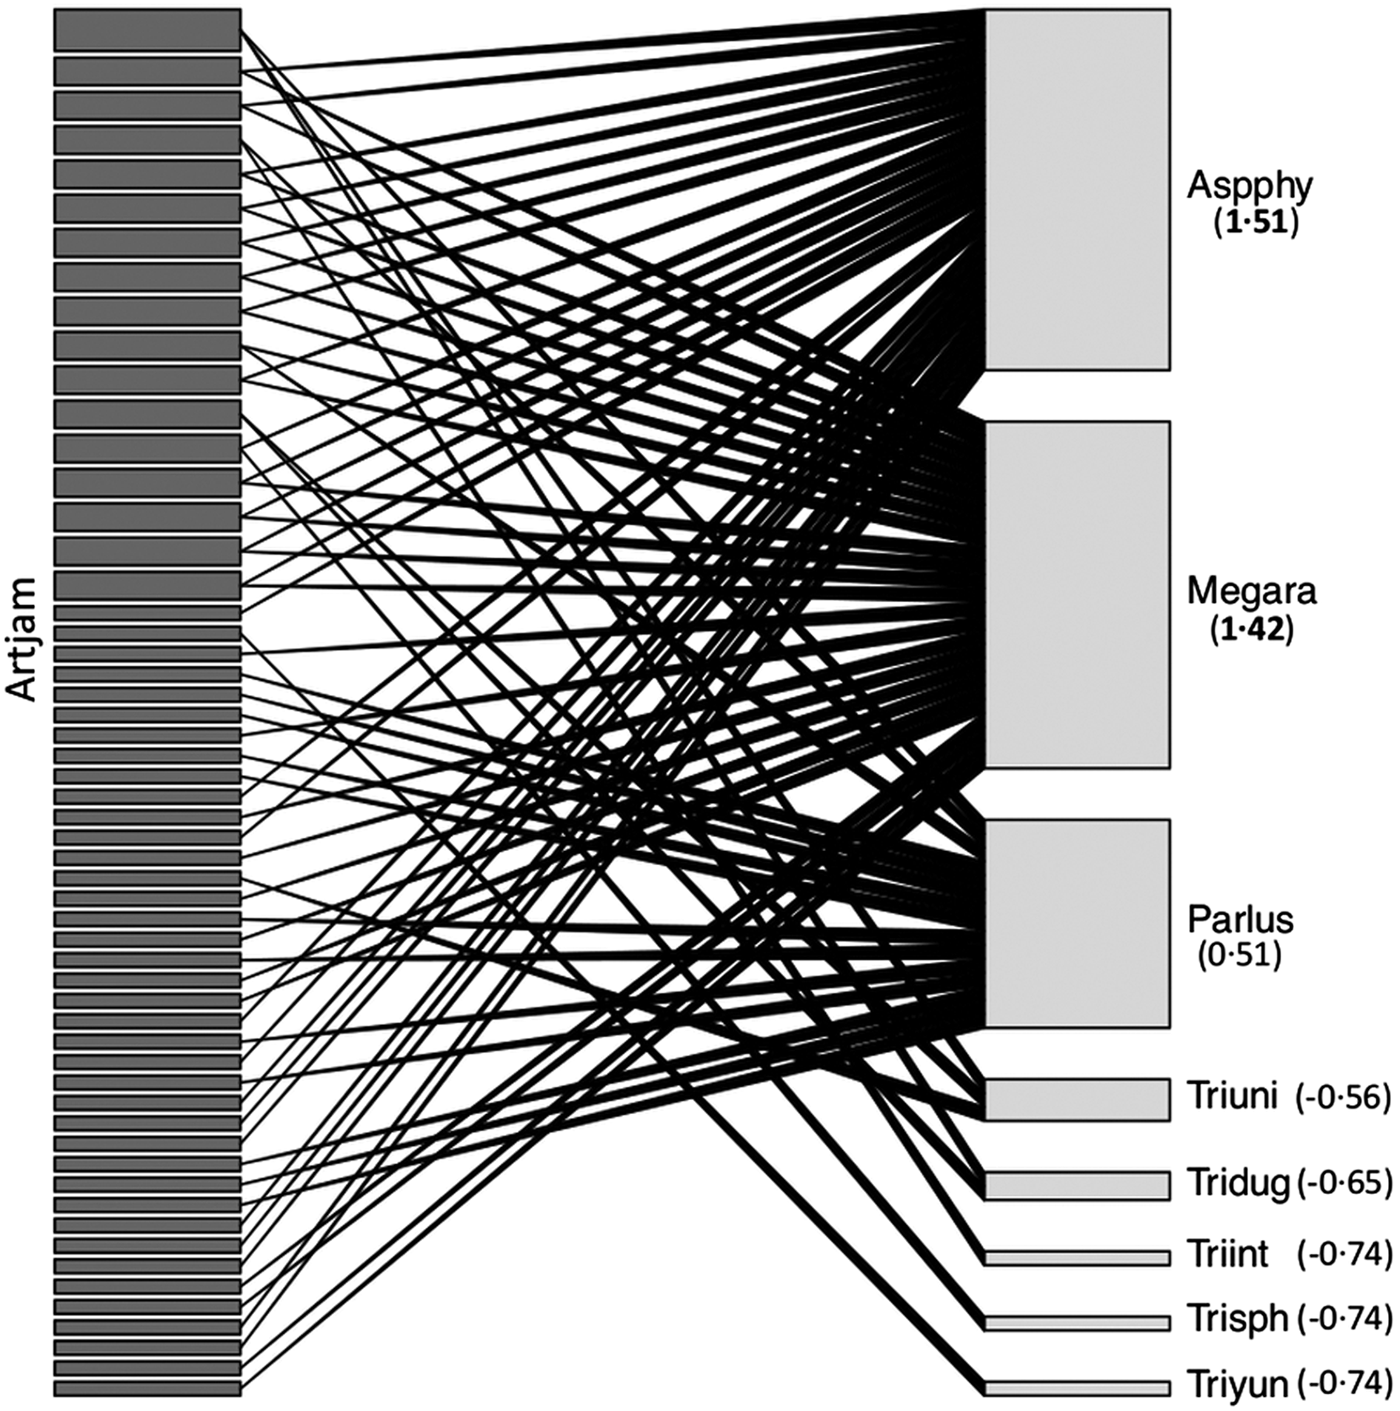
Regarding host–bat fly interactions, we found on average 11 different interactions on sampling sites, ranging from 5 to 15 (Table 1). Sampling completeness reached an average value of 81%, ranging from 77% to 87%. In general, we found a high level of specialization on the host–bat fly interaction network (H 2′: 0.73) (Fig. 3). In addition, among the individuals belonging to A. jamaicensis, we detected 50% of streblid species (8 species) reported among all other bat species (Fig. 4). For A. jamaicensis the core ectoparasite species were Aspidoptera phyllostomatis and Megistopoda aranea, whereas the peripheral species were Paratrichobius longicrus and several species of the genus Trichobius.
Host–bat fly interaction network including the interactions observed in all sampling sites. (A) Quantitative bipartite graph of the host-bat fly species network. The species bar size represents the number of interactions each species has, and the linkage width represents the proportion of individuals involved in such interactions. (B) Dendrogram showing clusters of species defined by their degree of similarity with respect to the species with which they interact. H 2′, the specialization index, characterizing the level of specialization of the network. The bar colour shows the intensity of host–bat fly interactions. Bat species (gray) are: Pteronotus parnellii (Ptepar), Sturnira parvidens (Stupar), Artibeus jamaicensis (Artjam), Glossophaga soricina (Glosor), Choeroniscus godmani (Chogod), Leptonycteris yerbabuenae (Lepyer), A. hirsutus (Arthir), A. phaeotis (Artpha), A. lituratus (Artlit), A. toltecus (Arttol), and Desmodus rotundus (Desrot). Bat flies’ species (wheat color) are: Trichobius yunkeri (Triyun), Paratrichobius longicrus (Parlus), T. uniformis (Triuni), Aspidoptera delatorrei (Aspdel), Megistopoda proxima (Megpro), T. sphaeronotus (Trisph), M. aranea (Megara), A. phyllostomatis (Aspphy), Parauctenodes longipes (Parles), T. dugesii (Tridug), T. parasiticus (Tripar), Nycterophilia parnelli (Nycpar), Strebla curvata (Strcur), T. intermedius (Triint), T. sparsus (Trispa), and T. sp. (Trisp).

Qualitative bipartite graph of the interaction network among individuals of Artibeus jamaicensis and bat fly species. Species bar size represents the number of interactions it has. Between parentheses is shown the values of the Gc index used to define core and peripheral bat fly species. In bold appear the values corresponding to generalist core species (G c > 1). Individuals of A. jamaicensis are presented in gray and the bat fly species are presented in wheat color: Aspidoptera phyllostomatis (Aspphy), Megistopoda aranea (Megara), Paratrichobius longicrus (Parlus), Trichobius uniformis (Triuni), T. dugesii (Tridug), T. intermedius (Triint), T. sphaeronotus (Trisph), and T. yunkeri (Triyun).

Potential drivers influencing bat and fly communities and their interactions
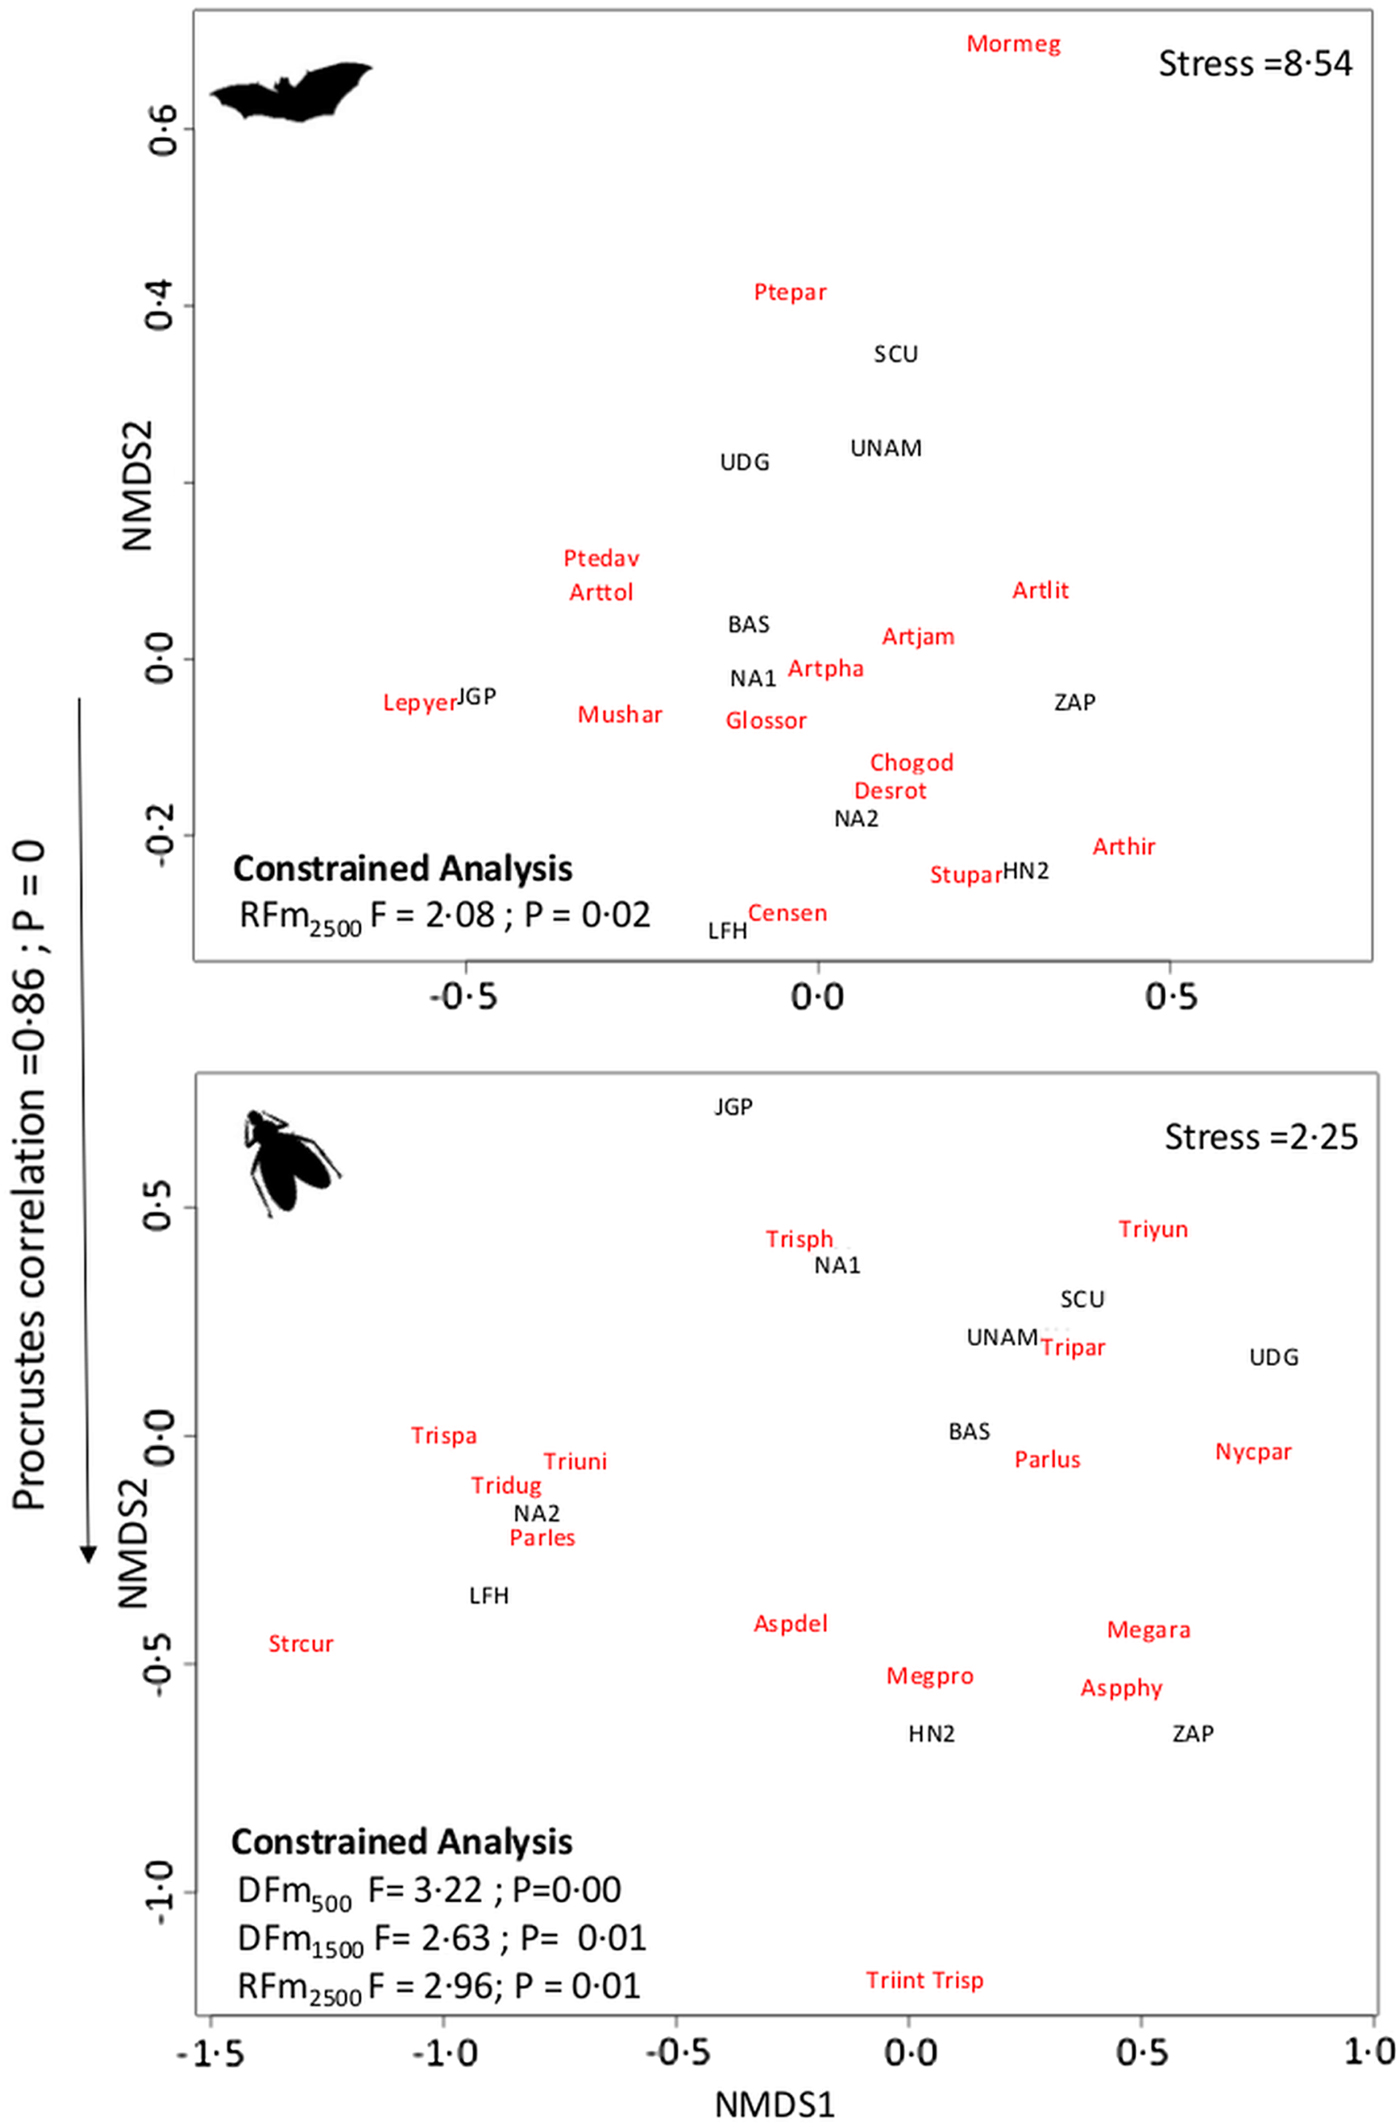
First, we just considered three axes in the NMDS ordinations of bats and streblid communities, because additional dimension (axes) did not substantially diminish the stress values (Fig. 5). The low-stress values of the resulting ordinations (8.54 for bats and 2.25 for streblids) indicate that there is no real risk of drawing false inferences from such ordinations (McCune and Grace, Reference McCune and Grace2002). In general, we observed a higher variation of species composition and structure among fly communities than among bat communities. (Fig. 5). Nevertheless, we also found a significant correspondence among the variation in both communities (Procrustes correlation = 0.86; P < 0.001). In addition, the dbRDA detected that this variation was significantly associated with the variation on habitat attributes at the landscape level, specifically to the variation in the degree of fragmentation of riparian (for both bats and streblids) and DF (only for streblids). The dbRDA also showed that the landscape attributes significantly associated with the variation in bat species composition were detected at large spatial scales (2500 m), whereas those associated with the variation in streblid species composition were detected at different spatial scales, from low (500 m) to large scales (2500 m) (Fig. 5). Finally, the variation on species composition of the streblids communities associated with A. jamaicensis was not significantly associated with the variation in the analysed groups of predictors.
non-Metric Mutidimensional Scaling Ordinations (NMDS) mapping the species composition dissimilarities among bat (upper chart) and bat fly (low chart) communities. The stress value (scaled from 0 to 100) is used to measure the ordination goodness of fit. The relationship between each species (in red) and sampling sites were mapped after computing the species weighted average scores. The most relevant predictors of species composition variation, identified throughout a Constrained Analysis of Principal Coordinates, are also listed on each chart, with their corresponding F and P values. The Procrustes test shows the correlation among the variation in species composition of host and bat fly communities. The graphs show the axes capturing the higher degree of variation among communities (axes 1 and 2 from three axes). UNAM and UDG sites correspond to old growth forest and the rest of the sites (JGP, SCO, NA1, NA2, BAS, ZAP, LFH and HN2) correspond to secondary forest. Bats species are: Mormoops megalophylla (Mormeg), Pteronotus davyi (Ptedav), P. parnellii (Ptepar), Glossophaga soricina (Glosor), Leptonycteris yerbabuenae (Lepyer), Choeroniscus godmani (Chogod), Musonycteris harrisoni (Mushar), Artibeus hirsutus (Arthir), A. jamaicensis (Artjam), A. lituratus (Artlit), A. phaeotis (Artpha), A. toltecus (Arttol), Sturnira parvidens (Stupar), Centurio senex (Censex), and Desmodus rotundus (Desrot). Bat flies’ species are: Aspidoptera delatorrei (Aspdel), A. phyllostomatis (Aspphy), Megistopoda proxima (Megpro), M. aranea (Megara), Nycterophilia parnelli (Nycpar), Paratrichobius longicrus (Parlus), Parauctenodes longipes (Parles), Trichobius intermedius (Triint), T. dugesii (Tridug), T. parasiticus (Tripar), T. sparsus (Trispa), T. sphaeronotus (Trisph), T. sp., (Trisp), T. uniformis (Triuni), T. yunkeri (Triyun), Strebla curvata (Strcur).

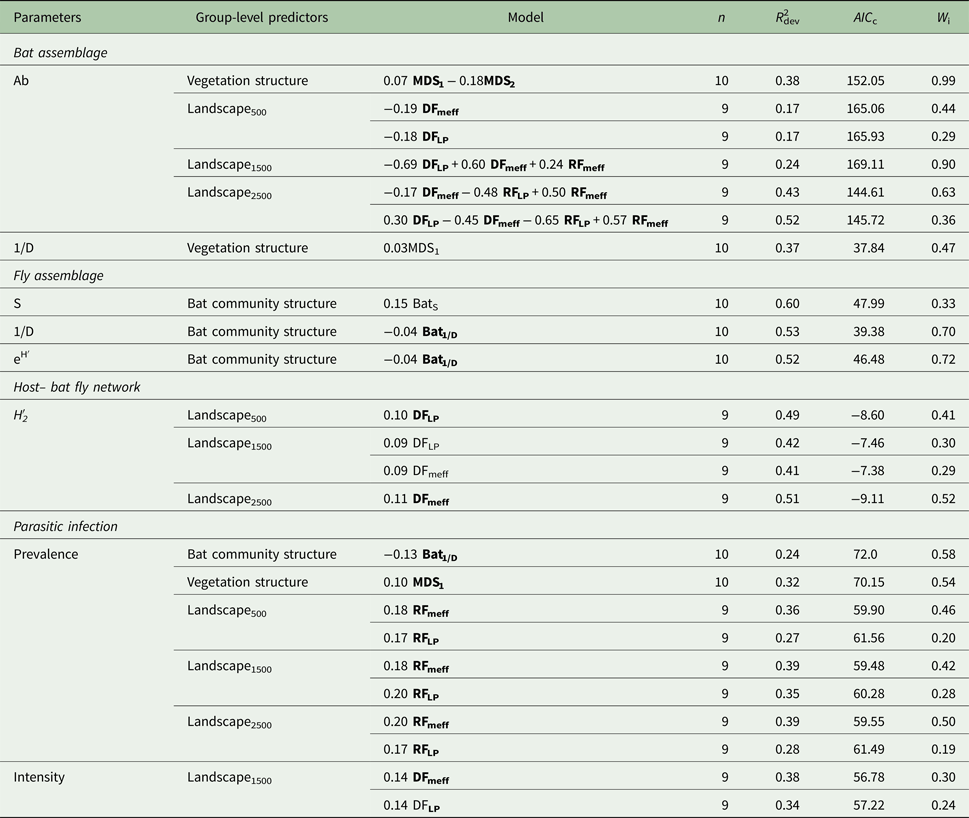
Second, we detected an association between vegetation attributes at the stand level and both bat abundance and diversity (Tables 2 and S1). Specifically, a higher abundance of bats and a trend toward a lower level of dominance (1/D), were associated with areas with more vegetation development (taller trees, higher tree basal area, a higher number of woody species and individuals, and a lower degree of understory density). In addition, the variation in bat abundance was associated with the variation on the landscape attributes. Higher bat abundance, in general, was associated with sites surrounded by a lower proportion of dry and RFs as well as to sites where DF remnants were more fragmented while riparian remnants were less fragmented. Regarding the variation in the attributes of streblid communities, their variation in species richness tend to mirror the variation in bat species richness, while a higher streblid diversity was significantly associated with a lower bat diversity (Tables 2 and S1).
Most plausible models explaining the variation on bat and bat fly assemblages, as well as on the interaction network

Response variables: bat abundance (Ab) and diversity (1/D, Simpson diversity index); bat fly assemblage richness (S), and diversity (1/D and eH′, Shannon diversity index); the level of specialization of the host–bat fly network (H′2, specialization index); and the prevalence and intensity of fly infestation. The explanatory variables corresponding to the different groups of predictors (group-level predictors) are: (1) regarding the vegetation structure, the scores of the first and second ordination axes (MDS1 and MDS2), that reflect plant assemblage's dissimilarities in vegetation structural complexity; (2) regarding the landscapes attributes, the landscape proportion (LP) and degree of fragmentation (meff) regarding the tropical dry forest (DF) and riparian forest (RF), at the 500, 1500 and 2500 m focal scales; and (3) regarding the bat community structure, bat assemblage richness (BatS) and diversity (Bat1/D). R dev2 represents the fraction of the total deviance explained by models. AICc is the sample-sized adjusted Akaike information criterion and Wi are the Akaike weights. The coefficient corresponding to each predictor is also presented. Predictors showing a significant (P < 0.05) relationship with the response variable are shown in bold. The P values corresponding to other predictors varies between 0.05 and 1. The null model was the most plausible model in all cases for the following parameters: bat assemblage's richness (S) and diversity (eH′), and fly assemblage abundance (Ab).
Considering the potential drivers of variations in bat–fly interaction networks, we found that the degree of specialization of the entire network could be modulated by the variation in landscape attributes, specifically those regarding DF. In this sense, we detected more specialized networks in sites surrounded by a high proportion of DF with a low degree of fragmentation (Tables 2 and S1). We also found that the prevalence of fly infestation was significantly associated with the bat community structure, the vegetation structure and the landscape attributes regarding RF at different spatial scales (from 500 to 2500 m), while the intensity of infestation was mainly associated with those landscape attributes regarding DF at intermediate spatial scales (1500 m) (Tables 2 and S1). For example, on one hand, a higher prevalence of infestation could be favoured by a higher dominance within bat communities as well as by a higher vegetation structural complexity and a higher proportion of continuous RF. On the other hand, a higher intensity of infestation would tend to be favoured by a higher proportion of continuous DF.
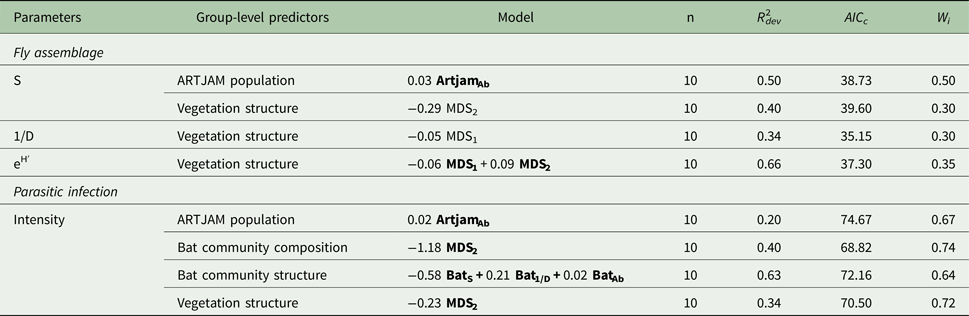
Concerning A. jamaicensis fly communities, the variation on the attributes of the host population was the main driver of variation on streblid richness, while the variation on the attributes of the vegetation stand was the main driver of variation on streblid diversity (Tables 3 and S2). Specifically, a higher abundance of A. jamaicensis was significantly related to a higher species richness of streblids, whereas the vegetation stands with less structural complexity were significantly associated with a lower level of streblid dominance (1/D) and a higher species diversity (eH′). Sites with a higher number of branches tended to show higher streblids richness and higher infestation levels in individuals of A. jamaicensis (Tables 3 and S2).
Most plausible models explaining the variation in bat fly communities associated with Artibeus jamaicensis and the level of parasitic infection

Response variables: fly assemblage richness (S), and diversity, considering both the Simpson diversity index (1/D) and the Shannon diversity index (eH′); as well as the intensity of fly infestation on the populations of A. jamaicensis. The explanatory variables corresponding to the different groups of predictors (group-level predictors) are: (1) regarding the A. jamaicensis population attributes, the abundance (Ab) of A. jamaicensis (Artjam); (2) regarding the bat community composition, the scores of the first, second and third ordination axes (MDS1, MDS2, MDS3) reflecting bat assemblage's dissimilarities in species composition; (3) regarding the bat community structure, bat assemblage richness (BatS), diversity (Bat1/D) and abundance (BatAb); and (4) regarding the vegetation structure, the scores of the first and second ordination axes (MDS1 and MDS2) reflecting plant assemblage's dissimilarities in vegetation structural complexity. R dev2 represents the fraction of the total deviance explained by models. AICc is the sample-sized adjusted Akaike information criterion and Wi are the Akaike weights. The coefficient corresponding to each predictor is also presented. Predictors showing a significant (P < 0.05) relationship with the response variable are shown in bold. The P values corresponding to other predictors varies between 0.05 and 1. The null model was the most plausible model in all cases for the following parameters: fly assemblage abundance (Ab) and fly prevalence.
Finally, we found that the degree of infestation intensity of A. jamaicensis could be significantly determined by the abundance of its populations as well as by the composition and structure of the communities in which it is inserted (Tables 3 and S2). For example, higher infestation intensity in A. jamaicencis individuals would occur within bat communities with lower levels of richness and dominance and with higher levels of abundance.
Discussion
In general, our sampling effort was adequate to properly characterize bat and bat fly communities, as well as the number of interactions among both groups of species (sampling completeness was higher than the 80%). We detected a high level of specialization on the host–bat fly interaction network, in correspondence with previous findings regarding parasitism by streblids (Dick and Patterson, Reference Dick, Patterson, Morand, Krasnov and Poulin2006); however, we also detected two different patterns in the way streblids interact with host species: (1) streblids strictly associated with a single host species (monoxenous) such as: Aspidoptera delatorrei, Megistopoda proxima, Nycterophilia parnelli, Trichobius parasiticus, T. sparsus, and T. sp.; and (2) streblids occurring in multiple host species (stenoxenous and/or oligoxenous, sensu Colín-Martínez et al., Reference Colín-Martínez, Morales-Malacara and García-Estrada2018), such as: Megistopoda aranea, Parauctenodes longipes, Strebla curvata, T. dugesii, T. sphaeronotus, T. uniformis, T. yunkeri. The stenoxenous species are those inhabiting host species belonging to the same genus, which is the case of Paratrichobius longicrus and T. intermedius, only found in species belonging to the genus Artibeus. We also found that several streblid species, belonging in most cases to a different genus, infest a single bat species. Nevertheless, there was a stronger degree of similarity in terms of ectoparasite community composition among bat species belonging to the same genus or belonging to the same trophic guild (also closely related species) (Fig. 3B). These patterns could arise as a result of: (1) a tight evolutionary association among flies and bats lineages; (2) a high degree of similarity among congeneric and other closely related host species in terms of body size, vagility, burrow type, roosting system, social structure and immunocompetence; and (3) convergent responses from different streblid species and lineages to the same host attributes (Presley, Reference Presley2011). Obviously, more natural history studies are needed to support these potential explanations.
Potential drivers influencing bat and fly communities and their interactions
Our results reveal that, in anthropogenic tropical landscapes, the variations in the streblid communities are associated with the variations in their host communities and populations. The changes in streblid diversity and composition mirrored, to a large extent, the variation on host composition and diversity (Fig. 5, Table 2). Even the streblids associated with A. jamaicensis were sensible to changes on the structure and species composition of bat communities in which A. jamaicensis was inserted, potentially determining the degree of streblid infestation intensity (Table 3 ‘Parasitic infection’). This strong influence of bat communities on streblid communities is due to several reasons: (1) as streblids are obligated parasites, they are tightly coupled to their hosts, (2) the high level of specialization of the bat–streblid interaction; (3) the ability of some streblids to infest multiple host species – even the most specialized streblids can spill over and temporarily invade another species –, (4) the influence of the interactions among bat species (i.e. competition) on the host–parasite interaction (Ostfeld and Keesing, Reference Ostfeld and Keesing2012), and (5) the influence of bats diversity on streblids abundance and ability to spread, as highly diverse hosts communities could inhibit parasites abundance and dissemination via several mechanisms, such as regulating populations of susceptible hosts, or interfering with parasite transmission (dilution effect, Schmidt and Ostfeld, Reference Schmidt and Ostfeld2001; Civitello et al., Reference Civitello2015). The first two reasons may explain why the fly species richness was coupled to bats species richness (Table 2 ‘Fly assemblage’), and the relation between a higher streblid species richness and intensity of infestation, with a higher overall bat abundance as well as with a higher abundance of A. jamaicensis (Table 3); this could be directly associated with an increase in the amount of trophic resources and in the likelihood of finding a host for newly emerged adult flies. Specifically, the effect of A. jamaicencis abundance on streblid communities, strongly reinforce the idea that contact with conspecific hosts structures the ectoparasite communities (Presley, Reference Presley2011). On the other hand, the reasons (3)–(5), help to explain why a greater bat diversity (associated with a lower dominance in the community) would affect negatively streblid diversity and prevalence (Table 2, ‘Fly assemblage’ and ‘Parasitic infection’), as well as why a higher bat species richness would affect negatively the infestation intensity of A. jamaicensis individuals (Table 3, ‘Parasitic infection’); specifically, an increase in bat diversity and richness could be associated with a decrease in the abundance of bat species functioning as the most effective hosts, and consequently would affect the dissemination and prevalence of streblids. These results show that the dilution effect could also be present in bat–flies interaction.
Although several kinds of filters could promote the high level of specificity observed, such as the encounter filter (excluding hosts that the parasite cannot encounter and colonize), the compatibility filter (excluding hosts in which the parasite cannot survive) and the reproductive filter (reproductive isolation of bat flies on host lineages), the anthropogenic and natural disturbances can modulate or eliminate some of these filters, promoting the occurrence of novel interactions (Dick and Patterson, Reference Dick, Patterson, Morand, Krasnov and Poulin2006). Indeed, our results reveal new interactions (Table 1), some of which could be a consequence of cross-host contamination of parasites or induced by disturbances. This scenario supports the hypothesis that bat–fly interaction can be context-dependent and significantly affected by habitat disturbance (Pilosof et al., Reference Pilosof2012).
In this sense, the loss of trees due to clearing for grazing and agriculture could promote higher concentrations of different bat species roosting altogether in the remaining refuges. This could increase the likelihood of both intraspecific and interspecific transmission of parasites, potentially increasing the occurrence of novel interactions. This would explain why a higher diversity and richness of streblids in A. jamaicensis, as well as a higher intensity of infestation in this species, are associated with degraded vegetation stands (as hypothesized) that offer potential temporary refuges for bats while foraging (a higher availability of branches), contributing to host aggregation (Table 3).
In addition, the higher bat abundance found in vegetation stands characterized by a high structural complexity (i.e. taller trees, higher tree basal area and higher number of woody individuals), could be explained by the presence, in these vegetation stands, of large trees that constitute the main source of roost for bats species in the region, due to the low number of caves available (Ortiz-Ramírez et al., Reference Ortiz-Ramírez2006; Zarazúa-Carbajal et al., Reference Zarazúa-Carbajal2016). The higher bat abundance in these vegetation stands could favor a greater probability of encounter among individuals and consequently the higher streblid prevalence we found (Table 2, ‘Bat assemblage’ and ‘Parasitic infection’). However, these trees are being increasingly and synergistically affected by anthropogenic (agriculture, cattle ranging and timber extraction) and natural disturbances such as hurricanes (i.e. Jova in 2011 and Patricia in 2015), which could obligate bats to depend on an increasingly reduced number of refuges (potential increase in the use of available roosts), rising their aggregation and likelihood of infestation by teneral streblid adults, just eclosing from pupariums on bat roosts (Dick and Patterson, Reference Dick, Patterson, Morand, Krasnov and Poulin2006; Pilosof et al., Reference Pilosof2012). This could deeply affect bat–fly interactions. As bats are not exposed to streblids while in flight (adult flies only survive approximately 25 h without blood meal) (Dick and Patterson, Reference Dick, Patterson, Morand, Krasnov and Poulin2006), all these results point toward the tremendous importance of the roosting dynamics for determining bat–fly interactions (Patterson et al., Reference Patterson, Dick and Dittmar2007).
We also found that changes on landscape attributes constitute a major driver influencing bat and streblid communities (Fig. 5), their interaction networks (i.e. the degree of specialization) and consequently the prevalence and intensity of streblid infection (Table 2). As hypothesized, this can primarily be due to certain reasons: (1) the high degree of mobility of bats; (2) changes on bats degree of mobility and home range size as a consequence of anthropogenic disturbance, which can determine their degree of aggregation (and consequently the ectoparasite transference among individuals and prevalence), as well as the likelihood of encountering new parasites species (higher mobility would increase the likelihood of encountering different parasites); (3) changes on bat populations density due to variations on mortality rate (coupled to variations on resources availability and distribution) and on the distribution of individuals among the remnant patches of resources; (4) changes on the degree of dilution of fly abundance (dilution effect), as a consequence of changes on potential host species richness and diversity; and (5) changes on bats health and fitness, which can determine the success of ectoparasites to colonize new hosts (Cottontail et al., Reference Cottontail, Wellinghausen and Kalko2009; Pilosof et al., Reference Pilosof2012).
Interestingly, we found that while variation in landscape attributes appear to be the main driver of bat abundance, the variation in landscape attributes regarding DF appear to exert a major influence on bat–streblid interactions, specifically on the degree of specialization of the interaction network and on the intensity of infestation. To this respect, we hypothesize that less specialized bat–streblid networks are induced by host crowding resulting of DF loss and fragmentation, which will increase the rate of ectoparasite transfer among different bat species. We also hypothesize that the higher bat abundance resulting of the crowding (Table 2 ‘Bat assemblage’), could favour a decrease in the streblid intensity of infestation in fragmented DFs, as these parasites would be distributed among a higher number of bats potentially belonging to different species. This would explain why less specialized networks and a lower intensity of streblid infestation tend to be associated with sites inserted in a matrix with a lower proportion of DF and a higher degree of fragmentation (Table 2 ‘Host-bat fly network’ and ‘Parasitic infection’). Additionally, the DF represents the most important coverage in the region (56.1% of the land cover, Sanchez-Azofeifa et al., Reference Sanchez-Azofeifa2005) and consequently, it can exert more influence on bats and their interactions.
The RF – found along permanent and temporary waterways – is less represented in the study region (3.7% of land cover) but, according to our results, it significantly influences bat communities and their interactions (Fig. 5, Table 2). First, the RF represents an important source of the roost in the region, concentrating many trees with a high diameter. Second, the RF contains most evergreen species, offering trophic resources (flower, fruits, insects, native and non-native mammals such cattle) for bats all year round, and particularly during the dry season when food availability is scarce in the DF (Avila-Cabadilla et al., Reference Avila-Cabadilla2012). Finally, bats use the strips of RF as flyway or stepping-stones when commuting between roost and foraging areas along the anthropogenic matrix; this makes them and their interactions with streblids sensible to changes in RF connectivity/fragmentation. In this sense, we hypothesize that a site inserted in a landscape with a large proportion of RF could be more attractive for bats than a site surrounded by a lower proportion of RF; considering that this type of forest is relatively scarce in the region, this could suppose a greater aggregation of bats in the first site, that would favour parasites transmission and prevalence. This coincides with the reported positive association between a large proportion of RF in the landscape – at several spatial scales – and the streblid prevalence (Table 2 ‘Parasitic infection’). However, fragmented RFs would offer less roosts and trophic resources for bats, also losing, to a certain degree, their function as corridors along the landscape; this could decrease bat abundance and consequently the probability of parasites transmission between individuals (diminishing the prevalence of streblid infestation) in sites surrounded by fragmented RFs, in comparison to sites surrounded by continuous RFs. This would explain the association we found between a greater bat abundance and streblid prevalence with the presence of less fragmented RFs in the landscape (Table 2 ‘Bat assemblage’ and ‘Parasitic infection’).
The variation on landscapes attributes can affect indirectly the streblid species composition, as streblids mirrored the response of bats communities – indirect effect –, which are potentially affected by a variation on landscape attributes at both lower (500 m) and larger (2500 m) spatial scales (Fig. 5 and Table 2). However, changes in the degree of forest fragmentation could also promote changes in the environmental conditions which can exert a direct effect on streblids. Habitat fragmentation can be associated with variations on microclimatic variables such as temperature, which can influence the life cycle of streblid species. It has been found, for example, that an increase in temperature could speed up the life cycle of some species (Dick and Petterson, Reference Dick, Patterson, Morand, Krasnov and Poulin2006). The effect of forest fragmentation can be more pronounced during the dry season, when most plants shed their leaves, increasing the levels of solar radiation and temperature and decreasing the relative humidity of the air (Alvarez-Añorve et al., Reference Alvarez-Añorve2012). A reduction of air relative humidity could negatively affect to streblid species, overall during the life period that occurs out of their host (i.e. prepupal deposition, development of the pupae, the emergence of teneral adult).
Finally, contrary to our expectations, changes in the body condition of A. jamaicensis does not seem to be an important driver affecting its streblids communities. As a high ectoparasite density is considered a consequence of poor bat health and not its cause (Marshall, Reference Marshall and Kunz1982), the variation on body condition probably did not exceed a threshold that would affect the different mechanisms controlling parasites (i.e. the immune system and grooming behaviors) (Marshall, Reference Marshall and Kunz1982; Cottontail et al., Reference Cottontail, Wellinghausen and Kalko2009). This can be due to the high plasticity of this species, being able to use different roosts types (i.e. hollow trees, dense foliage, leaf tents and buildings) and to consume a wide spectrum of items (i.e. fruits, leaves, pollen and insects) (Ortega and Castro-Arellano, Reference Ortega and Castro-Arellano2001). In fact, A. jamaicensis is the most widespread species of the genus, occurring in a wide range of habitats (i.e. evergreen forest, cloud forest, seasonal DF and human-modified habitats), and is also one of the species dominating phyllostomid assemblages in the study region (Avila-Cabadilla et al., Reference Avila-Cabadilla2014). It must also be considered that in this region there still are relatively large patches of preserved forest, which can be effectively exploited by highly vagiles species such as A. jamaicensis, that presents commuting distances up to 8 km (Morrison, Reference Morrison1978).
Summarizing, our results revealed that: (1) drivers acting at multiple spatial scales can be affecting simultaneously bats and streblids communities, and the way in which both groups of species interact; (2) the streblid response to anthropogenic disturbance mirrored bat response to a large extent, evidencing the significant role of indirect mechanisms in shaping streblid communities; (3) bats roosting dynamics, even during feeding, appears to be a determining factor on bat–streblid interactions, modulating the degree of parasite prevalence and the intensity of infestation; (4) a degraded matrix, with low forest cover and connectivity, could favor crowding and consequently the exchange of ectoparasites among bat species, lessening the level of specialization that characterizes the bat–streblid interaction networks (revealing a context dependent specialization degree) and promoting novel interactions, and (5) bat-flies interactions in anthropogenic landscapes can be shaped by the dilution effect, as a decrease in bat diversity and richness could be associated with an increase in the abundance of bat species functioning as the most effective hosts, and consequently to a potential increase in the dissemination and prevalence of streblids.
To go deeper in elucidating the mechanisms determining the interaction among bats and parasites such as streblids in anthropogenic landscapes, it is strongly necessary to evaluate bat response not only at the population and community level, but also at the individual level, elucidating the effect of anthropogenic disturbance on the host fitness and health, and consequently on its interaction with parasites. It is also urgent to carry out studies on streblid natural history (i.e. dispersal capability), revealing specific mechanisms underlying the direct and indirect effects of habitat disturbance on streblid communities. General information regarding the natural history of species involved in key interactions is of tremendous importance as nothing in ecology makes sense except in the light of natural history (after Feinsinger personal communication). Definitively, the understanding of the effect of anthropogenic disturbance on host bat–parasite interaction, will provide an invaluable tool for the preservation of bats, the key ecological processes and services they sustain, and the domestic mammals and human health.
Supplementary material
The supplementary material for this article can be found at https://doi.org/10.1017/S0031182018000732
Acknowledgements
Logistical support was offered by the ‘Escuela Nacional de Estudios Superiores, Unidad Morelia (ENES-Morelia)’, the ‘Estación de Biología Chamela’, and the ‘Unidad Multidisciplinaria de Docencia e Investigación-Juriquilla, Facultad de Ciencias’ of the ‘Universidad Nacional Autónoma de México’. Technical assistance was provided by the Engs. P. García, F. Hernandez, J. Huerta and S. Tinoco, of the ENES–Morelia. Fieldwork and samples processing were largely performed thanks to the help of M.E. Zamora-Espinoza, M. Pineda, KI. Torres, S. Ruiz, A. Lopez, and J. Ruiz. Finally, we thank W. Dáttilo and E. del-Val for sharing some of the R scripts used for graphing and analysing the bipartite interaction networks, as well as to J. Flores-Puerto for helping with the preparation of some figures. The results of this study are part of the thesis of the principal author, under the direction of Dr Mariana Yólotl Alvarez Añorve and Dr Luis Daniel Avila Cabadilla.
Financial support
This work was supported by the ‘Programa de Apoyo a Proyectos de Investigación e Innovación Tecnológica’ of the ‘Universidad Nacional Autónoma de México’ (L.D.A.C., IA-203413, and M.Y.A.A., IA-204014); and the ‘Consejo Nacional de Ciencia y Tecnología’ (L.D.A.C., CB-222202).
Ethical standards
Animal capture and handling were in accordance with the laws of the Mexican government. We have the authorization of the Dirección General de Vida Silvestre (SGPA/DGVS Permit 03288/13 to LDAC) of the Mexican Ministry of Environment. The protocols were also approved by the National Autonomous University of Mexico (UNAM), and specifically by the internal Committee for Research Ethics of the National School of Higher Education, UNAM campus Morelia (CEI-ENESMorelia/UNAM). We also followed the guidelines provided by Sikes et al. (Reference Sikes and Gannon2011) for wild mammals used in research.
Conflicts of interest
None