INTRODUCTION
Entamoeba histolytica (E. histolytica) is a microaerophilic enteric protozoan parasite and the etiological agent of amoebiasis in humans, has a worldwide distribution, especially in developing countries with substantial morbidity and mortality (WHO/PAHO/UNESCO, 1997; Morf and Singh, Reference Morf and Singh2012). The World Health Organization reported that clinical human infections with these protozoa are still estimated to occur in 34–50 million people worldwide, of which approximately 100 000 deaths annually (Walsh, Reference Walsh1986; World Health Organization, 1997; Tanyuksel and Petri, Reference Tanyuksel and Petri2003; Choudhuri and Rangan, Reference Choudhuri and Rangan2012). The amoebiasis produces dysentery as a result of the perforation of the large intestine and often invades other organs, primarily the liver, leading to amoebic liver abscess (ALA) development, which can cause death (Haque et al. Reference Haque, Kabir, Noor, Rahman, Mondal, Alam, Rahman, Al Mahmood, Ahmed and Petri2010; Ordaz-Pichardo et al. Reference Ordaz-Pichardo, Leon-Sicairos, Hernandez-Ramirez, Talamas-Rohana and de la Garza2012). The ALA is a focal destruction of liver tissue, attributed mainly to parasite pathogenicity factors, including adherence, contact-dependent cytolysis and phagocytosis (Helk et al. Reference Helk, Bernin, Ernst, Ittrich, Jacobs, Heeren, Tacke, Tannich and Lotter2013). Moreover, oxidative stress has been also implicated in the aetiology of amoebiasis, because the reactive oxygen species (ROS) generated by inflammatory cells is thought to be one of the major factors that contributes to tissue damage, and further because E. histolytica must survive to changes in oxygen tensions and ROS in order to establish infection (Pearson et al. Reference Pearson, Morf and Singh2013). The most studied of these environmental stresses are the response of pathogens to nitric oxide (NO), to superoxide radical (O2 •¯) and to hydrogen peroxide (H2O2) that are produced by phagocytes (Ghosh et al. Reference Ghosh, Dutta and Raha2010). However, the strong adaptive response of E. histolytica to oxidative stress requires of specific regulation of different molecular pathways, which have not been fully elucidated.
On the other hand, some studies have shown that redox homeostasis is tightly controlled by the nuclear factor (erythroid-derived 2)-like 2 (Nrf2), which is a basic leucine zipper redox sensitive transcriptional factor that plays a centre role in ARE (antioxidant response element)-mediated induction of phase II detoxifying and antioxidant enzyme, especially NADP (H): quinine oxidoreductase-1, glutathione S-transferase, glutathione peroxidase, glutamate-cysteine ligase, heme oxygenase-1 (HO-1), superoxide dismutase (SOD) and catalase (CAT) (Motohashi and Yamamoto, Reference Motohashi and Yamamoto2004; Miao and St Clair, Reference Miao and St Clair2009). In addition, results obtained from animal studies suggest that antioxidant effect of Nrf2 may be achieved by suppression of pro-inflammatory pathways, which are mediated by nuclear factor-kappa B (NF-κB) signalling (Li et al. Reference Li, Khor, Xu, Shen, Jeong, Yu and Kong2008). The NF-κB is a pleiotropic transcription factor ubiquitously expressed that regulates the expression of pro-inflammatory genes in response to oxidative stress and pathogens, including E. histolytica (Surh, Reference Surh2008; Bellezza et al. Reference Bellezza, Mierla and Minelli2010; Sánchez-Alemán et al. Reference Sánchez-Alemán, Quintanar-Stephano, Escobedo-González, Campos-Esparza, Campos-Rodríguez and Ventura-Juárez2014; Ávila-Blanco et al. Reference Ávila-Blanco, Muñoz-Ortega, García-Lorenzana, Quintanar-Stephano, Campos-Esparza, Campos-Rodríguez and Ventura-Juárez2015). Therefore, these observations prompted us to investigate the oxidative stress and the concerted modulation between NF-κB and Nrf2 signalling pathways in the hamster liver during acute amoebic infection.
MATERIALS AND METHODS
Animals
Male golden hamsters (Mesocricetus auratus) of 120–160 g body weight were used in this work. All animals received human care according to guidelines of the Committee on Bioethics in the animal facilities of the Autonomous University of Aguascalientes, which is based on the NHI guidelines for animal research (National-Research-Council, 2011). The animals were maintained in a 12 h light/dark cycle in a controlled room temperature of 25 °C and a standard diet of Purina Chow with free access to drinking water.
Maintaining virulence of trophozoites of the E. histolytica
Trophozoites of the E. histolytica strain HM-1:IMSS has been passaged multiple times through animal livers to preserve its virulence and were grown under axenic conditions in Diamond's TYI-S-33 medium at 35·9 °C, according to the Diamond procedure (Diamond et al. Reference Diamond, Harlow and Cunnick1978).
Amoebic infection in hamster liver
The inoculum was prepared from 72 h trophozoites in the exponential phase of growth (5 × 10⁵) were inoculated by intrahepatic injection in a volume of 100 µL culture medium as previously described (Tsutsumi et al. Reference Tsutsumi, Mena-Lopez, Anaya-Velazquez and Martinez-Palomo1984; Ventura-Juarez et al. Reference Ventura-Juarez, Campos-Rodriguez and Tsutsumi2002). The hepatic amoebiasis infection was carried out in anaesthetized animals with sodium pentobarbital (30 mg kg−1, i.p.).
Experimental design
Twenty animals were intrahepatically infected with virulent trophozoites as previously described. These animals were randomly divided into four groups, and they were sacrificed at 12, 24, 36 and 48 h after amoebic infection (ALA groups, each time n = 5). Moreover, 20 sham-operated hamsters were included as negative controls; they received 100 µL of medium without trophozoites, and then these hamsters were divided into four groups for sacrifice at 12, 24, 36 and 48 h (SHAM groups, each time n = 5). Finally, five healthy animals were an additional control (Intact group).
Sacrificed animals
Animals were anaesthetized with sodium pentobarbital (50 mg kg−1, i.p.). Blood was collected via cardiac puncture and livers were carefully dissected free from the surrounding tissues and immediately, rinsed in saline solution 0·9%. Fragments of liver lesion were dissected and immediately frozen in liquid nitrogen and stored at −20 °C until use, finally additional portions from ALA were fixed in 4% formaldehyde phosphate buffered saline.
Biochemical estimations
Blood samples were collected and centrifuged at 3000 rpm for 20 min at 4 °C. Serum was used for the determination of liver damage by measuring alkaline phosphatase (ALP) (Bergmeyer et al. Reference Bergmeyer, Grabl, Walter, Bergmeyer and Grabl1983), γ-glutamyl transpeptidase (γ-GTP) (Glossmann and Neville, Reference Glossmann and Neville1972) and alanine aminotransferase (ALT) activities (Reitman and Frankel, Reference Reitman and Frankel1957). Small liver pieces of amoebic abscess (0·1 g) were separated for glycogen determination using the anthrone reagent (Seifter et al. Reference Seifter, Dayton, Novic and Muntwyler1950).
Histological stainings
Small liver samples fixed with 4% formaldehyde during 72 h were paraffin included. Five micrometres sections were mounted on silane coated glass slides. Liver tissue slides were stained with haematoxylin-eosin (H&E) and Masson trichrome methods as described by Manual of Histologic Staining Methods of the Armed Forces (Luna, Reference Luna1968).
Isolation of total proteins
Liver tissues (100 mg) were lysed with 300 µL of lysis buffer (Tris-HCl 10 mm, pH 7·4, NaCl 50 mm, iodoacetamide 3 mm, phenylmethanesulfonyl fluoride 1 mm, tosyl-L-lysine chloromethyl ketone 3 mm, N-ethilmaleimida 3 mm and triton 0·1%). Total protein was determined by Bradford's method (Bradford, Reference Bradford1976).
Western blot assays
Volumes equivalent to 50 µg of total proteins were used on a 12% polyacrylamide gel electrophoresis; separated proteins were transferred to polyvinylidene difluoride membranes (BioRad, 162-0·176, Hercules, CA, USA). Next, blots were blocked with 5% skim milk and 0·05% Tween-20 for 1 h at room temperature and individually incubated at room temperature with antibodies selective against each protein, phospho NF-κB Ser536 and cleaved caspase-3 Asp175 (Cell Signalling 3033, 9664 respectively), Nrf2, HO-1 and CAT (LifeSpan BioSciences, LS-C154863, LS-C15743 and LS-B3014, respectively), SOD1 (Pierce, POI-PA130195), glycogen synthase kinase-3β (GSK-3β), 4-Hydroxy-2-nonenal (4-HNE), Tumour Necrosis Factor-α (TNF-α) (Abcam, ab124661, ab40545, ab1793) and interleukin-1β (IL-1β) (Millipore, MAB1001). Membranes were washed and exposed to horseradish peroxide-conjugated anti-Mouse, anti-Goat and Anti-Rabbit IgG (Sigma, A9044, A5420, A0545), respectively, diluted 1:2000 in the blocking solution for 1 h at room temperature. Blots were washed and developed using the Clarity Western ECL Substrate (Bio-rad, 170-5061). Blots were incubated with a monoclonal antibody directed against β-actin (Sigma, A2066), which was used as a control to normalize protein production levels. The procedure to strip membranes was as follows: first, blots were washed four times with phosphate-saline buffer pH 7·4 (0·015 m, 0·9% NaCl), then immersed in stripping buffer (2-mercaptoethanol 100 mm, sodium dodecyl sulphate 2% and Tris–HCl 62·5 mm, pH 6·7) for 30 min at 60 °C with gentle shaking, membranes were then washed five times with 0·05% Tween-20 in phosphate saline buffer. The proteins expressions were analysed densitometrically using the ImageJ software.
Statistical analysis
Data of five independent animals in each test were performed by three replicates and were expressed as mean values ±s.e. Comparisons were carried out by analysis of variance followed by Tukey's test using GraphPad Prism 5.00 software. Differences were considered statistically significant when p < 0·05.
RESULTS
Experimental ALA
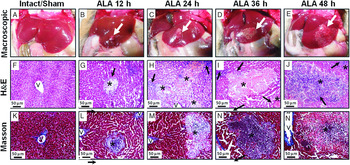
The livers of control animals (intact and sham groups) were morphologically normal (Fig. 1A, F, K). At 12 h after amoebic inoculation (Fig. 1B), small granular lesions were visible on the liver surface in all infected hamsters and the lesion area was increased as time goes on (Fig. 1B–E). Similarly, histological observations with H&E staining showed that at 12 h the amoebic lesions presented as delimited nodular necrosis areas constituted of inflammatory infiltrate and surrounded by normal hepatic parenchyma (Fig. 1G). At 24, 36 and 48 h was observed that the fusion of these focal lesions lead to the formation of central areas of necrosis constituted and bordered with inflammatory infiltrate (Fig. 1H–J). Masson's trichrome staining showed no increase in collagen formation in the evaluated times of ALA induction (Fig. 1K–Ñ).
Macroscopic and microscopic changes in the liver of hamsters infected with E. histolytica. Representative pictures of healthy livers (Intact and shams groups) and the ALA development (white arrow) in hamsters infected to 12, 24, 36 and 48 h (ALA groups). The H&E stain shows a necrotic focus (*) surrounded by inflammatory infiltrates (black arrow), are usually observed. The Masson's trichrome stain shows a granulomatous area without finding any appreciable presence of collagen deposition. (V) Central Vein. Scale bar =50 µm. ALA, amoebic liver abscess; H&E, hematoxylin and Eosin.

Serum liver damage markers and metabolic activity of the liver
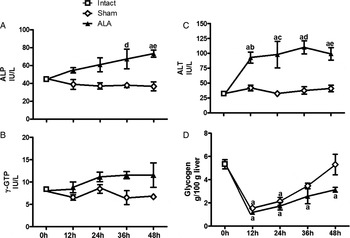
The enzymatic activities of ALP, γ-GTP and ALT were assessed as hepatocellular injury markers (Fig. 2A–C). The ALP and γ-GTP are enzymes embedded in the hepatocyte plasma membrane, mainly in the canalicular domain. In the present study, ALP activity tended to be rising over time in infected groups and this increase being significant at 48 h (Fig. 2A), whereas that the γ-GTP activity only showed a tendency to rise (Fig. 2B). Moreover, ALT is an enzyme stored in the cytosol of hepatocytes, and when these are damaged or destroyed, it escapes to the systemic circulation and their levels in the serum have been widely recognized as an important indicator to judge the severity of acute hepatic injury (Clark et al. Reference Clark, Brancati and Diehl2003). After 12 h of amoebic liver infection, the serum activity of ALT was significantly enhanced as compared with healthy controls (Fig. 2C). On the other hand, glycogen is the main source of energy in the body; the hepatic content of this carbohydrate is an indicator of metabolism and functionality (Seifter et al. Reference Seifter, Dayton, Novic and Muntwyler1950). Glycogen content in ALA area was markedly reduced after 12 h post-surgery in all animals (ALA and Sham groups). However, the normal levels are reached to 48 h in the sham group while the ALA group fails to return to normal levels within 48 h post-infection (Fig. 2D).
Enzymatic activities of ALP, γ-GTP and ALT were determined in serum samples and glycogen content was determined in hepatic lesion areas from intact group (white square), shams animals (white diamond) and infected with trophozoites at 12, 24, 36 and 48 h (ALA), (black triangle). Each bar represents the mean value of experiments performed in duplicate assays ±s.e. (n = 5). a, Mean values significantly different from intact group; b, mean values significantly different from sham group at 12 h; c, mean values significantly different from sham group at 24 h; d, mean values significantly different from sham group at 36 h and e, mean values significantly different from sham group at 48 h, p < 0·05. ALA, amoebic liver abscess; ALT, alanine aminotransferase; ALP, alkaline phosphatase; γ-GTP γ-glutamyl transpeptidase.

Oxidative stress during amoebic liver infection
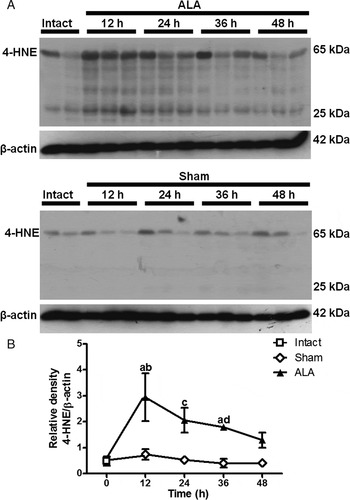
Oxidative stress is commonly associated with a number of liver diseases (Singal et al. Reference Singal, Jampana and Weinman2011) including ALA (Ghosh et al. Reference Ghosh, Dutta and Raha2010). Nevertheless, the molecular mechanisms are still not fully understood. Therefore, using Western blotting assay was evaluated the hepatic oxidative damage by detection of the protein expression of 4-HNE as an index of lipid peroxidation (Chapple et al. Reference Chapple, Cheng and Mann2013). After 12 h of E. histolytica infection was induced the protein expression of 4-HNE in ALA area, which then progressively decreased at 24, 36 and 48 h. This protein was observed from 25 to 65 kDa (Fig. 3A, B).
Western immunoblot showing time course of 4-HNE expression during ALA formation. Representative Western blot from two (intact group) o three animals analysed (A) from intact group (white square), sham-operated hamsters at 12, 24, 36 and 48 h (Shams groups, white diamond) and inoculated at 12, 24, 36 and 48 h with trophozoites (ALA groups, black triangle). Signal intensities were determined by denstitometric analysis of treated blots and values calculated as the ratio of 4-HNE/β-actin (B) Results are shown as the mean value ±s.e. of five animals analysed in three replicates. a, mean values significantly different from intact group; b, mean values significantly different from sham group at 12 h; c, mean values significantly different from sham group at 24 h; d, mean values significantly different from sham group at 36 h. Significant differences with respective controls (p < 0·05). ALA, amoebic liver abscess; 4-HNE, 4-hidroxynonenal.

NF-κB and Nrf2 signalling during amoebic infection
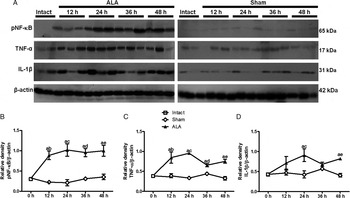
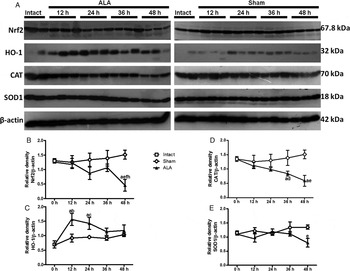
In this work, we considered to evaluate the role of pNF-κB and Nrf2 in ALA, because pNF-κB regulates the expression of pro-inflammatory genes, while Nrf2 encodes for antioxidant and cytoprotection genes (Bellezza et al. Reference Bellezza, Mierla and Minelli2010). Western blot shows that in the acute phase of the amoebic infection, the NF-κB is activated at 12 h and remained apparently unchanged at 12, 24, 36 and 48 h in relation to the control groups (Fig. 4A, B). This activation leads to increased expression of TNF-α at 12, 24, 36 and 48 h post-infection (Fig. 4A, C), whereas IL-1β increased at 12, 24 and 48 h and decreased at 36 h post-infection (Fig. 4A, D). Densitometry analysis was performed for each protein expression (Fig. 4B–D). Furthermore, Nrf2 expression remained apparently unchanged at 12 h, and showed a tendency to decrease at 24 and 36 h, and was significantly reduced at 48 h post-infection (Fig. 5A, B). Moreover, because Nrf2/ARE signalling pathway by NO and peroxynitrite is associated with an up-regulation of HO-1 (Naughton et al. Reference Naughton, Hoque, Green, Foresti and Motterlini2002; Buckley et al. Reference Buckley, Marshall and Whorton2003; Foresti et al. Reference Foresti, Hoque, Bains, Green and Motterlini2003; Park and Kim, Reference Park and Kim2005), we decide to evaluate the HO-1 production and our results shows that this protein peaked at 12 and 24 h and was decreased to normal levels at 36 and 48 h after infection (Fig. 5A, C). Finally, hepatic levels of CAT an H2O2-scavenger enzyme, showed a tendency to decrease at 12 and 24 h, still a significant decline at 36 and 48 h after inoculation of trophozoites (Fig. 5A, D), while the SOD1, a specific scavenger of O2 •¯ anion, remained apparently unchanged at 12, 24 and 36 h and was significantly decreased at 48 h post-infection (Fig. 5A, E). Intact and shams groups remained virtually unchanged.
Differential expression of NF-κB, IL-1β and TNF-α in injured livers of ALA. Representative Western blot from two (intact group) o three animals analysed (A) from intact group (white square), sham-operated hamsters at 12, 24, 36 and 48 h (Shams groups, white diamond) and inoculated at 12, 24, 36 and 48 h with trophozoites (ALA groups, black triangle). Signal intensities were determined by densitometric analysis of treated blots and values calculated as the ratio of p-NF-κB/β-actin (B), IL-1β/β-actin (C) and TNF-α/β-actin. Results are shown as the mean value ±s.e. of five animals analysed in three replicates. a, mean values significantly different from intact group; b, mean values significantly different from sham group at 12 h; c, mean values significantly different from sham group at 24 h; d, mean values significantly different from sham group at 36 h; e, mean values significantly different from sham group at 48 h. Significant differences with respective controls (p < 0·05). ALA, amoebic liver abscess; p-NF-κB, phospho-nuclear factor-kappa B; IL-1β, interleukin-1β; TNF, tumour necrosis factor.

Differential expression of Nrf2, HO-1, CAT and SOD1 after intrahepatic infection with E. histolytica. Representative Western blot from two (intact group) o three animals analysed (A) from intact group (white square), sham-operated hamsters at 12, 24, 36 and 48 h (Shams groups, white diamond) and inoculated at 12, 24, 36 and 48 h with trophozoites (ALA groups, black triangle). Signal intensities were determined by densitometric analysis of treated blots and values calculated as the ratio of Nrf2/β-actin (B), HO-1/β-actin (C), CAT/β-actin (D) and SOD1/β-actin (E). Results are shown as the mean value ±s.e. of five animals analysed in three replicates. a, mean values significantly different from intact group; b, mean values significantly different from sham group at 12 h; c, mean values significantly different from sham group at 24 h; d, mean values significantly different from sham group at 36 h; e, mean values significantly different from sham group at 48 h. Significant differences with respective controls (p < 0·05). ALA, amoebic liver abscess; Nrf2, nuclear factor (erythroid-derived 2)-like 2; HO-1, heme oxygenase-1; CAT, catalase; SOD1, superoxide dismutase1.

Apoptosis during amoebic infection
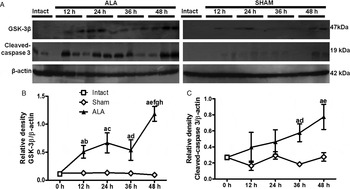
Western blots were used to evaluate two markers of apoptotic process (GSK-3β and cleaved caspase-3), (Fig. 6). GSK-3β was increased in the first hours (12, 24 and 36 h) but this increase peaked at 48 h of hepatic infection (Fig. 6A, B). Cleaved caspase-3 (active form) showed a tendency to rise at 12 and 24 h, and significantly increase at 36 and 48 h (Fig. 6A, C).
Changes in the protein level of cleaved caspase-3 and GSK-3β in the ALA. Representative Western blot from two (intact group) o three animals analysed (A) from intact group (white square), sham-operated hamsters at 12, 24, 36 and 48 h (Shams groups, white diamond) and inoculated at 12, 24, 36 and 48 h with trophozoites (ALA groups, black triangle). The values were calculated as the ratio of cleaved caspase-3/β-actin (A) and GSK-3β/β-actin (B). Results are shown as the mean value ±s.e. of five animals analysed in three replicates. a, mean values significantly different from intact group; b, mean values significantly different from sham group at 12 h; c, mean values significantly different from sham group at 24 h; d, mean values significantly different from sham group at 36 h; e, mean values significantly different from sham group at 48 h; f mean values significantly different from ALA group at 12 h; g, mean values significantly different from ALA group at 24 h; e, mean values significantly different from ALA group at 36 h. Significant differences with respective controls (p < 0·05). ALA, amoebic liver abscess; GSK-3β, glycogen synthase kinase-3β.

DISCUSSION
Previously, some research groups have demonstrated that induction of Nrf2 and suppression of NF-κB-mediated pathways may strongly contributes to control the elevation of parasite burden and hence consistently improves the outcome of parasite-induced inflammation, such as Plasmodium falciparum and Opisthorchis veverrini infections (Charoensuk et al. Reference Charoensuk, Pinlaor, Prakobwong, Hiraku, Laothong, Ruangjirachuporn, Yongvanit and Pinlaor2011; Olagnier et al. Reference Olagnier, Lavergne, Meunier, Lefevre, Dardenne, Aubouy, Benoit-Vical, Ryffel, Coste, Berry and Pipy2011). In the present work, we study for the first time that concerted modulation of Nrf2 and NF-κB during amoebic liver infection.
Our study shows that all hamsters infected with virulent trophozoites developed at 12 h visible granular lesions, and the hepatic injury also was consistent with biochemical markers of liver damage such as ALT, ALP and γ-GTP. On the other hand, has long been recognized that the conditions of injury by surgery is associated with metabolic changes affecting all parts of the body, such as the hormones released in the early response to stress and injury, promoting liver and muscle glycogenolysis, this stage has been termed by Cuthbertson (Reference Cuthbertson1942) the ‘Ebb phase’, and lasts typically around 12–24 h depending on many factors such as the severity of the injury and the treatment given (Frayn, Reference Frayn1986). Our experimental animals who underwent surgery presented the ‘Ebb phase’, evidenced by depletion of hepatic glycogen content after surgery, which is not reestablished at 48 h in ALA group compared with the sham group, suggesting that the metabolic capacity of the liver is being lost as well as infection progresses.
It has been considered that the typical amoebic abscess is due to necrotic lysis, which varies in size from a few centimetres to a large lesion (Santi-Rocca et al. Reference Santi-Rocca, Rigothier and Guillen2009). Although, other works have suggested that E. histolytica trophozoites do not produce ALA in hamsters through direct lysis of hepatocytes and that the tissue destruction is the result of the accumulation and subsequent lysis of leucocytes and macrophages surrounding the amoebas (Tsutsumi et al. Reference Tsutsumi, Mena-Lopez, Anaya-Velazquez and Martinez-Palomo1984). Nevertheless, other studies have suggested that amoebic molecules can diffuse some distance from the trophozoites and promote cytotoxic effects by inducing the secretion of enzymes or pro-inflammatory cytokines in other cells, like polymorphonuclear leucocytes, macrophages and endothelial cells, suggesting that cytotoxicity by trophozoites can occur even in the absence or close contact between the trophozoites and the liver parenchymal cells (Ventura-Juarez et al. Reference Ventura-Juarez, Campos-Rodriguez and Tsutsumi2002). Notwithstanding, the type of cell death induced by E. histolytica remains controversial, because this parasite can induce necrosis or apoptosis (Berninghausen and Leippe, Reference Berninghausen and Leippe1997; Seydel and Stanley, Reference Seydel and Stanley1998; Huston et al. Reference Huston, Houpt, Mann, Hahn and Petri2000). We have shown by H&E stain and ALT activity that the liver necrosis was evidenced from 12 h after infection, whereas the apoptosis markers (cleaved caspase-3 and GSK-3β) also are overexpressed in acute phase of ALA development, suggesting that apoptotic process is also present from 12 h, which increases significantly to 48 h. Studies in vitro have shown that E. histolytica is able to activate caspase-3 in host cells in a contact-dependant manner, which is required for programmed cell death (Huston et al. Reference Huston, Houpt, Mann, Hahn and Petri2000). However, GSK-3β has never been evaluated during ALA, it is known that is able to induce apoptosis by inhibiting pro-survival transcription factors, such as cAMP response element-binding protein (CREB) and heat shock factor-1 (HSF-1) and facilitating pro-apoptotic transcription factors such as p53 (Grimes and Jope, Reference Grimes and Jope2001; Watcharasit et al. Reference Watcharasit, Bijur, Zmijewski, Song, Zmijewska, Chen, Johnson and Jope2002). Furthermore, it has been reported in different works the relationship between GSK-3β and active caspase-3 (Song et al. Reference Song, De Sarno and Jope2002; Thotala et al. Reference Thotala, Geng, Dickey, Hallahan and Yazlovitskaya2010; Zhang et al. Reference Zhang, Guo, Zhang, Wen, Piao, Shi, Chen, Duan and Ren2015). We suggest for the first time the relationship between GSK-3β and active caspase-3 in the ALA model in hamster.
Additionally, virulent strains of E. histolytica can use transcriptional networks in response to oxidative and nitrosative stress (Davis et al. Reference Davis, Zhang, Guo, Townsend and Stanley2006; Vicente et al. Reference Vicente, Ehrenkaufer, Saraiva, Teixeira and Singh2009). Previously it has been reported that patients with ALA exhibit an intensification of oxygen-nitrogen stress, lipid peroxidation and inactivation of antioxidation system (Chikobava and Sanikidze, Reference Chikobava and Sanikidze2006). The present work shows that 4-HNE, which is considered a cytotoxic product originating from the peroxidation of liver microsomal (Benedetti et al. Reference Benedetti, Comporti and Esterbauer1980; Esterbauer et al. Reference Esterbauer, Schaur and Zollner1991), was abundantly expressed in the first 12 h of amoebic infection. It is known that during acute state of ALA the PMN cells increase NO, O2 •¯ and peroxynitrite (Tsutsumi and Martinez-Palomo, Reference Tsutsumi and Martinez-Palomo1988). Moreover, previously was reported a significant transient increase in iNOS mRNA levels and oxidative stress 12 h post-inoculation of E. histolytica, while no significant differences were observed at a different time (Ramírez-Emiliano et al. Reference Ramírez-Emiliano, González-Hernández and Arias-Negrete2005). Other than, it has been demonstrated that 4-HNE is able to modulate activation of NF-κB, for example, 4-HNE may induce cell death by activating NF-κB pathways (Yin et al. Reference Yin, Wang, Cen, Yang, Liang and Xie2015). It is known that during the ALA, active NF-κB upregulate the IL-8 synthesis, which is a crucial mediator in inflammation and tissue injury (Lee et al. Reference Lee, Nam, Min, Kim, Nozaki, Saito-Nakano, Mirelman and Shin2014). In addition, it is known that 4-HNE stimulates the activation of Nrf2 signalling pathway (Chen and Niki, Reference Chen and Niki2006). In the present work, we show for the first time that differential regulation occurs on these signalling transduction pathways (NF-κB and Nrf2) under the oxidative microenvironment of ALA, possibly caused by the highest degree of PMN infiltration found between 9 and 12 h after inoculation (Tsutsumi et al. Reference Tsutsumi, Mena-Lopez, Anaya-Velazquez and Martinez-Palomo1984). On the one hand, NF-κB is activated and the pro-inflammatory cytokines (TNF-α, IL-1β) production is increased during acute amoebic state, while the lack of Nrf2 expression and the antioxidant defence (HO-1, CAT, SOD1) induced an uncontrolled inflammation, thus contributing to increase disease severity. It has been established that SOD is an abundant enzyme that catalyses the dismutation of O2 •¯ into O2 and H2O2 in cells. Thus, SOD serves an important antioxidant defence against oxidative stress. Three forms of SOD; namely, cytoplasmic Cu/Zn superoxide dismutase (SOD1), mitochondrial Mn superoxide dismutase (SOD2) and extracellular superoxide dismutase (SOD3) are present in mammals (Miao and St Clair, Reference Miao and St Clair2009). SOD1 localizes mainly at the cytoplasm but is also found in the nucleus and the inter-membrane space of the mitochondria (Papa et al. Reference Papa, Manfredi and Germain2014). Moreover, CAT serve as the first line of defence against H2O2 a ROS variously formed as a cell signalling agent, a weapon of intercellular warfare, or a by-product of aerobic metabolism (Beyer and Fridovich, Reference Beyer and Fridovich1988; Chelikani et al. Reference Chelikani, Fita and Loewen2004). Our results suggest that antioxidant defence of host decrease in inflammatory microenvironment induced by presence of trophozoites. In addition, results presented here revealed that 12 h after amoebic infection also over-expressed the protein HO-1, which is a cytoprotective enzyme and is upregulated during oxidative stress and is a potential therapeutic strategy to protect the liver against chemically induced injury (Origassa and Camara, Reference Origassa and Camara2013; Na and Surh, Reference Na and Surh2014). This result suggests us that Nrf2 pathway is activated in the first hours, perhaps trying to counter oxidative damage induced by E. histolytica, however the antioxidant system by HO-1 is decreased at 36 and 48 h, as well as Nrf2 production, suggesting that Nrf2 pathway is declined by parasite invasion.
It is noteworthy that the regulation of Nrf2 involves two mechanisms; the first, based on redox-sensitive proteosomal degradation via Keap1-Cullin3/Rbx1 E3 ligase complex; and on the second, GSK-3 phosphorylates a group of Ser residues in the Neh6 domain of Nrf2, leads to ubiquitination via a β-TrCP/Cullin1 E3 ligase complex and promotes its degradation in a Keap1-independent manner (Rada et al. Reference Rada, Rojo, Chowdhry, McMahon, Hayes and Cuadrado2011). Our results suggest that down expression of Nrf2 may be due at least in part to overexpression of GSK-3β, although, previous findings suggest that under circumstances of strong oxidant or electrophilic injury, both GSK-3 and Nrf2 are subject to a temporal biphasic regulation. They argue that in the initial phase, oxidative stress leads to inhibition of several phosphatases, resulting in activation of Akt and further phosphorylation of GSK-3, causing inactivation of the kinase. At the same time, modification of thiols in Keap-1, will lead to its inactivation and to stabilization of Nrf2, which result in the induction of ARE-driven genes. Finally, in the late phase, Akt will be inhibited by ceramide-activated phosphatases or other mechanisms and GSK-3 will become activated. Following its activation, GSK-3 will target Nrf2 for b-TrCP-mediated proteasomal degradation (Rada et al. Reference Rada, Rojo, Chowdhry, McMahon, Hayes and Cuadrado2011). Recently, was demonstrated that GSK-3β acts upstream of Fyn kinase in regulation of nuclear export and degradation of Nrf2 (Jain and Jaiswal, Reference Jain and Jaiswal2007). Additionally, it has been observed that the use of GSK-3β inhibitors maintains high protein and activity levels of Nrf2 in the nucleus (Cuadrado et al. Reference Cuadrado, Moreno-Murciano and Pedraza-Chaverri2009). However, it is necessary to continue studying the possible regulation mechanisms for transcription factor Nrf2 during amoebic injury.
Besides results have revealed that pro-mature cysteine proteinase 5, a major virulent factor that is abundantly secreted and/or present on the surface of amoeba binds via its RGD motif to α(V)β(3) integrin on Caco-2 colonic cells and stimulates NF-κB-mediated pro-inflammatory responses (Hou et al. Reference Hou, Mortimer and Chadee2010). Binding to this integrin triggers integrin linked kinase (ILK) mediated phosphorylation of Akt-473, which binds and induces the ubiquitination of the NF-κB essential modulator NEMO. As NEMO is required for the activation on the IKKα-KKβ complex and NF-κB signalling, these events markedly up-regulate protein-inflammatory mediator expression in vitro in Caco-2 cells and in vivo in colonic loop studies in wild-type and Muc2 (-/-) mice lacking an intact protective mucus barrier (Hou et al. Reference Hou, Mortimer and Chadee2010; Serrano-Luna et al. Reference Serrano-Luna, Pina-Vazquez, Reyes-Lopez, Ortiz-Estrada and de la Garza2013). It has also been found that Lipophosphoglycan-like (LPG) and lipopeptidophosphoglycan (LPPG) glycosylphosphatidylinositol-linked molecules of E. histolytica probably behave like pathogen-associated molecular patterns (PAMPs) that are recognized by Toll-Like Receptors (TLRs), such as TLR-2 and TLR-4, thus leading to the activation of neutrophils and macrophages, which produce cytokines that could stimulate the production of ROS and activating NF-κB (Pacheco-Yepez et al. Reference Pacheco-Yepez, Galván-Moroyoqui, Meza, Tsutsumi and Shibayama2011; Campos-Rodríguez et al. Reference Campos-Rodríguez, Gutiérrez-Meza, Jarillo-Luna, Drago-Serrano, Abarca-Rojano, Ventura-Juárez, Cárdenas-Jaramillo and Pacheco-Yepez2016). Further, with these observations, a recent study on amoebiasis showed a significant increase in NF-κB activation in neutrophils and macrophages in vagotomized hamsters from 6 h to 7 days post-infection with E. histolytica and other work showed in simpathectomized animals with ALA, a decrease of macrophages and neutrophils positives to phospho-NF-κB p65 (Sánchez-Alemán et al. Reference Sánchez-Alemán, Quintanar-Stephano, Escobedo-González, Campos-Esparza, Campos-Rodríguez and Ventura-Juárez2014; Ávila-Blanco et al. Reference Ávila-Blanco, Muñoz-Ortega, García-Lorenzana, Quintanar-Stephano, Campos-Esparza, Campos-Rodríguez and Ventura-Juárez2015). Thus, it is notable that our results are consistent with these studies.
In conclusion, this work shows for the first time a role for Nrf2 in ALA. The present results provide direct evidence of decline in the production of Nrf2, HO-1, SOD1 and CAT and higher expression of phospho NF-κB Ser536, IL-1β and TNF-α during the ALA development in hamster. Although further studies are needed, this report highlights that Nrf2 transcription factor could be an alternative to prevent or to optimize ALA treatment with combination of Nrf2 inducers.
FINANCIAL SUPPORT
The authors thank UAA by the Grant PIBB11-3 (to J.V.J.), to Conacyt by the post-doctoral support given to Liseth R. Aldaba-Muruato (176507), Grant CONACYT 134487 (to J.V.J.) and grant awarded to Nayeli A. Márquez-Muñoz, through the ‘Estancias Posdoctorales Vinculadas al Fortalecimiento de la calidad del Posgrado Nacional 2014’ and ‘Estancias de Investigación de Estudiantes de Pregrado 2015, CONACYT’ programs, respectively.