Implications
This study is of great interest for the characterization and differentiation of the studied breeds and shows that the most common types of beef carcasses produced in Spain could be considered a low fat product. From a nutritional standpoint, the low fatness determines a polyunsaturated/saturated index close to the recommended values, although the grain-based feeding of the animals means an n-6/n-3 ratio higher than the recommended value. From a productive point of view, differences between slaughter weights in lipid composition would be mainly due to the higher intramuscular fat content of heavier animals but also to the acquisition of ruminal functionality. Significant differences in fat composition among breeds were found, although many of them were relatively small. Finally, these differences among breeds were more pronounced in heavier animals, while in veal type only Asturiana stood out clearly as the leanest breed.
Introduction
Beef provides consumers with high-quality protein and associated vitamins and minerals. A desirable beef product should have an adequate amount of intramuscular fat. Besides, it is a concentrated source of energy for the body, fat-soluble vitamins A, D, E and K and the essential fatty acids (Romans et al., Reference Romans, Costello, Carlson, Greaser and Jones1994). As such, fat contributes importantly to various aspects of meat quality and to the nutritional value of meat and it can also influence sensory traits. However, too much fat discourages purchase and it is commonly removed either before cooking or during eating (Wood et al., Reference Wood, Enser, Fisher, Nute, Sheard, Richardson, Hughes and Whittington2008). Recently, the emphasis has shifted away from fat quantity to fat quality (Webb and O’Neill, Reference Webb and O’Neill2008). Hence, the level of cholesterol (C) and the ratios of polyunsaturated fatty acids to saturated fatty acids (PUFA/SFA) and the ratio n-6/n-3 PUFA are widely used to evaluate the nutritional value of fat.
Beef lipids are not generally regarded as a healthy component of the human diet, because they have been associated with high content of C and hypercholesterolaemic SFA, but low concentration of hypocholesterolaemic PUFA. However, beef has low fat (<5%) and low C contents (<75 mg/100 g; Chizzolini et al., Reference Chizzolini, Zanardi, Dorigoni and Ghidini1999), and it is one of the few natural sources of dietary n-3 and n-6 PUFA.
The fat amount and composition of bovine tissues from a specific production system represent the combined and interacting effects of breed, gender age/weight at slaughter and nutrition, but their confounding effect makes it difficult to extrapolate results (De Smet et al., Reference De Smet, Raes and Demeyer2004; Webb and O’Neill, Reference Webb and O’Neill2008). In Spain, there is a huge variety of local breeds and breeding systems. The most common types of animals slaughtered are veal type (VT) and yearling bulls (YB; Alberti et al., Reference Alberti, Ripoll, Goyache, Lahoz, Olleta, Panea and Sañudo2005). The purpose of this work was to study both breed and slaughter weight effect on the amount of lipid fractions and the fatty acid composition of intramuscular fat (IMF) of beef from seven local Spanish cattle breeds. These results are of great interest for meat characterization and differentiation in these local breeds.
Material and methods
Animals and sample collection
The IMF of 104 entire males of seven Spanish local breeds was analysed. Animals were provided by the local Breed Associations of Spain and they were registered in the herd book and complied with the racial standard of each breed. Animals were kept with their mothers until weaning at 6 months and then they were allotted into groups to be fattened. After weaning, animals were collected from the farms and they were fed intensively the same diet in the same facility. They were fed ad libitum with concentrate and cereal straw until two different slaughter weights: VT (53 individuals) and YB (51 individuals), which are the most common type of animals slaughtered in Spain. Animals of the same breed and commercial weight were lodged in one pen. The breed names and the number of individuals per feedlot included in the study were Asturiana (AT, veal type n = 7, young bull type n = 6), Avileña (AV, 7, 8), Parda Alpina (PA, 7, 8), Pirenaica (PI, 8, 7), Retinta (RE, 8, 7), Rubia Gallega (RG, 8, 7) and Morucha (MO, 8, 8). They are breeds for beef production except PA, which is considered to be both dairy and beef breed. The PA breed originates from animals of Swiss Brown breed introduced in Spain at the end of the 19th century. Today, this breed is totally adjusted to the local environment and handling. MO, RE and AV originated in extensive livestock systems from the West and South of Spain, whereas AT, PI, PA and RG originated in semi-extensive livestock systems in Northern Spain. It is known that the mutant myostatin allele is segregating in the AT breed (Oliván et al., Reference Oliván, Martínez, Osoro, Sañudo, Panea, Olleta, Campo, Oliver, Serra, Gil and Piedrafita2004). However, the mutation responsible for double muscling was not present in the AT animals studied, and it was a condition in their selection. Alberti et al. (Reference Alberti, Ripoll, Goyache, Lahoz, Olleta, Panea and Sañudo2005) found that, according to carcass characteristics, within each commercial weight, the breeds studied in this paper can be divided into three groups: (a) RE, MO and AV could be considered early maturing breeds and they were characterized by long carcasses with low conformation and high subcutaneous fat cover. (b) RG and AT were considered late maturing breeds and they had the most compact carcasses with mostly convex profiles and good muscle development. (c) PA and PI had carcasses with intermediate characteristics between these groups.
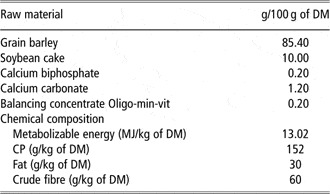
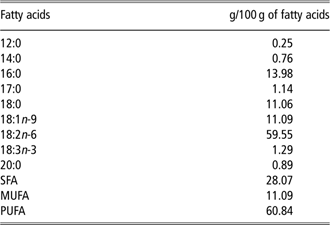
The chemical composition and the fatty acid profile of the concentrate fed are described in Tables 1 and 2. The concentrate used to feed animals had a 15.2% of CP and 13.02 MJ ME/kg dry matter.
Fattening feed composition

DM = dry matter.
Major fatty acid composition of the concentrate meal (g/100 g of fatty acids)

SFA = saturated fatty acids; MUFA = monounsaturated fatty acids; PUFA = polyunsaturated fatty acids.
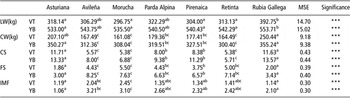
Cattle had access to feed and water until slaughter and their care and use followed European guidelines (Official Journal of the European Communities, 1999). Veal and young bull types were slaughtered at an average live weight of 320 and 550 kg, respectively. The carcass characteristics of these animals are reported in Table 3. Carcasses were classified using the European classification scale for conformation (S superior; E excellent; U very good; R good; O fair; P poor), and fatness (1 low; 2 slight; 3 average; 4 high; 5 very high). Conformation and fatness scores were subdivided into three grades (+, 0, −), scoring conformation from 18 for S+ to 1 for P−. For fatness cover, the classification score was 15 for 5+ and 1 for 1− (Official Journal of the European Communities, 1991). After chilling carcasses under commercial conditions at 4°C for 24 h, the longissimus muscle was removed from the left carcass side and a 2 cm-thick steak for lipid composition analysis from the 7th rib was cut and vacuum-packaged in pouches of polyamide/polyethylene (120 μm and 1 cc/m2 per 24 h O2 permeability, 3 cc/m2 per 24 h CO2 permeability and 0.5 cc/m2 per 24 h N2 permeability, measured at 5°C and 75% relative humidity (Vaeseen Schoemarket Ind. Spain)). After packaging, 1-day samples were frozen and stored at −20°C until lipid composition analysis. Before analyses, the steaks were thawed at 4°C overnight.
Effect of ‘breed’ and ‘slaughter weight’ on live weight, carcass characteristics and percentage of intramuscular fat of longissimus muscle (least square mean and mean square error (MSE))

VT = veal type; YB = yearling bull; LW = live weight; CW = carcass weight; CS = conformation score; FS = fatness score; IMF = intramuscular fat.
Different superscript letters within a row indicate significant differences;
*** P < 0.001. Differences between slaughter weight groups were significant in all cases (P < 0.001).
Percentage of IMF and thin layer chromatography
Percentage of IMF on the longisssimus muscle was calculated by the soxhlet method (International Organization for Standardization – ISO 1443, 1973). The extraction of fat for the analysis of lipid classes and fatty acids was carried out by the Bligh and Dyer method (Reference Bligh and Dyer1959). In both analyses, the longissimus samples were trimmed of surrounding fats before grinding.
Thin layer chromatography on silica gel plates 60 (20 × 20 cm; Merck, Darmstadt, Germany) was used to separate lipid extract into lipid classes, using the method reported by Beriain et al. (Reference Beriain, Sarries, Indurain and Insausti2005). Applications of the extracted fat samples diluted in chloroform were carried out with quantitative applicator Linomat IV (CAMAG). Plates were developed in a solvent containing hexane : diethyleter : formic acid (80 : 20 : 4; v/v/v). Triacylglycerol (TG) fractions migrated towards the top of the plates and phospholipids (PL) remained at the origin.
For densitometry analysis, plates were sprayed with a mixture of anisaldehyde : ethanol : concentrate sulphuric acid : acetic acid (0.5 : 9 : 0.5 : 0.1; v/v/v/v) and heated at 200°C for 5 min to visualize the lipid spots. The lipid classes were identified by comparing R f values with those of the standard mixture (Sigma-Aldrich, St. Louis, MO, USA). Standard mixtures contained PL (phosphatidylcholine), monoglycerides (MG; monomiristoil), diglycerides (DG; dioleine), C, free-fatty acids (FFA; oleic acid), TG; trioleine and cholesterol esters (CE; cholesterol oleate), according to the concentrations reported by Christie (Reference Christie1981) in beef, and they were purchased from Sigma Chemical Co. (Madrid, Spain). Each lipid spot was integrated using an imaging densitometer Bio-Rad GS-700 (Bio-Rad Laboratories, Hercules, CS, USA). Lipid classes were expressed as a percentage of the sum of all lipid classes in each sample.
Fatty acid composition
The lipid extract obtained by Bligh and Dyer (Reference Bligh and Dyer1959) was mixed with the internal standard (21 : 0, methyl ester) and methylated with a mixture of boron trifluoride : benzene : methanol (25/20/55, v/v/v), as described by Morrison and Smith (Reference Morrison and Smith1964). Analysis of fatty acid methyl esters was accomplished on a gas chromatograph HP 5890 (Hewlett–Packard, Madrid, Spain) series II equipped with a flame ionization detector and an automatic injector (HP 7673, Hewlett–Packard; ISO 5508, 1990). Fatty acid methyl esters were separated on a polyethylenglycol capillary column of size 60 m × 0.25 mm × 0.25 μm (HP 19091N-136 crosslinked, Hewlett–Packard). Analysis was carried out using helium as the carrier gas, with a flow of 1 ml/min, and a splitless injection mode. The oven temperature was programmed from 150°C to 210°C at 10°C/min, from 210°C to 240°C at 5°C/min, and held at 240°C for 25 min. Injector temperature was 255°C and the detector was at 240°C. Individual fatty acids were identified by comparing their retention time with those of authenticated standards (Sigma-Aldrich). Individual fatty acids were corrected by their relative response factor (using the value of the internal standard) and expressed as a percentage of the total fatty acids identified.
Statistical analysis
The statistical analysis was conducted using the statistical package SPSS for Windows 15.0 (2006). The GLM procedure was used to compare the means among breeds and slaughter weight groups. The following model was used to study differences in carcass characteristics:

The following model was used to study differences in IMF composition:

where yijk = each of the studied variables (lipid classes and fatty acids); μ = least square mean; Bi = fixed effect due to breed (i = 1 AT, i = 2 AV, i = 3 PA, i = 4 PI, i = 5 RE, i = 6 RG, i = 7 MO); Wj = fixed effect due to slaughter weight group (j = 1 slaughter weight 320 kg live weight, j = 2 slaughter weight 550 kg live weight); W × Bij = effect due to the interaction between breed and slaughter weight group; b×IMFk(Wj), effect due to the percentage of IMF in the longissimus muscle nested to the slaughter weight group; eijk = random residual effect.
All significance tests were conducted at the 5% level.
Factorial analysis, using the principal component extraction (PCA) and Varimax rotation method (Morrison, Reference Morrison1990), was applied to study the relationship among lipid fractions and to try and segregate breeds and weights at slaughter on the basis of a fat : lean ratio. The purpose of PCA is usually to determine a few linear combinations of the original variables, which can be used for summarizing the data with minimal loss of information. The contribution of the original variables to the extracted principal component is proportional to the linear combination of original variables (Aishima and Nakai, Reference Aishima and Nakai1991). In this way, reduction of initial data to a smaller group of variables allows an easier understanding of the relationship among variables and between variables and samples. Hence, the structure of the relationship among variables can be observed (Beriain et al., Reference Beriain, Alfonso and Gorraiz2001).
Results
Carcass characteristics
Both the effects of breed and the slaughter weight were significant (P < 0.001) and there was no interaction W × B for any carcass characteristics. There was an increase in animal and carcass weight, conformation score, fatness score and percentage of IMF in the longissimus muscle at heavier slaughter weights (Table 3). RG cattle had higher live and carcass weight because VT animals of this breed achieved the slaughter weight before weaning, and therefore they were slaughtered very close to their arrival at the feedlot with a higher weight than initially fixed in the experimental design. Regarding carcass grading, RE, MO and AV were characterized by carcasses with low conformation score and high fatness score. RG and AT had carcasses with higher muscle development and lower fatness degree. PA and PI had carcasses with intermediate characteristics between other breeds. Animals of MO breed showed a higher percentage of IMF than animals of AT, PI and RG breeds, and animals of AT and RG breeds had lower IMF content at the longissimus muscle than AV and MO (Table 3).
Lipid classes
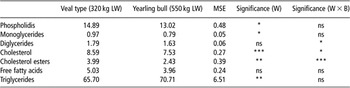
TG was the major lipid class in IMF of the longissimus muscle, followed by PL, C, FFA, CE, DG and MG, in the studied breeds and slaughter weights (Table 4).
Effect of ‘slaughter weight’ (W) and interaction ‘slaughter weight × breed’ (W × B) on the lipid classes (%) (least square mean and mean square error (MSE)) of intramuscular fat of longissimus muscle

ns P > 0.05; *P < 0.05; **P < 0.01; ***P < 0.001.
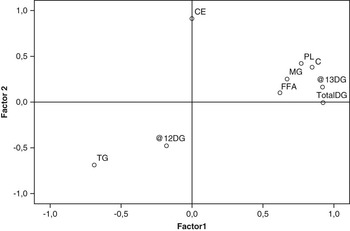
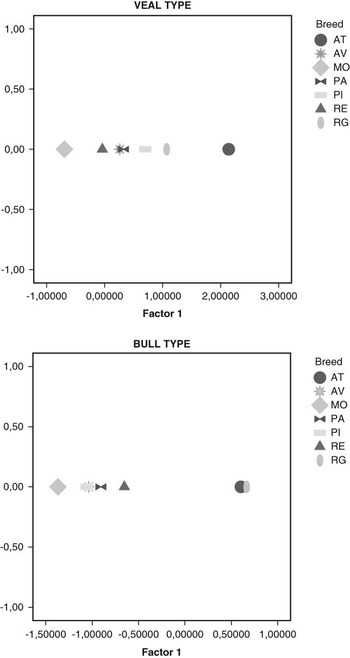
The increase in slaughter weight caused a reduction in the percentage of PL and MG, as well as a reduction in C and CE (P < 0.05; Table 4). In contrast, an increase in the slaughter weight meant an increase in TG. This opposite evolution of the lipid fractions was confirmed by the PCA analysis where two factors that accounted for 69.39% variability were obtained. Factor 1 (56.10%; Figure 1) can be named a fat : lean ratio because TG were negatively related to PL, MG, DG, C and FFA. When plotting breeds on this fat : lean ratio (Figure 2), AT and RG breeds were leaner than the rest and this trend was more pronounced in heavier animals. Factor 2 was only related to CE.
Plot of lipid fractions on the bidimensional space formed by factors 1 and 2. Phospholipids (PL), monoglycerides (MG), diglycerides (DG), cholesterol (C), free-fatty acids (FFA), triacylglycerols (TG) and cholesterol esters (CE).

Plot of ‘breeds’ on the bidimensional space formed by factors 1 and 2 obtained by principal component analysis of lipid fractions. Asturiana (AT), Avileña (AV), Parda Alpina (PA), Pirenaica (PI), Retinta (RE), Rubia Gallega (RG) and Morucha (MO).

Animals of AT breed showed a higher percentage of PL (18.75 g/100 g), but lower percentage of TG (58.22 g/100 g) than the other six breeds (P < 0.05). In contrast, MO showed the lowest PL percentage (11.23 g/100 g) and the highest TG content (72.42 g/100 g). C was also higher in the leaner breeds (AT and RG) both for the VT and YB commercial types (AT–VT: 11.34, AT–YB: 9.36 g/100 g and RG–VT: 8.78, RG–YB: 10.07 g/100 g).
Fatty acid composition
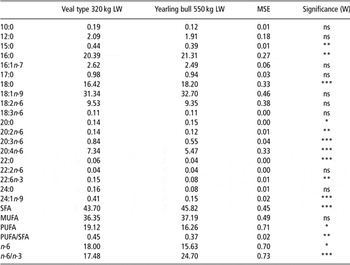
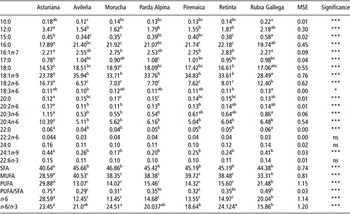
Fatty acid profile was approximately made up of around 45% of SFA, 37% of monounsaturated fatty acids (MUFA) and 18% of PUFA. The major fatty acids were oleic (18:1n-9) as MUFA, palmitic (16:0) and stearic (18:0) as SFA and linoleic (18:2n-6) and eicosatetraenoic (20:4n-6) as PUFA (Tables 5 and 6).
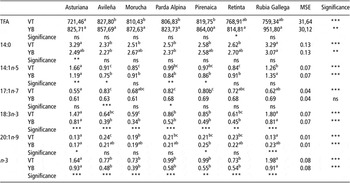
Tables 5 and 7 show the effects of slaughter weight and breed, respectively, for those fatty acids that showed no interaction between W × B. Table 6 shows the effect of breed and slaughter weight for those fatty acids that showed significant W × B interaction.
Effect of ‘slaughter weight’ on fatty acid content (g/100 g of fatty acids; least square mean and mean square error (MSE)) of intramuscular fat of longissimus muscle

LW = live weight; SFA = saturated fatty acids; MUFA = monounsaturated fatty acids; PUFA = polyunsaturated fatty acids.
ns P > 0.05; *P < 0.05; **P < 0.01; ***P < 0.001.
Effect of ‘breed’ and ‘slaughter weight’ on content of TFA (mg/100 g) and on fatty acids (g/100 g of fatty acids; least square mean and mean square error (MSE)) of the intramuscular fat of longissimus muscle

TFA = total fatty acids; VT = veal type; YB = yearling bulls.
Different superscript letters within a row indicate significant differences among breeds; ns P > 0.05; *P < 0.05; **P < 0.01; ***P < 0.001.
Effect of ‘breed’ on fatty acid content (g/100 g of fatty acids; least square mean and mean square error (MSE)) of intramuscular fat of longissimus muscle

SFA = saturated fatty acids; MUFA = monounsaturated fatty acids; PUFA = polyunsaturated fatty acids.
Different superscript letters within a row indicate significant differences; ns P > 0.05; * P < 0.05; *** P < 0.001.
The interaction slaughter W × B was significant for total fatty acids and for the fatty acids myristic (14:0), myristoleic (14:1n-5), heptadecenoic (17:1n-7), α-linolenic (18:3n-3), gondoic (20:1n-9) and n-3 (Table 6). The increase in the slaughter weight (W) involved an increase in the percentage of SFA (P < 0.001) in the intramuscular fat, due to an increase in the proportion of fatty acids 16:0, 18:0 and eicosanoic (20:0). In contrast, those heavier and fatter animals displayed a smaller percentage of PUFA (P < 0.05), due to a smaller percentage of fatty acids 18:2n-6, eicosadienoic (20:2n-6), eicosatrienoic (20:3n-6), eicosatetranoic (20:4n-6) and docosahexanoic (22:6n-3; Table 5), and 18:3n-3 in AT, PA, PI and RG breeds (Table 6). The increase in the slaughter weight did not have a significant effect on the percentage of MUFA (Table 5).
AT breed showed the lowest saturation level of IMF (P < 0.001), mainly due to the SFA 16:0, 18:0, 20:0 and 17:0 (Table 7). Animals of AT and RG breed displayed the lowest percentage of MUFA (P < 0.001). These differences were due to differences on MUFA palmitoleic (16:1n-7), 17:1n-7, 20:1n-9 and especially the major MUFA 18:1n-9 (Tables 6 and 7). The relationship among breeds regarding the percentage of PUFA was the opposite of that found for MUFA, due to the PUFA 18:3n-3; 20:2n-6; 20:3n-6; 20:4n-6; gamma linolenic (18:3n-6), and especially the major PUFA 18:2n-6 (Tables 6 and 7), that was higher in beef from AT and RG.
Discussion
Alberti et al. (Reference Alberti, Ripoll, Goyache, Lahoz, Olleta, Panea and Sañudo2005) found that there was an increase in carcass conformation, fatness and weight between veal and YB animals. The Spanish market demands young animals with high-muscled carcasses, a high percentage of lean and only a certain degree of fatness, because carcasses with a fatness score higher than two are price penalized (European Commission, 2008).
These results are in agreement with the results obtained in this study where AT and RG were leaner than the rest and especially the MO breed. In this sense, younger animals and AT breed showed the leanest beef and had the highest PL and C content and the lowest TG content. Eichhorn et al. (Reference Eichhorn, Coleman, Wakayama, Blomquist, Bailey and Jenkins1986) found that the TG/PL ratio reflects the fat/lean ratio because the phospholipid content in the muscle is relatively independent of the total fat content. PL content varies between 0.2% and 1% of muscle weight because they have a structural function and are mainly (60% to 80%) present in the membrane component of bovine muscle. However, the content of muscle TG is strongly related to the total fat content and varies from 0.2% to 5% because of their storing function (Eichhorn et al., Reference Eichhorn, Coleman, Wakayama, Blomquist, Bailey and Jenkins1986). C content is negatively related to the IMF content. As phospolipids, C is a membrane component of muscle and the relationship between PL and C seems to be necessary to maintain membrane fluidity in a narrow range (Alfaia et al., Reference Alfaia, Ribeiro, Lourenço, Quaresma, Martins, Portugal, Fontes, Bessa, Castro and Prates2006). In this study, C was also higher in AT and RG at both VT and YB commercial types.
In spite of the differences among breeds and slaughter weights, the order of abundance of the different lipid classes is similar to that described by Christie (Reference Christie1981) for IMF of beef. However, the results showed higher percentages of PL (14% v. 8%) and FFA (3.10% to 6.07% v. 1%), but lower percentages of C (8% v. 17%).
The fatty acid profile was similar to those found in cattle fed with concentrate and reported by Insausti et al. (Reference Insausti, Beriain, Alzueta, Carr and Purroy2004) and Indurain et al. (Reference Indurain, Beriain, Goñi, Arana and Purroy2006) in YB and Alfaia et al. (Reference Alfaia, Ribeiro, Lourenço, Quaresma, Martins, Portugal, Fontes, Bessa, Castro and Prates2006) in bulls slaughtered at 20 months. Typically, grain feeding has the effect of increasing the PUFA/SFA ratio (Webb and O’Neill, Reference Webb and O’Neill2008). However, the PUFA content reported by Wood et al. (Reference Wood, Enser, Fisher, Nute, Sheard, Richardson, Hughes and Whittington2008), and Webb and O’Neill (Reference Webb and O’Neill2008) in recent reviews was lower while the MUFA content was higher (45% and 46%, respectively). The opportunities for microbial biohydrogenation of unsaturated fatty acids in animals fed concentrate might be limited by small particle size and short rumen transit time, the presence of large amounts of 18:2n-6, and low ruminal pH (Partida et al., Reference Partida, Olleta, Sañudo, Alberti and Campo2007). These factors could explain the high PUFA content of the animals studied.
The predominant fatty acids in IMF from all types of beef and slaughter weights were 16:0, 18:0, 18:1n-9 and 18:2n-6 and accounted for over 80% of the intramuscular fatty acids, similar to those reported by other authors in animals fed diets based on barley and soyabean (Realini et al., Reference Realini, Duckett, Brito, Rizza and De Mattos2004; Alfaia et al., Reference Alfaia, Ribeiro, Lourenço, Quaresma, Martins, Portugal, Fontes, Bessa, Castro and Prates2006; Partida et al., Reference Partida, Olleta, Sañudo, Alberti and Campo2007).
The increase in SFA and MUFA percentages and the decrease in PUFA with increasing slaughter weight illustrate the increasing importance of neutral lipids in total lipids as fattening proceeds. PUFA are mainly stored in PL, and because they are membrane components, they are less likely to be used for energy production and their proportion is strictly controlled in order to maintain membrane properties (De Smet et al., Reference De Smet, Raes and Demeyer2004). The increase in the content of SFA was related not only to the fattening process but also to other physiological processes related to animal maturity. The increase in saturation, especially of 18:0 and 20:0 fatty acids, would be related to the acquisition of the total ruminal functionality by the YB, in comparison with veal animals, since the increase in the age at slaughter would result in the near complete saturation of unsaturated fatty acids in the diet (Wood et al., Reference Wood, Enser, Fisher, Nute, Sheard, Richardson, Hughes and Whittington2008). The increase in 16:0 with slaughter weight could be explained because the ruminal activity increases with increasing live weight leading to a more saturated fat. Besides, the higher the IMF percentage, the lower the transformation of C16:0 into C18:0 occurs due to the negative relationship between elongase enzyme activity and IMF content (Kazala et al., Reference Kazala, Lozeman, Mir, Laroche, Bailey and Weselake1999; Pitchford et al., Reference Pitchford, Deland, Siebert, Malau-Aduli and Bottema2002).
The content and evolution of MUFA is closely related to the percentage of the major MUFA 18:1n-9. This fatty acid is the final product of the Δ9 desaturase-elongase enzyme system, which transforms the SFA 14:0, 16:0 and 18:0 produced from ruminal hydrolysis and saturations into Δ9 monounsaturated acid 18:1n-9 (Malau-Aduli et al., Reference Malau-Aduli, Siebert, Bottema and Pitchford1997). Besides, desaturase gene expression in response to concentrate-rich diets has been reported (Alfaia et al., Reference Alfaia, Ribeiro, Lourenço, Quaresma, Martins, Portugal, Fontes, Bessa, Castro and Prates2006). Hence, the strategies that could increase Δ9 desaturase expression and activity could lead to enhancing MUFA accumulation in meat. Nevertheless, Vasta et al. (Reference Vasta, Priolo, Scerra, Hallett, Wood and Doran2009) suggested that in ruminants Δ9 desaturase does not play the key role in intramuscular fatty acid formation.
The lower content of PUFA in YB was related both to their higher fatness and to other physiological factors related to animal age, such as the acquisition of ruminal biohydrogenation capacity. The content of n-3 PUFA was very low because the diet contained a high proportion of barley and soyabean, rich in 18:2n-6, which is the precursor of the n-6 fatty acids. Wood et al. (Reference Wood, Enser, Fisher, Nute, Sheard, Richardson, Hughes and Whittington2008) reported that lipid fractions had a different PUFA profile, with 18:2n-6 and longer chain fatty acids being found mainly in muscle PL, whereas 18:3n-3 is stored both in PL and neutral lipids. This fact could explain that 18:2n-6 and longer fatty acids such as 20:3n-6 and 20:4n-6 were significantly affected by fatness while 18:3n-3 was not affected.
The fall in n-3 PUFA was higher (45%) than in n-6 PUFA (13%) with increasing slaughter weight, which could be due to the higher content in 18:2n-6 in the concentrate than in 18:3n-3, the higher efficiency of incorporation of 18:2n-6 into muscle compared to 18:3n-3 (Wood et al., Reference Wood, Enser, Fisher, Nute, Sheard, Richardson, Hughes and Whittington2008) and the reduced biohydrogenation in the rumen in the 18:2n-6-rich concentrate diets. According to Raes et al. (Reference Raes, Balcaen, Dirinck, De Winne, Clayes, Demeyer and De2003), differences between breeds in the fatty acid profile would be partly due to the differences in fatness and the content of different lipid classes. Thus, the low percentage of TG and the high content of PL in the leaner animals of AT and RG breeds would explain the low degree of saturation and monounsaturation and the high content in PUFA of these breeds. This is so because the contribution of PL to total fatty acids is proportionately greater when the fatty acid content is lower (Table 6; Jiang et al., Reference Jiang, Busboom, Nelson, O’Fallon, Ringkob, Joos and Piper2010). In Spanish breeds, Mendizabal et al. (Reference Mendizabal, Alberti, Eguinoa, Arana, Soret and Purroy1999) showed that the leaner carcasses of AT breed and the fatter carcasses of MO animals, compared to other Spanish breeds, were related to smaller and bigger adipocytes, respectively, in different fatty depots. Bigger adipocytes mean a higher proportion of storing lipid fractions such as TG, but lower structural lipid fractions such as PL and C. Although breed differences in the literature are often confounded by differences in fatness, several studies have found other factors that determine the fatty acid profile. For example, Oka et al. (Reference Oka, Iwaki, Dohgo, Ohtagaki, Noda, Shiozaki, Endoh and Ozaki2002) suggested that the Japanese Black has a genetic predisposition for producing lipids with high MUFA concentration than other breeds studied. Malau-Aduli et al. (Reference Malau-Aduli, Siebert, Bottema and Pitchford1997) and Alfaia et al. (Reference Alfaia, Ribeiro, Lourenço, Quaresma, Martins, Portugal, Fontes, Bessa, Castro and Prates2006) postulated that differences in MUFA levels reflect differences in Δ9 desaturase-elongase activity. Choi et al. (Reference Choi, Enser, Wood and Scollan2000) reported breed differences in n-3 PUFA in Welsh Black and Holstein Friesian animals that could not be attributed to differences in the fat level. In addition, Wood et al. (Reference Wood, Enser, Fisher, Nute, Sheard, Richardson, Hughes and Whittington2008) found differences in elongation and desaturation of 18:3n-3 between Holstein-Friesians and Aberdeen-Angus animals, probably because there is a higher activity of the enzymes that are involved in the elongation and desaturation to n-3 fatty acids compared to n-6 fatty acids.
In this study, the longissimus muscle showed a fat content <5% in all breeds and weights and may be considered a low-fat product (Food Advisory Committee, 1990). Besides, major SFA, 18:0 is considered a neutral fatty acid (Webb and O’Neill, Reference Webb and O’Neill2008). The major MUFA found was 18:1n-9, which has a positive impact against cardiovascular diseases (Kwiterovich, Reference Kwiterovich1997).
AT and RG breeds were unique, which achieved the minimum recommended for the PUFA/SFA index (0.45; United Kingdom Department of Health and Social Security, 1994). Raes et al. (Reference Raes, De Smet and Demeyer2004) suggested that the PUFA/SFA ratio is mainly influenced by genetics and much less by nutrition, although grain feeding has a desirable effect in increasing the PUFA/SFA ratio (Webb and O’Neill, Reference Webb and O’Neill2008). The PUFA/SFA ratio that showed all breeds in this study was higher than the characteristic fat from ruminants intensively fed with cereal-based diet reported by Scollan et al. (Reference Scollan, Hoquette, Nuernberg, Dannenberger, Richardson and Moloney2006) and Partida et al. (Reference Partida, Olleta, Sañudo, Alberti and Campo2007) (0.22 to 0.24).
A ratio of n-6/n-3 fatty acids in dietary fats lower than four is desirable for reducing the risk of many chronic diseases (Wolfram, Reference Wolfram2003). The ratio n-6/n-3, calculated in all breeds, showed a value higher than four, being higher in the YB than in the VT animals. Similar ratios were reported for beef of cattle fed concentrate by Alfaia et al. (Reference Alfaia, Ribeiro, Lourenço, Quaresma, Martins, Portugal, Fontes, Bessa, Castro and Prates2006), Indurain et al. (Reference Indurain, Beriain, Goñi, Arana and Purroy2006) and Partida et al. (Reference Partida, Olleta, Sañudo, Alberti and Campo2007) and it is characteristic of concentrate diets rich in 18:2n-6 (Scollan et al., Reference Scollan, Hoquette, Nuernberg, Dannenberger, Richardson and Moloney2006; Wood et al., Reference Wood, Enser, Fisher, Nute, Sheard, Richardson, Hughes and Whittington2008). A favourable n-6/n-3 ratio in IMF has been achieved by diets that include components such as fish oil/fish meal, linseed and/or forages, which are rich in n-3 fatty acid sources (Raes et al., Reference Raes, De Smet and Demeyer2004). Nevertheless, recent studies (McAfee et al., Reference McAfee, McSorley, Cuskelly, Moss, Wallace, Bonham and Fearon2010) suggest that there is a lack of evidence that lowering the n-6/n-3 ratio improves physiological function. Hence, focus should be moved away from the ratio to absolute amounts of n-3 and n-6 PUFA.
Acknowledgements
The authors wish to thank the Instituto Nacional de Investigación Agroalimentaria for funding this study (project INIA SC97-019), and Mr Pere Alberti (from the Centro de Investigación y Tecnología Agroalimentaria, DGA, Zaragoza, Spain) for supplying samples and for his collaboration.