Implications
In fish farming practices, the maximum utilization of rearing space for maximum fish production can improve the profitability of the fish farm. In aquaculture, as in any type of animal husbandry, it is preferable to produce a homogeneous animal size, as that would facilitate feeding, harvesting, marketing and processing. Social interaction, particularly intraspecific competition for feed, is the major contributor to the growth dispersion. Results demonstrate that the growth heterogeneity and inter-individual variation of feed intake are positively correlated with the stocking density.
This information will help fish farmers of tilapia to plan their husbandry practices to assure the production of more homogeneous fish size. In addition, on the basis of the economic study, optimal density corresponding to the highest profit was determined, which is crucial for planning of fish production in commercial scale.
Introduction
In fish farming practices, stocking density is considered to be one of the most important factors that affects fish growth, feed utilization and the gross fish yield through modifying feeding behaviour (Wocher et al., Reference Wocher, Harsányi and Shwarz2011), social interactions (Jobling et al., Reference Jobling, Alanärä, Noble, Sánchez-Vázquez, Kadri and Huntingford2012) and water quality (Ellis et al., Reference Ellis, North, Scott, Bromage, Porter and Gadd2002). The maximum utilization of rearing space (i.e. tank and/or cage) for maximum fish production through intensive rearing can improve and enhance the profitability of the fish farm. However, relatively high density results in stress and hampers welfare and health of the fish, which leads to increased energy requirements and depressed growth performance and feed utilization efficiency. Consequently, the determination of optimal stocking density to reach best growth is a prerequisite to optimizing production. Therefore, the effect of stocking density on growth performance has been reported for a range of cultured fish species such as rainbow trout Oncorhynchus mykiss (McKenzie et al., Reference McKenzie, Höglund, Dupont-Prinet, Larsen, Skov, Pedersen and Jokumsen2012), Atlantic cod Gadus morhua (Björnsson et al., Reference Björnsson, Steinarsson, Oddgeirsson and Ólafsdóttir2012), striped catfish Pangasianodon hypophthalmus (Slembrouck et al., Reference Slembrouck, Baras, Subagja, Hung and Legendre2009) and Atlantic salmon Salmo salar (Hosfeld et al., Reference Hosfeld, Hammer, Handeland, Fivelstad and Stefansson2009), etc. and the pattern of this interaction appears to be species specific. In tilapias, which are nowadays the second leading group of fish in aquaculture, experiments on the effect of stocking density have been conducted on fry (El-Sayed, Reference El-Sayed2002); however, information on the effects on older ages or larger sized groups is scarce. It has been demonstrated in some fish species that the effect of stocking density on performance changes with the age of the fish (Björnsson et al., Reference Björnsson, Steinarsson, Oddgeirsson and Ólafsdóttir2012). In addition, the multiplicity of the factors that influence growth and efficiency of feed intake (FI) make it difficult to transfer results between species or life stages and to select an optimum stocking density without experimental validation.
In aquaculture, as in any type of animal husbandry, it is preferable to reduce animal size variations to produce a homogeneous animal size as that would facilitate feeding (Azaza et al., Reference Azaza, Dhraïef, Kraïem and Baras2010a), harvesting, marketing and processing. As the majority of farmed fish, Nile tilapia Oreochromis niloticus L. reared in groups, exhibit a strong inter-individual growth rate, leading the farmers to grade their fish several times during the production cycle. This practice is time-consuming, costly and involves handling stress to the fish. However, limited attention has been directed towards the manipulation of biotic and abiotic factors (e.g. stocking density, feeding frequency, feed ration size, etc.) to improve growth homogeneity and minimize inter-individual variation of feed consumption in Nile tilapia (Azaza et al., Reference Azaza, Dhraïef, Kraïem and Baras2010a and Reference Azaza, Legendre, Kraïem and Baras2010b). Social interactions, particularly intraspecific competition for feed and genetic differences between individuals, are believed to be major contributors to the growth dispersion in fishes (Azaza et al., Reference Azaza, Dhraïef, Kraïem and Baras2010a). Nile tilapia is an aggressive and territorial species that is known to exercise marked dominance hierarchies when raised in groups (e.g. Fessehaye et al., Reference Fessehaye, Kabir, Bovenhuis and Komen2006). Stocking density has been shown to affect behavioural interactions in several fish species such as intraspecific competition (Martins et al., Reference Martins, Schrama and Verreth2005) and may influence the inter-individual variations of FI. This intraspecific competition and social hierarchy have been demonstrated on several occasions to be the driving factor behind growth heterogeneity (Campeas et al., Reference Campeas, Brun-Bellut, Baras, Kestemont and Gardeur2009). To the best of our knowledge, thus far, such an effect has not been reported previously among tilapias, which are one of the major contributors to world aquaculture nowadays (Food and Agriculture Organization of the United Nations – FAO-FishStatPlus, 2012). Therefore, the objective of this study was precisely to investigate this issue in juvenile monosex male Nile tilapia (15 g). In particular, it aimed at (1) determining the effects of stocking density on growth performance for the first step of on growing (15 to 100 g) under intensive conditions, and (2) assessing the effect of the stocking density on growth dispersion and inter-individual variation of FI through the establishment of social hierarchies.
Material and methods
Fish
The fish were Nile tilapia Maryut strain, from a captive population that originated from the Marine Centre of Tajoura (Lybia), and was transferred to the Aquaculture Research Station of the Tunisian National Institute of Marine Science and Technology at Bechima Gabès in 1999. The experiments were carried out from 13 September 2011 through 11 November 2011.
Experimental design
One week before the start of the experiment, fish were sexed by the examination of genital papilla so as to select male fish exclusively. A total of 6000 fish (14.9 ± 1.2 g, mean ± s.e.) were selected from a large group held in a 50 m3 tank intended for ongrowing. Fish were sedated with tricaine methanesulfonate (100 mg/l), weighed individually to produce groups in which mean masses and mass heterogeneity were as similar as possible. Thereafter, the groups of fish were randomly allocated to the different stocking density. Efforts were made to reduce as much as possible the initial size heterogeneity within groups (CV < 10%), and to minimize discrepancies among groups.
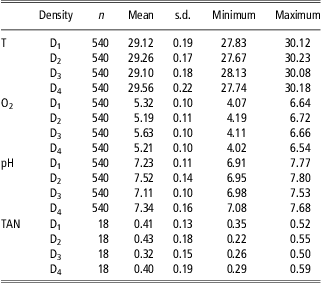
Triplicate groups of selected fish were dispatched in 12 indoor 1 m3-cubical flow-through fibreglass tanks at four stocking densities D1, D2, D3 and D4, corresponding to 200, 400, 600 and 800 fish/m3 and approximately to 3, 6, 9 and 12 kg/m3, respectively. Each tank was part of an open circulated system previously described by Azaza et al. (Reference Azaza, Mensi, Wassim, Abdelmouleh, Brini and Kraïem2009a and Reference Azaza, Wassim, Mensi, Abdelmouleh, Brini and Kraïem2009b). The tanks were supplied with water coming from the geothermal source after undergoing cooling in a large tank of storage located at the upstream of the experimental system. In all 12 tanks, water was constantly replaced by continuous flow at a rate of 3 to 6 l/min per tank. The water flow was regularly adjusted according to fish density to ensure high and similar water quality at all densities (Table 1). In all rearing tanks, oxygen level was maintained above 4 mg/l. Supplemental aeration was provided by individual air stones when necessary.
Water-quality parameters: temperature (T, °C), dissolved oxygen (mg/l), pH and total ammonia-N (TAN, mg/l) in rearing tanks at different stocking densities (D1, D2, D3 and D4)
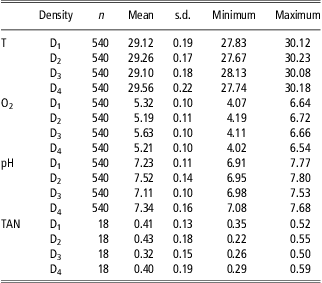
The table shows the number of measurements (n), mean, standard deviation (s.d.), and lowest and highest values.
Every 15 days, a sample of 10% of the initial number of fish from each tank was haphazardly captured with a dipnet. Before sampling, the fish were concentrated in the tank by lowering the water depth. The sampled fish were sedated with 100 mg/l tricaine methanesulfonate, individually weighed nearest 0.01 g and returned to their tank. On the weighing days, feed distribution was suspended during the morning and resumed in the early afternoon, at least 3 h after the last fish were measured, in order to enable that all fish to recover from handling stress and to minimize the effects of handling on FI. Tanks were searched for dead fish twice a day, before and after the period of feed distribution. Dead fish were weighed for adjusting the feed ration and calculating the feed conversion efficiency. For water quality monitoring, water temperature, dissolved oxygen and pH levels in each tank were controlled and monitored continuously (every hour) with a digital thermo-oxymeter surveillance system (WTW, MIQ/C184, accuracy of 0.1°C and 0.1 mg O2/l; www.memecosales.com). Total ammonium and nitrite were measured twice weekly by standard methods (American Public Health Association, 1995). Water temperature was maintained at 29 ± 1°C. No critical values were detected for dissolved oxygen (>4.02 mg/l; Tran-Duy et al., Reference Tran-Duy, Schrama, Van Dam and Verreth2008). Nitrite (NO2-N: <0.01 mg/l) and total ammonia-N (NH3-N + NH4+-N: <0.43 mg/l) remained within acceptable ranges for Nile tilapia (Ross, Reference Ross2000). Day length was maintained at 12L : 12D, with fluorescent lights on from 0800 to 2000 h, which were controlled by an automatic timer (Time switch, CHNT, Tb-38; www.flgroup.com.my). Light intensity of 1000 Lx at the surface of the water was recorded during the hours of light (Digital Instrument LX-101; www.Instrumentchoice. com.au).
The practical feed used in this study (30% CP, 15.5 kJ/g) had previously been demonstrated to support good growth performance in Nile tilapia (Azaza et al., Reference Azaza, Mensi, Abdelmouleh and Kraïem2005). It consisted of powdered fish meal, soya bean meal, maize meal, soya bean oil, vitamin and mineral premixes, and carboxymethylcellulose as binder. Before its use in the diets, soya bean meal was autoclaved at 110°C for 30 min according to Azaza et al. (Reference Azaza, Kammoun, Abdelmouleh and Kraïem2009c). The test diets were prepared as described by Azaza et al. (Reference Azaza, Mensi, Wassim, Abdelmouleh, Brini and Kraïem2009a and Reference Azaza, Wassim, Mensi, Abdelmouleh, Brini and Kraïem2009b). The diameter of pressed pellets was 2.5 to 3.0 mm. To minimize lipid oxidation during storage, all diets were packaged in sealed plastic bags and stored in a freezer at −20°C until their use. Before feeding, the dried diets were crushed and graded to yield suitable particle sizes according to fish size throughout the experiment, as suggested by the developed mathematical model by Azaza et al. (Reference Azaza, Dhraïef, Kraïem and Baras2010a).
During the 60-day experimental period, fish were hand fed until apparent satiation, three times a day at 0800, 1200 and 1700 h. Fish are considered to be satiated when they no longer accept the offered feed after a period of active feeding. In each meal, pellets were consumed during almost 10 min and were distributed slowly over the entire water surface, allowing all fish to eat without feed wastage. Therefore, the amount of wasted feed was always very small or negligible on all rearing days, and thus feed rations represent FI. Daily rations were offered at 5% of body mass until day 30. From day 31 onwards, the daily ration was reduced to 2.5% body mass. Amounts of feed were incremented every day, partly on the basis of growth estimates of fish fed optimal ration at 29°C (M.S. Azaza unpublished data), partly from the observation of the amount of the uneaten feed at the end of each feeding period. Uneaten feed, if any, was removed by siphoning ∼15 min after the end of feed distribution, dried to a constant weight, always with the objective of adjusting feed ration, ensure accurate determination of FI and preventing any degradation of water quality that might have interfered with the genuine effect of stocking density. Faecal matter was removed before each morning feeding.
Heterogeneity of FI
The effect of the stocking density on the variation of the inter-individual of FI within tanks was assessed by examining the range of meal sizes consumed by the individual fish by the radiographic method of Talbot and Higgins (Reference Talbot and Higgins1983). For the radiographic study, feed composition and particle sizes were similar to the growth trial, except that X-ray-dense lead glass beads (ballotini, type H, 450-600 μm diameter, DLO, Braine-L'Alleud, Belgium) were mixed (1.5%, M/M) with the ingredients before compressing them into pellets. The inter-individual feed consumption during a meal was measured on days 10, 25 and 55. At these days, in the first meal, fish in all tanks were hand fed to satiation with ballotini-marked feed instead of the ordinary feed. Thereafter, 10% of the initial stock of each tank were randomly sampled with the agitation protocol as indicated above, anaesthetized (methanesulfonate tricaine, 200 mg/l), placed in lateral recumbence and X-rayed, using a Eklin Mark III™ portable digital radiography system (IDR, Vouziers, France) and Kodak Ma film (Kodak, X-OMAT MA, TX, USA). Following the development of the X-ray plates, two independent observers counted the number of radio-opaque beads in the gastrointestinal tract of each sampled fish. Counting of glass bead is facilitated by viewing plates on a light box. The stomach contents were calculated following the relationship between the feed mass (FM, g) and number of ballotini (Nb), that is, FM (g) = 0.0131 Nb + 0.0066; (r 2 = 0.989; n = 30; P < 0.001). This relation was calibrated from 30 samples of known weights from 0.05 to 1.0 g that were X-rayed to determine the relationship between the amount of feed and the Nb. This enabled the amount of feed in the gastrointestinal tracts of fish to be back-calculated from X-ray plates.
Economic analysis
The optimal final stocking density of juvenile Nile tilapia was estimated with a simple economic analysis, according to Björnsson et al. (Reference Björnsson, Steinarsson, Oddgeirsson and Ólafsdóttir2012). The results of the production and the quantity of FI were used to calculate the production costs and profits at different final densities at the end of the experiment using the following assumptions:
(1) Rearing carried out in a 4000 m2 indoor facility with a total rearing volume of 1220 m3 in a flow-through system with freshwater originated from deep aquifer via an artesian well (temperature of 28°C to 30°C).
(2) Total capital cost of the rearing station, including building, tanks and other necessary equipment 100 000 Tunisian Dinars (TD). Tunisian pounds; 1€ = 2.0 TD, based on 2013 exchange prices.
(3) A 20-year loan obtained for 80% of the capital cost (20% self-financing) with 8.33% interests.
(4) Average annual payment of the loan 8 201 520TD/year, that is, the sum of capital and interests (80 000 000 TD + 84 030 400 TD)/20 years.
(5) The rearing station depreciated in 20 years, that is, 5000 TD/year.
(6) Maintenance and replacement of equipment 2000 TD/year.
(7) Wages of three employees 25 000 000 TD/year.
(8) Total fixed cost 40 201 520 TD/year (i.e. ∑ (4), (5), (6) and (7)).
(9) Results were based on parameters of 15 g juveniles purchased and reared for 2 months until 100 g.
(10) Purchasing price of a 15 g juvenile 0.095 TD.
(11) Selling price of a 100 g juvenile 0.400 TD (4.00 TD/kg).
(12) Price of dry feed 0.800 TD/kg cost of feed to produce 1 kg of fish was determined by multiplying the cost of kg of feed by the feed conversion ratio (FCR) in each density.
(13) All variable costs other than that of juveniles and feed 0.005 TD/purchased juvenile (i.e. cost of electricity, etc.).
(14) All running costs covered with own capital.
In the calculations, the annual profit (P) is defined as revenues (R) from sales of juveniles minus fixed (C f) and variable cost (C v) on an annual basis P = R – (C f + C v).
The calculated annual profits (P) for the different final densities (D) were fitted with a second-order polynomial (P = a + bD + cD 2), thus giving the optimal final density at D opt = –b/2c where maximum profit (P max) is obtained.
Calculations and statistical analyses
In all experiments, fish growth was expressed as the specific growth rate (SGR, %M/day), which was calculated as: SGR = 100 (ln FBM – ln IBM)/(Δt), where ln is loge, and final body mass (FBM) and IBM are the mean final and initial body masses of fish at the start and end of the experiment, respectively, and Δt is the duration of the experiment. The FCR was calculated as: FCR = TFI/(B f − B i + B d), where B i and B f are the total body masses (g) of fish at the start and end of the experiment, B d is the body mass of fish dying throughout the experimental period and TFI (g) is the total amount of feed distributed during the rearing period. The variation of mass heterogeneity during the study was measured by the change in the coefficients of variation (ΔCV) of fish body mass, that is, ΔCV = CV2 − CV1, where CV1 and CV2 are the initial and final coefficients of variation of fish body mass (M), which were calculated as CV = 100 s.d./M, where s.d. is the standard deviation of mean body mass (M). The asymmetry of the mass distributions at different density treatments was characterized by their skewness coefficients (Sk), that is, Sk = ∑1 −n [(xi − M)/s.d.]3, where M and s.d. stand as above. Productivity was calculated as following: Pr (kg/m3 per day) = (B f − B i)/Δt. Survival rate was calculated as: SR (%) = 100 N f/N i, where N f and N i are the number of fish at the end and at the start of the experiment.
All data were analysed for normal distribution by Shipiro–Wilk tests and for homogeneity of variances by Barlett's test (Ott and Longnecker, Reference Ott and Longnecker2001). Data that were normal and homogeneous were analysed by one-way ANOVA using the GLM of Statistica® Version 5.1 (Statsoft, Tulsa, OK, USA). Factorial two-way ANOVA, which included time, stocking density and their interactions, was used to compare CVs. Tank mean values were considered as observation units. When the ANOVA identified differences among groups, post-hoc comparison among means were tested using Duncan's multiple-range tests at the 5% (P < 0.05) level. Differences between the coefficients of variation of FI and CVFI were analysed by single-factor ANCOVA with FBM as the covariate. The root mean square error analysis of groups was performed to measure the degree to which the values could be estimated accurately. Non-homogeneous data were transformed to effect homogeneity. If transformed data were also not normally distributed and the assumptions of an ANOVA were not met, Kruskal–Wallis and Mann–Whitney U-tests were used wherever parametric analyses could not be applied (between-treatment comparisons of coefficient of variation of wet mass, Sk, minimum and maximum quantity of ingested feed within each group of fish). Normally distributed data that exhibited a lack of variance homogeneity were analysed using the modified t-test (Welch) for unequal variances (Ott and Longnecker, Reference Ott and Longnecker2001).
Results
Fish mass at the start of the experiment did not differ significantly between groups (mean IBM of 14.9 to 15.6 g; ANOVA, P > 0.05, d.f. = 11), nor did the coefficient of variation of the distributions of wet mass (CV IBM of 7.79% to 9.29%, Kruskal–Wallis test, H = 0.48, P > 0.05, d.f. = 11) and the Sk (from −0.79 to +0.28; Kruskal–Wallis test, H = 2.96, P > 0.05, d.f. = 11).
Survival, growth performance and feed efficiency
At the end of the experiment, there was a significant difference in mean mass between the highest and lowest stocking density (Figure 1).
Mean mass (g) over the experimental period of juvenile monosex male Nile tilapia reared at different stocking densities (D1, D2, D3 and D4) during the 60-day study. Whiskers indicate ± s.d. of three replicate groups.

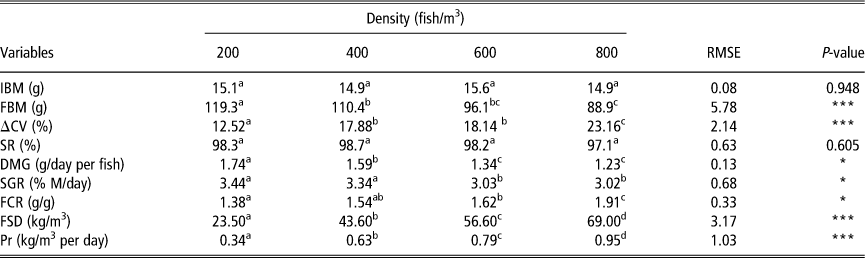
Stocking density affected survival, growth performance and feed utilization efficiency (Table 2).
Effects of different stocking density on mean FBM (g), SR (%), SGR (%M/day), DMG per fish (g/day), FCR (g/g), CV of masses CV (%), FSD (kg/m3) and Pr (kg/m3 per day) of Nile tilapia during the trial period
IBM = initial body mass; FBM = final body mass; SGR = specific growth rate; DMG = daily mass gain; FCR = feed conversion ratio; CV = co-efficient of variation; FSD = final stocking densities; Pr = productivity; RMSE = root mean square error.
a,b,c,dMeans in the same row followed by different superscript letter are significantly different.
*P < 0.05 and ***P < 0.001.
Fish survival was good among all groups, ranging from 97.1% to 98.7% among treatments, and did not differ significantly (ANOVA, P > 0.05, d.f. = 11). In all groups, fish were vigorous and no external clinical symptoms were observed in any treatment. The occurred mortality was held during the 2nd week and largely caused by injuries because of aggressive behaviour, except for fish that jumped out of the tank. The stocking density affected significantly (ANOVA, P < 0.05, d.f. = 11) the mean FBM and SGR, which ranged from 88.9 to 119.3 g and from 3.02% to 3.44%/day, respectively (Table 2). These parameters (i.e. FBM and SGR) decreased with increasing stocking density. The fish in D1 treatment showed the highest gain in mass (ANOVA, P < 0.05, d.f. = 11) compared with the D2, D3 and D4 treatments. The latter treatment (D4) displayed a significantly lower SGR and FBM than other treatments. No significant differences were found among groups reared at D2 and D3 (ANOVA, P > 0.05, d.f. = 11). FCRs ranged from 1.38 to 1.91 from low to high densities. No significant differences were found between D2 and D3 treatment groups. However, batches reared at high stocking density (D4) displayed a significantly (ANOVA, P < 0.05, d.f. = 11) higher FCR compared with the other stocking density treatments. Results show that tank productivity (kg/m3 per day) was positively correlated (Spearman rank correlation, rs = 0.998; n = 12, P < 0.001) with stocking density (Table 2), although the fact that growth performance was negatively correlated with increased density.
Size heterogeneity and symmetry distribution
Increasing CVs of body masses were observed at all treatments as the growth trial progressed (Figure 2). CVs were significantly affected by time (P < 0.001), stocking density (P < 0.001) and their interaction (P < 0.05). In fact, results suggest that increasing stocking density results in higher variation in individual growth. Statistically significant differences in CVs were recorded on the 30th day of rearing period. On the last day of the experiment, the statistically highest CV was recorded for the groups from the highest stocking density (D4), where they reached an average of 29.4%. At the start of the trial, Sk were approximately near zero (−0.20 to +0.15), indicating that the distribution was almost symmetric in all treatment groups. During the experimental period, Sk in groups that were reared at high density (D3 and D4) increased, mostly during the first and second rearing weeks and remained high thereafter (Figure 3). At the end of the growth trial, Sk of groups reared at high density (D3 and D4) were positive and significantly higher (Kruskal–Wallis test, H = 0.79, P > 0.05, d.f. = 11) than other treatments, indicating that the mass distributions are skewed right, and thus the right tail is long relative to the left tail.
The CV for fish masses (%) on days 0, 15, 30, 45 and 60 (noted A, B, C, D and E, respectively) for each stocking density of juvenile Nile tilapia. Bars and whiskers are the means and s.e. (standard error of the mean) of three replicates.
Variations of the skewness coefficient of fish masses (Sk) over 15, 30, 45 and 60 days (noted A, B, C, D and E, respectively) in Nile tilapia depending on the stocking density. In each graph, bars and whiskers are the means and s.e. of three replicates.
Inter-individual variation of FI
Stocking density seemed to affect the inter-individual variation in feed consumption (Figure 4).
Inter-individual variations of feed intake during a meal in juvenile Nile tilapia, depending on the stocking density on days 10 (a), 25 (b) and 55 (c). In each graph, the closed circles and open bars stand for the mean of feed intake in each group (MFI) ± 1 standard deviation, whereas the whiskers indicate the smallest and largest quantity of individual ingested feed in each group (g). For each stocking density (i.e. D1, D2, D3 and D4), the three graphs represent the triplicate groups.
In each of the three sampling days, that is, days 10, 25 and 55, the mean feed intake (MFI, g) that was measured 15 min after feed distribution were similar (ANCOVA, d.f. = 596; P > 0.05) for the different stocking density (Figure 4). In each sampling period, the standard deviation of measures of FI varied conspicuously between stocking density, thereby indicating a proportionally higher variability of individual FI in groups reared at high stocking density (D3 and D4) compared with the relatively low stocking density (D1 and D2). This was particularly evident towards the end of the growth trial (Figure 4C). Kruskal–Wallis tests revealed significant (Kruskal–Wallis test, d.f. = 11; P < 0.05) treatment effect of the stocking density on the individual lowest quantity of ingested feed (Lq) and the individual highest quantity of ingested feed (Hq) within each group.
Economic analysis
The production cost per juvenile was highest for the low density group (0.38 TD/juvenile) and lowest for the high density group (0.25 TD/juvenile; Figure 5). The fixed cost decreases rapidly from low to high density, with 0.16 to 0.04 TD/juvenile at a final density of 23.5 and 69.0 kg/m3, respectively. However, insignificant effect of the stocking density on the variable cost and other cost was observed (Figure 5): juvenile cost from 0.096 to 0.097 TD/juvenile, feed cost from 0.113 to 0.108 at low and high density, respectively.
Production cost per juvenile at four final densities in a land-based farm. Fixed cost, juvenile cost, feed cost and other variable costs are shown.
Profit values increase sharply with density at first but then slightly until a maximum is reached at optimal final density (D opt; Figure 6). Beyond the value of final D opt, increase in stocking density decreases the profit. For the given baseline assumptions, the maximum profit is reached at a final density of 73.7 kg/m3.
Profit in a land-based juvenile Nile tilapia farm as a function of final density with baseline assumptions about fixed cost, price of 15 and 100 g juveniles, feed cost and other variable costs (see Table 3).
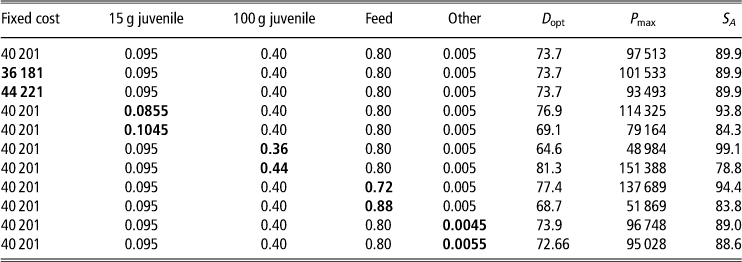
A sensitivity analysis (±10% deviation from each assumption) shows that changes in the fixed cost such as financial costs and salaries do not affect the optimal final density (Table 3). However, small changes in variable costs, such as feed and juvenile costs, directly affect the optimal final density. Indeed, for example, if the price of 15 g juveniles is reduced from 0.095 to 0.0855 TD from the baseline assumptions, the optimal density increases from 73.7 to 77 kg/m3; if the sales price of 100 g juveniles is reduced from 0.40 to 0.36 TD, the optimal final density decreases to 64.6 kg/m3; if the feed cost is lowered from 0.80 to 0.72 TD/kg, the optimal final density increases to 77.4 kg/m3 (Table 3).
Economic study of rearing juvenile Nile tilapia from 15 to 100 g in a land-based farm with a rearing volume of 1220 m3
The optimal final stocking density (D opt kg/m3), maximum profit (P max thousand TD/year) and annual sales (SA tons/year) of juvenile Nile tilapia according to different assumptions about fixed rearing cost (thousand TD/year), price of 15 g juveniles bought and 100 g juveniles sold (TD/fish), price of feed (TD/kg) and other variable costs (TD/purchased fish).
On the basis of measurements of growth performance, survival rates and feed conversion ratio in a rearing experiment with densities increasing from 3 to 23.5, 6 to 43.6, 9 to 56.6 and 12 to 69 kg/m3.
The first line of the table shows the baseline assumptions and the subsequent lines show ±10% deviation from each assumption (numbers in bold).
Discussion
To the best of our knowledge, this study was the first to investigate the effects of stocking density in the inter-individual variation of FI in monosex male Nile tilapia reared in groups during the phase of ongrowing. In all tanks, we rarely observed the presence of small amounts of wasted feed at the end of all rearing days, which indicated that fish had indeed been fed at an optimum ration level throughout. The concentrations of nitrogenous compounds remained low, according to the recommendations for rearing Nile tilapia (Karasu Benli et al., Reference Karasu Benli, Köksal and Özkul2008). Furthermore, the measurements of these nitrogenous compounds were taken on a bimonthly basis, before the tanks were thoroughly scrubbed, and thus they gave a pessimistic view of the actual water quality during the rearing period. On all rearing days, the oxygen levels were close to saturation, and they never dropped to values that were found to affect FI or feed conversion of Nile tilapia (40% to 50% saturation; Tran-Duy et al., Reference Tran-Duy, Schrama, Van Dam and Verreth2008). Altogether, these observations support the idea that the results documented in this study reflected the intrinsic effects of stocking density on the growth of Nile tilapia, rather than discrepancies between experimental tanks, or side effects resulting from treatment-dependent alterations or difference of water quality.
The importance of stocking density on growth performance of fish has been reported for several species. Both positive and negative effects on growth performance have been reported and the pattern of this relationship appears to be species specific. In the present study, a negative effect of stocking density on fish growth and feed efficiency was observed, despite maintaining satisfactory and almost comparable water quality in all treatment groups. These results are in broad agreement with those of other studies such as rainbow trout (McKenzie et al., Reference McKenzie, Höglund, Dupont-Prinet, Larsen, Skov, Pedersen and Jokumsen2012), striped catfish (Slembrouck et al., Reference Slembrouck, Baras, Subagja, Hung and Legendre2009), etc. Contrariwise, in some cases, a negative effect of density was observed in the lowest density as compared with relative high stocking density, such as in goldfish Carassius auratus (Rema and Gouveia, Reference Rema and Gouveia2005) and Arctic charr Salvelinus alpinus (Jørgensen et al., Reference Jørgensen, Christiansen and Jobling1993). In uncommon cases, independence between growth performance and stocking density was reported such as in juvenile Senegalese sole Solea senegalensis (Costas et al., Reference Costas, Aragao, Mancera, Dinis and Conceiçao2008) in adult burbot Lota lota (Wocher et al., Reference Wocher, Harsányi and Shwarz2011).
On the other hand, results show that increasing stocking density is associated with the decrease in feeding efficiency. This observation corroborates with results obtained in other species such as Atlantic cod (Björnsson et al., Reference Björnsson, Steinarsson, Oddgeirsson and Ólafsdóttir2012) and California halibut Paralichthys californicus (Merino et al., Reference Merino, Piedrahita and Conklin2007), which could be explained by higher metabolism at high densities compared with relative low densities. On the other hand, lower growth performance and feed efficiency could also be explained by greater feed loss, as at higher stocking densities the residence time of water in the tank decreases, which leads to more pellets being flushed out of the tank before fish are able to catch it (Björnsson et al., Reference Björnsson, Steinarsson, Oddgeirsson and Ólafsdóttir2012). Thus, actual lower food intake at high density contributes to reduced growth performance and enhanced FCRs. In addition, at the lowest density, the uneaten feed pellets (if any) could be seen on the bottom of the tank and sometimes the fish were seen picking them up from the bottom between meals. However, at the highest density, it was impossible to ensure that uneaten feed pellets were picked up from the bottom because feed pellets spent less time on the bottom because of increased rate of flushing of water down the drain (Björnsson et al., Reference Björnsson, Steinarsson, Oddgeirsson and Ólafsdóttir2012).
In our study, as biomass increased from day to day, because of the growth of the fish, the negative density-dependent effect observed at high densities (D3 and D4v. D1 and D2) became more noticeable when biomass reached 40 to 45 kg/m3. In consequence, it could be assumed that this might result from the confinement of crowded fish that may have directly affected their physiological status and progressively became stressful to the fish (Lupatsch et al., Reference Lupatsch, Santos, Schrama and Verreth2010). Undoubtedly, this physiological stress has an energetic cost, which may contribute to the poorer growth, as reported in burbot (Wocher et al., Reference Wocher, Harsányi and Shwarz2011). Nevertheless, stress parameters were not measured in this study, and therefore we cannot claim that fish exposed to higher stocking density were more stressed than others.
In a previous part of the discussion, we debated how and why high stocking density could have a negative impact on fish growth and feed conversion efficiency. The observation that crowding tend to enhance mass heterogeneity (Figure 2) suggests an additional mechanism, which can be summarized as follows: it seemed that the negative effect of stocking density on growth performance may be due to the establishment of social interactions during crowding, especially during feeding. Visually, we can easily recognize these interactions and competitions. In fact, at feeding times, we observed that at high densities (D3 and D4 treatments) dominant fish were the first ones to react towards the feed. Initially, they fed near the water surface and ate their meal faster than the other fish. Valente et al. (Reference Valente, Saglio, Cunha and Fauconneau2001) and Martins et al. (Reference Martins, Schrama and Verreth2005) demonstrated that fast eaters are the fast growers, respectively, in rainbow trout and African catfish Clarias gariepinus.
Dominance hierarchies often re-establish soon after the fish have been rearranged into groups, especially when fish are homogenous in size (Azaza et al., Reference Azaza, Dhraïef, Kraïem and Baras2010a), as was the case in this study (CV Mi < 9%). This social interaction led to enhanced size dispersion via the reduction in growth of subordinate individuals relative to the larger conspecifics (e.g. Martins et al., Reference Martins, Schrama and Verreth2005), thereby resulting in an overall slower growth rate, and thus decreased fish production as observed in our study. As shown in the results, the establishment of social hierarchies was attested by the progressive increases of the CVs of masses, heterogeneous FI and also by the positive Sk coefficients when stocking density was increased (Figures 2, 3 and 4). All three characteristics were patently observed at the end of the first half of the experiment.
The measurement of individual FI within groups is essential to understand the factors causing individual variation in growth (Azaza et al., Reference Azaza, Dhraïef, Kraïem and Baras2010a). Yet, limited information is available in the scientific literature on the subject. This dearth of data on FI at the level of individual organism is strongly related to the methodological problems of how to measure individual feed consumption of animals reared communally and the difficulty in measuring it. It necessitates sophisticated, accurate and expensive techniques. Radiographic studies demonstrate that increasing stocking density is accompanied by increasing inter-individual variation of FI (Figure 4), and thus by growth heterogeneity. This is supported by Carter et al. (Reference Carter, Houlihan, McCarthy and Brafield1992) who found that the inter-individual variation in FI explained 89% of the variation in growth rates of Grass carp Ctenopharyngodon idella reared in groups.
In the present study, despite feed rations being adapted and adjusted to fish biomass in each group, theoretically each fish had the same amount of feed throughout the experiment, and depressed growth and enhanced heterogeneity of FI at high densities could be caused by reduced access to feed through competition. In addition, subsurface light intensity decreases with increasing fish density, which may impair visual feeding and result in an overall reduction of FI (Jobling et al., Reference Jobling, Alanärä, Noble, Sánchez-Vázquez, Kadri and Huntingford2012). This causes the disparity in feed acquisition among individuals to be more pronounced, which may explain why inter-individual variation of FI was more important at the high stocking density treatments, especially D4 treatment. Dominant fish, compared with subordinates, are characterized by their ability to acquire superior rank in a population, which would allow them to monopolize a disproportionate share of the meal, resulting in faster growth of these fish, bigger size and therefore greater dominance. On the opposite side, dominated fish being ranked low in the hierarchy may experience stress, reduced appetite, higher metabolic costs and reduced feeding opportunities (Hosfeld et al., Reference Hosfeld, Hammer, Handeland, Fivelstad and Stefansson2009). In each treatment of the present study, the standard deviation of the mean of the FI increased during the experiment (Figure 4), indicating that individual FI differences became more pronounced with time, suggesting that heightened levels of interaction and competition among fish were accentuated with time and were likely the principal factor behind these variations.
On the other hand, in our study, the experimental design of the feeding schedule is just three meals per daylight, that is, at four hourly intervals. It has been shown that feeding intervals are strongly correlated with hunger and return of appetite (Riche et al., Reference Riche, Haley, Oetker, Garbrecht and Garling2004). Low feeding frequency may lead to increased hunger, intraspecific competition and inter-individual FI (Damsgård and Huntingford, Reference Damsgård and Huntingford2012). When feed availability and accessibility are reduced, the agonistic behaviour tends to increase and feed monopolization tends to be more intense, which may result in disproportional feed acquisition, considerable variation in feed consumption and this ultimately gives rise to differential growth. Whenever competition between individuals is strong, an increase in energy consumption may occur and this potentially decreases feed conversion efficiency and increase inter-individual variation of FI during a meal.
The economic study shows that optimal final density was 73.7 kg/m3. On the other hand, results demonstrate that changes in fixed costs amend the profitability of the farm but do not affect the optimal density; contrariwise, the variable costs affect the optimal density. In fact, the fluctuation (±10%) of the price of small juveniles purchased and the price of large juveniles sold can have significant effects on the optimal density (±3 to 8 kg/m3). However, the same fluctuation (±10%) in feed cost and other variable costs have fewer effects on the optimal density. These results clearly show that in order to improve and enhance the profitability of the fish farm, the prices of purchasing small juveniles and the selling of large juveniles must be considered for planning the final stocking density in the farm before each rearing operation.
Although through this study we demonstrate that the pronounced individual differences in the growth of fish are mainly attributed to individual differences in FI, we cannot exclude other factors or mechanisms that affect growth heterogeneity. It is possible that not all fish tolerate stressful crowding conditions equally well. Also differences in inter-individual feed efficiency could play a role in explaining individual differences in growth as demonstrated by Qian et al. (Reference Qian, Cui, Xie, Lei, Xiong and Yang2002) in juvenile Chinese sturgeon Acipenser sinensis and Martins et al. (Reference Martins, Schrama and Verreth2005) in African catfish. These hypotheses remain to be tested experimentally and any formal test of these assumptions would require the study of individual growth trajectories, and thus individually tagged fish or individually housed fish.
Similarly, further research is needed to determine optimal stocking densities in Nile tilapia, especially in relation to other factors influencing the social hierarchies and inter-individual variation of FI related to the feeding schedule (e.g. feed ration, feeding frequency, way of feed distribution, etc.) to maintain sufficient feed supply and adequate access to feeding to reduce the social interactions among group-housed fish. These issues are poorly understood in Nile tilapia and more advanced knowledge is required when they are cultured under commercial stocking densities.
Acknowledgements
The assistance of Mr K. Elebdelli and A. Jedi for their most efficient technical assistance throughout the study is gratefully acknowledged.