





Introduction
Agricultural gaseous ammonia (NH3) emissions are an environmental concern due to their impacts on air quality, human health and ecosystems (Sutton et al., Reference Sutton, Oenema, Erisman, Leip, van Grinsven and Winiwarter2011; Wyer et al., Reference Wyer, Kelleghan, Blanes-Vidal, Schauberger and Curran2022). Ammonia is an irritant gas that can compromise human and animal health at high concentrations. Safe Work Australia (2024) has established exposure standards to NH3 of 25 ppm time-weighted average (8-hour workday, 5 days per week), and 35 ppm short-term exposure limit (15 min) for humans (Safe Work Australia, 2024); which also applies for livestock during transport (Costa et al., Reference Costa, Accioly and Cake2003).
In intensive livestock housing systems, manure on the pen surface is not homogeneous in composition. Cattle disturb and mix urine and faeces when housed intensively, but the distribution of urine across the manure within each pens varies considerably depending on animal behaviour and urination patterns (Lee et al., Reference Lee, Auvermann, Tedeschi, Koziel, Brandani, Gouvêa, Smith and Casey2025). This spatial variation results in heterogeneous urea concentrations and urease activity across different areas of the manure pad. Consequently, NH3 production rates may vary substantially within the same housing system, with hotspots of high emission occurring in areas receiving greater urine deposition and therefore greater local urea loading of the manure surface (Laubach et al., Reference Laubach, Taghizadeh-Toosi, Gibbs, Sherlock, Kelliher and Grover2013). Understanding these variations is essential for accurately predicting NH3 emissions and developing effective mitigation strategies in intensive cattle systems.
When urinary urea (CO(NH2)2) encounters the enzyme microbial urease in the faeces, it hydrolyses to form carbonic acid (H2CO3) and volatile NH3 (Equation (1); Dai and Karring, Reference Dai and Karring2014; Liu et al., Reference Liu, Liu, Murphy and Maghirang2017). Ammonia (NH3) volatilisation from manure (faeces and urine) results from nitrogen (N) loss, primarily as urinary urea-N(CO(NH2)2). Urea accounts for 69 % of urinary N in dairy cow urine and 83 % in sheep urine, with total N ranging from 3.0 to 13.7 g N/L (Bristow et al., Reference Bristow, Whitehead and Cockburn1992).
As urease is one of the most efficient known enzymes, the enzymatic hydrolysis of urea has a half-life of just 20 ms at 25 °C (Dai and Karring, Reference Dai and Karring2014; Equation (1)).
 $${\rm CO}\left({\rm NH}_{2}\right)_{2}\,+\,2{\rm H}_{2}{\rm O} \mathop{\longrightarrow}\limits^{{\rm \ urease\ }}{\rm H}_{2}{\rm CO}_{3}+2{\rm NH}_{3}$$
The hydrolysis process can be described as a series of subsequent reactions. In aqueous solutions, such as cattle manure, the reaction is often represented as the formation of NH3 and CO2 (Equation (2)). The CO2 dissolves in water to form carbonic acid (H2CO3) (Equation (3)), which then dissociates into bicarbonate and protons (Equation (4)) (Equations (2)–(4); Ni, Reference Ni1999). The NH3 reacts with water and is in equilibrium with ammonium ions (NH4 +; Equation (5); Huang and Shang, Reference Huang, Shang, Wang, Hung and Shamma2006). The reactions establish equilibria between NH3/NH4 + and HCO3 −/H2CO3, that are pH dependent. For Equation (5), alkaline conditions favour NH3 that can volatilize (Aguado et al., Reference Aguado, Noriega-Hevia, Ferrer, Seco and Serralta2022), whereas under acidic conditions NH4 + is favoured. The reaction in Equation (3) occurs readily, but at higher pH carbonic acid dissociates rapidly into bicarbonate (Equation (4)), whereas under acidic conditions more carbonic acid remains undissociated.
 $${\rm CO}\left({\rm NH}_{2}\right)_{2}\,+\,{\rm H}_{2}{\rm O}\mathop{\longrightarrow}\limits^{{\rm \ urease\ }} 2{\rm NH}_{3}+{\rm CO}_{2}$$
 $${\rm CO}_{2}+{\rm H}_{2}{\rm O}\,{\rightarrow}\, {\rm H}_{2}{\rm CO}_{3}$$
 $${\rm H}_{2}{\rm CO}_{3}\,{\leftrightarrow}\, {{\rm HCO}_{3}^{-}}+{\rm H}^{+}$$
 $${\rm NH}_{3}+{\rm H}_{2}{{\rm O}\,{\leftrightarrow}\, {\rm NH}_{4}}^{+}+{\rm OH}^{-}$$
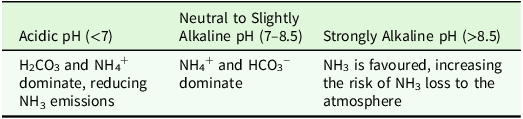
The expected speciation under different pH conditions at room temperature is summarized in Table 1.
Expected speciation of NH3 and NH4 + at 20 °C under various pH conditions (Interpreted from Aguado et al., Reference Aguado, Noriega-Hevia, Ferrer, Seco and Serralta2022; Huang and Shang, Reference Huang, Shang, Wang, Hung and Shamma2006)

Table 1. Long description
A table comparing the speciation of NH3 and NH4 + under various pH conditions. The table has three columns and three rows. Column headers are Acidic pH (<7), Neutral to Slightly Alkaline pH (7-8.5), and Strongly Alkaline pH (>8.5). Row 1: Acidic pH (<7), H2CO3 and NH4+ dominate, reducing NH3 emissions. Row 2: Neutral to Slightly Alkaline pH (7-8.5), NH4 + and HCO3 - dominate. Row 3: Strongly Alkaline pH (>8.5), NH3 is favoured, increasing the risk of NH3 loss to the atmosphere.
In confined cattle housing systems, including livestock export ships, NH3 volatilisation is a complex process influenced by a range of factors such as air temperature, humidity (Ngwabie et al., Reference Ngwabie, Jeppsson, Gustafsson and Nimmermark2011; Pines and Phillips, Reference Pines and Phillips2011), bedding (Banney et al., Reference Banney, Henderson and Caston2009), manure pH, stocking density and air exchange rates (Costa et al., Reference Costa, Accioly and Cake2003). Meta-analysis of cattle operations has identified air temperature as a primary driver of emission variation, with NH3 emissions increasing linearly as ambient temperatures rise (Liu et al., Reference Liu, Liu, Murphy and Maghirang2017). In terms of temperature, livestock on voyages between Australia and the Northern hemisphere can be exposed to maximum daily temperatures exceeding 30 °C (Beatty et al., Reference Beatty, Barnes, Taylor, Pethick, McCarthy and Maloney2006, Reference Beatty, Barnes, Taplin, McCarthy and Maloney2007; Pines and Phillips, Reference Pines and Phillips2011). In this current study, 25 °C was the baseline temperature treatment as this represents the standard temperature at which chemical equilibrium and mass transfer descriptors for manure surfaces are typically parametrized (Montes et al., Reference Montes, Rotz and Chaoui2009). The range of 25–35 °C captures a biologically and physically relevant window in which temperature-driven changes in NH3 volatilization potential can be substantial (Jeong et al., Reference Jeong, Lee and Choi2026; Ni, Reference Ni1999).
Dietary crude protein (CP) concentration influences urinary nitrogen excretion. For example, a high CP diet fed to lactating dairy cows resulted in nitrogen intakes of up to 585 g/day, with 188 g/day excreted in faeces and 231 g/day excreted in urine (Hynes et al., Reference Hynes, Stergiadis, Gordon and Yan2016). A review of dairy cattle found N excretion in urine ranged from 3.0 to 20.5 g urea-N/L, depending partly on diet composition and N intake (Dijkstra et al., Reference Dijkstra, Oenema, van Groenigen, Spek, van Vuuren and Bannink2013).
One aim of the current study was to assess the effects of temperature on the rate of volatilisation of NH3 from cattle manure. Increasing temperature from 15 to 35 °C led to higher rates of urea hydrolysis in dairy slurry (Moraes et al., Reference Moraes, Burgos, DePeters, Zhang and Fadel2017). In addition to temperature, this experiment also examined the effect of varying urea concentrations of manure on NH3 production, where urea is the major nitrogen source of urine. Urea concentrations were varied in this experiment to reflect this spatial heterogeneity in manure composition. This experiment was designed to simulate the effects of temperature and urea concentration (replicating urine) on NH3 production from cattle manure in a controlled in vitro system. Throughout the manuscript, temperature refers to the experimental temperature treatment, in which air and manure temperatures were maintained at the same target temperature.
Our prior hypotheses were: (i) with increasing temperature, there is an increasing rate of NH3 production; (ii) with increasing urea concentration, there is an increasing rate of NH3 production, (iii) there is no additive interaction between temperature and urea concentration in their joint effects on rate of NH3 production. Effects of temperature and urea concentration on manure pH immediately after urea was added (initial), final pH and NH4 + were also assessed.
This experiment was designed to quantify the relative effects of temperature and urea concentration on NH3 production in a controlled in-vitro system. While the experimental conditions, including manure characteristics and temperature (25–35 °C), were informed by livestock export environments, the results are intended to improve understanding of the sensitivity of NH3 production to changes in temperature and urea availability, through (a) comparison of urea-amended and non-amended manure, and (b) to examine the effects of increasing urea concentrations across a range representative of those that may occur in manure under such conditions.
Materials and methods
Experimental design
A 4 × 3 factorial randomized block design was used with four manure treatments, including addition rates of 0, 2.4, 6.0 and 9.6 g urea/kg simulated manure and three temperatures, 25, 30 and 35 °C. These temperature setpoints reflect previously reported temperatures on livestock export ships (Beatty et al., Reference Beatty, Barnes, Taylor, Pethick, McCarthy and Maloney2006; Beatty et al., Reference Beatty, Barnes, Taplin, McCarthy and Maloney2007; Pines and Phillips, Reference Pines and Phillips2011) and also livestock housing (Jeong et al., Reference Jeong, Lee and Choi2026; Montes et al., Reference Montes, Rotz and Chaoui2009). The treatment with 0 g urea/kg was the control, with no urea added beyond that naturally present in the faeces.
The experiment was repeated on three separate days using the same two cattle, with a fresh faecal sample used for all replicates within each day. Within days, there were three replicates for each urea by temperature combinations, resulting in 108 microchambers in total. The study was conducted over a 4-day period at the University of New England, Armidale.
Animals and animal management
The animal component of this experiment was approved by the UNE Animal Ethics Committee (approval ARA 20-112), in accordance with the NSW Animal Research Act, 1985, at the Centre for Animal Research and Teaching, the University of New England, Armidale, NSW, Australia.
Two Bos taurus steers (18 months of age; approx. 450 kg liveweight) were housed in individual pens and were fed a maintenance ration of 100 % commercial shipper pellet diet (9.5 MJ of metabolizable energy and 12.1 % CP per kg of DM; Macco Feeds, Willams, Western Australia), one week prior to, and during, faeces collection.
The pens were cleaned in the late afternoon the day prior, and a subsample (3.5 kg) of fresh faeces was selectively collected early the following morning to minimize urine contamination. Sampling was conducted before urination occurred, with faeces collected immediately after defaecation following the animals waking and standing. Faeces were homogenized thoroughly in a 25 L plastic bucket for 5 min with a drill paint mixer.
Moisture determination
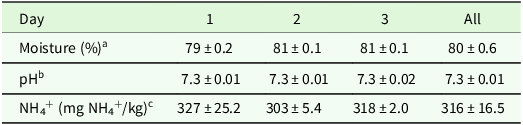
The homogenized faeces were transported to Laboratory 1 within 10 min of collection. Moisture content of faeces was measured using a microwave methodology developed for this experiment, where 20 g of manure was microwaved on high (Sharp 1500 W microwave) for 3 min then rested for 15 s and rearranged and repeated for 12 to 13 min, until the weight stabilized. The method was validated by the authors using 8 faecal samples, and compared to the conventional oven drying method (105 °C until constant weight), with moisture content results differing by less than 0.5 % between methods. Previous work utilising this diet of 100 % commercial shipper pellets for cattle enclosed in metabolic chambers (Hanafi et al., Reference Hanafi, Tait, Cowley, Morton, Creevey and Wilkes2024) found manure (faeces and urine) ranged from 75.9 to 88.3 % moisture. As the cattle in the current experiment had 80 ± 0.6 % (mean ± SD) moisture in faeces (Table 2), it was decided to standardize 85 % moisture for simulated manure.
Physicochemical characteristics (mean ± SD) of fresh faeces (moisture and pH) and simulated manure with no urea added (NH4 + concentration)

Table 2. Long description
A table with four rows and five columns comparing physicochemical characteristics of fresh faeces and simulated manure over three days. The columns are labeled Day, Moisture (%), pH, and NH4+ (mg NH4+/kg). The row labels are Day 1, Day 2, Day 3, and All. Row 1: Day 1, Moisture (%), 79 ± 0.2, pH, 7.3 ± 0.01, NH4+ (mg NH4+/kg), 327 ± 25.2. Row 2: Day 2, Moisture (%), 81 ± 0.1, pH, 7.3 ± 0.01, NH4+ (mg NH4+/kg), 303 ± 5.4. Row 3: Day 3, Moisture (%), 81 ± 0.1, pH, 7.3 ± 0.02, NH4+ (mg NH4+/kg), 318 ± 2.0. Row 4: All, Moisture (%), 80 ± 0.6, pH, 7.3 ± 0.01, NH4+ (mg NH4+/kg), 316 ± 16.5.
a n = 4 samples/day
b n = 3 samples/day; Samples for a and b were analysed from bulk fresh faeces at the start of each experimental day.
c n = 3 samples/day, analysed on simulated manure with no urea added, sampled at the time of microchamber loading.
Microchamber construction and manure loading
Microchamber vessels, adapted from Creevey (Reference Creevey2022), were constructed from PVC pipe with a threaded lid and adjustable metal gas fittings to regulate air flow. A plastic air dropper was attached to the inlet valve on the underside of the lid (Figure 1).
Microchamber vessel including plastic air dropper.

The microchambers had a depth of 14.9 cm and a diameter of 8.7 cm, giving a total volume of 886 cm3. The headspace volume after the addition of manure was 821 cm3. To avoid air contamination with NH3 in Laboratory 2, 60 g of faeces with either water (control) or simulated urine (urea treatments) was added to each microchamber in Laboratory 1. Microchambers were then sealed before being transferred to Laboratory 2.
Experimental conditions
Laboratory 2 included controlled air temperature, monitored using a SmartSense calibrated temperature probe (± 0.5 °C), and a circulating thermostatic water bath (TR-1α, As One Corporation, Axel Global, Shanghai, China; ± 0.05 °C control precision). Air and water bath temperatures were set to 25, 30, or 35 °C for each temperature treatment, with temperatures randomly assigned to a time each day (Table 3). Faeces were preheated to the corresponding temperature before simulated manure preparation and loading. Manure temperatures measured at the end of the incubation period were consistent with the assigned air and water bath temperatures.
The assignment of temperature treatment time points for days 1, 2 and 3. The methodological order of treatment temperatures each day, sampling days and times

Table 3. Long description
A table with three rows and four columns. The columns are labeled Day, Morning, Mid-morning, and Afternoon. The row labels are Day 1, Day 2, and Day 3. Row 1: Day 1, Morning 25, Mid-morning 30, Afternoon 35. Row 2: Day 2, Morning 35, Mid-morning 30, Afternoon 25. Row 3: Day 3, Morning 30, Mid-morning 35, Afternoon 25.
The microchambers were connected using vinyl tubing to the inlet of an acid trap (2 % boric acid trap (0.32 mol/L) in a sealed volumetric cylinder) where the air would bubble through a submerged aquatic stone; a vinyl tube connected to the outlet from the acid trap was connected to a multiplexer system of small 12-volt vacuum pumps (12V DC AJK-B12A4001, Xiamen AJK Technology Corporation Ltd., Xiamen, China); airflow measured using a dry test gas flow metre (DC-2 Series, Shingawa, Tokyo, Japan) and adjusted using metal taps on the microchambers to be 52 air changes per hour (ACH). The 52 ACH (equivalent to 1080 m3/h volume of air exchange) was selected as being representative of well-ventilated livestock export ships travelling from Australia as outlined in Hanafi et al. (Reference Hanafi, Tait, Cowley, Morton, Creevey and Wilkes2024). To determine NH3 production, boric acid traps were sampled (1.0 ml pipetted into vials and sealed) at nine time points (every 10 min).
Manure treatments
There was a control (no added urea) and three urea amended manure treatments dosed with increasing urea concentrations to simulate heterogenous urine deposition of manure in pens and variation in cattle urinary excretion (5, 12.5 and 20g urea-N/L). Urea was dissolved in ultrapure water (Milli-Q) to produce simulated urine (5, 12.5 and 20 g urea-N/L), across the range of reported cattle urinary urea concentrations (Dijkstra et al., Reference Dijkstra, Oenema, van Groenigen, Spek, van Vuuren and Bannink2013).
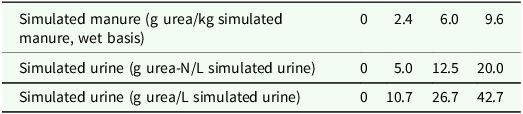
Based on Hanafi (Reference Hanafi2025), for cattle fed the same diet as the present experiment, average daily excretion was 4.8 L of urine and 16.7 kg of faeces, corresponding to a ratio of 1:3.5; this ratio was applied in the experimental design. These simulated urine solutions were thoroughly mixed into fresh cattle faeces and adjusted to a uniform moisture content of 85 %, resulting in final manure urea concentrations of 0, 2.4, 6.0 and 9.6 g urea/kg manure on a wet weight basis (Table 4). These concentrations represent increasing levels of urine loading onto manure, consistent with localized mixing of urine and faeces observed in confined cattle systems, at the upper the upper end of biologically plausible values.
Urea treatments in simulated manure and corresponding concentrations in simulated urine (control = no added urea)

Table 4. Long description
A table with three rows and four columns. The first row contains the header ‘Simulated manure (g urea/kg simulated manure, wet basis)’ with values 0, 2.4, 6.0, and 9.6. The second row contains the header ‘Simulated urine (g urea-N/L simulated urine)’ with values 0, 5.0, 12.5, and 20.0. The third row contains the header ‘Simulated urine (g urea/L simulated urine)’ with values 0, 10.7, 26.7, and 42.7. The table presents data on urea treatments in simulated manure and corresponding concentrations in simulated urine.
Simulated manure laboratory preparation and microchamber loading
The homogenized faeces was split into three plastic bags of ∼1 kg, with one bag allocated to each temperature treatment per day. Faeces were stored at 18 °C during the day, and 1 h prior to each temperature run were preheated in calibrated incubation ovens (MIR-254-PE, Panasonic) to reach the target temperature. Immediately prior to subsampling, the faeces were re-homogenized using spatula. For each treatment, a 200 g sample of faeces was placed in a clean beaker, with simulated urine added and ultrapure water (Milli-Q) added to achieve a simulated manure with 85 % moisture content. A 60 g portion of the simulated manure was then added to each microchamber. Any material on the sides of the microchamber was cleaned with a flexible spatula and deposited onto the manure surface.
Ammonia measurement
The NH3 output over time was measured by sampling the acid traps at 10 min intervals for a total of 90 min (Creevey, Reference Creevey2022). The same 12 microchambers were used at each of the three temperatures (4 urea treatments by 3 replicates) on each of the three experimental days. Each microchamber received the same urea treatment on all days.
Chemical analysis
Boric acid samples were analysed with a colorimetric plate-based assay using a Berthelot reaction, with absorbance measured with a spectrophotometer (SPECTROstar Nano, BMG Labtech, Ortenberg, Germany) (Creevey, Reference Creevey2022), where the darker the colour the higher the NH3 concentration. Any negative estimated NH3 concentrations were assumed to be 0 mg NH3/mL acid. Of the 1080 NH3 concentration values, 10 were identified as analytical errors because cumulative NH3 concentrations decreased by at least 60 % between successive sampling time points, despite cumulative NH3 capture being expected to increase over time. As these samples were near the detection limit of the analytical method, the affected values were replaced with the mean of the preceding and succeeding time-point values for that replicate. Faeces and simulated manure subsamples (10.0 g) were prepared and analysed for pH immediately after collection according to Peters et al., (Reference Peters, Combs, Hoskins, Jarman, Kovar, Watson, Wolf and Wolf2003) for semi-solid manure, using a 1:2 dilution of manure with ultrapure water (MilliQ) by volume, and measured using a pH Cube benchtop metre (TPS Pty Ltd, Australia) with a glass combination electrode. Three random subsamples of bulk homogenized faeces were analysed for pH each day (Table 2).
Simulated manure subsamples (1 g) were placed in 50 mL polypropylene centrifuge tubes extracted in 20 mL of 2 M KCl by tumbling for 4 h at 15 rpm; then centrifuged at 3000 × g for 20 min (Allegra X-15R Centrifuge, Beckman Coulter USA). Supernatants were stored overnight in a cool room at 4 °C, then diluted 1:10 with 2 M KCl to standardize concentrations within the assay range. Similarly to boric acid samples, KCl extracts were analysed with a colorimetric plate-based assay using a Berthelot reaction (Creevey, Reference Creevey2022), to determine ammoniacal-N (NH3 and NH4 +) (Deng et al., Reference Deng, van Linden, Guillen, Spanjers and van Lier2021; Yu et al., Reference Yu, Zhang, Cai and Dong2021), represented as manure NH4 + concentration in this paper. Control manure samples for each temperature were sampled when loading the microchamber and the physicochemical properties of these samples are reported in Table 2.
Statistical analyses
Statistical analyses were performed in Stata (StataCorp, Releases 18 and 19.5, College Station, TX, USA). Marginal means from statistical models are reported. For the models used, these equate to predicted means adjusted for average covariate values and are referred to throughout as predicted means.
Estimation of rates of NH3 production
Rates of NH3 production were estimated from cumulative air concentrations over time. Scatterplots indicated that rates of NH3 production were generally approximately linear over time. Accordingly, rate of NH3 production was estimated for each replicate microchamber by fitting a least squares linear regression line of best fit through the cumulative amounts of NH3 produced in that microchamber by time incubated. The predicted mean cumulative amount of NH3 produced up to 90 min, was then expressed as mg NH3 per m2 of microchamber surface area per minute.
Statistical comparisons
Rates of NH3 production were compared by temperature and urea concentration using linear regression. Rates of NH3 production for each of 2.4, 6.0 and 9.6 g urea/kg simulated manure treatments were compared to those from microchambers without urea addition, and comparisons of 6.0 and 9.6 g relative to 2.4 g were also derived from the same models. Temperature, urea concentration and day number were each fitted as categorical data as fixed effects. Terms for interaction between temperature and urea concentration were assessed using a joint Wald test. Day was fitted to account for any variables that varied between days including manure pH, NH4 + and other attributes of the manure pool used for the day.
Effects of temperature and urea on initial manure pH (immediately after urea addition) were analysed using the same approach as the NH3 production rate analyses. Effects of temperature and urea concentration on final manure pH were assessed using the same approach as used for rates of NH3 production but with the inclusion of one extra covariate, initial manure pH immediately after urea addition. This variable was fitted as continuous data as a fixed effect. It was included in the model because adding urea results in an immediate change in manure pH and our aim was to assess the effects of temperature and urea concentration on final pH over and above this immediate effect of adding urea on pH. The shape of the relationship between initial manure pH immediately after adding urea and final pH was first assessed using fractional polynomial regression.
Effects of temperature and urea concentration on final manure NH4 + concentration were assessed using the same approach as used for final manure pH, but with initial manure NH4 + concentration immediately after urea fitted as a covariate. When urea in the urine contacts the faeces, the NH4 + concentration may change, and the aim was to identify the effect of urea over and above the initial effect. The shape of the relationship between initial and final manure NH4 + concentrations was first assessed using fractional polynomial regression with all 108 replicates. Those results suggested that the relationship was curvilinear so the best-fitting 2-dimension fractional polynomials of initial manure NH4 + concentration were fitted as covariates as fixed effects. Because the residuals were heteroskedastic then robust (synonyms: Huber, White or sandwich) standard errors were used.
The same microchambers were used on each day. However, for each of rate of NH3 production, immediate change in pH, final manure pH and final manure NH4 + concentration, these analyses did not account for any clustering of rate of NH3 production by microchamber (where clustering would be indicated by some microchambers having generally higher and others generally lower rates of production), as in preliminary analyses, the random intercept variances for microchamber were all estimated as 0 with very extremely small standard errors. Accordingly, clustering by microchamber was disregarded in statistical analyses.
Results
Of the 108 NH3 production microchamber replicates, two were identified and excluded prior to statistical analysis. One was excluded because boric acid was inadvertently drawn into the microchamber, contaminating the sample. The second replicate was excluded because cumulative NH3 concentrations showed three marked decreases of at least 60 % during the 90-min incubation period, despite cumulative NH3 capture being expected to increase over time. This pattern was not observed in any other replicate at the same urea concentration and was therefore considered evidence of analytical error. The final pH measurement from the contaminated microchamber was also excluded from analysis.
The target temperatures were 25, 30 and 35 °C. The water bath was maintained within ± 0.5 °C of each setpoint. The actual mean air temperatures recorded for incoming air to the microchambers across all replicates were 26 ± 0.3, 30 ± 0.5 and 35 ± 0.6 °C (± SD), respectively. For statistical analysis and presentation, treatments are referred to by their nominal setpoints (25, 30 and 35 °C).
Incorporating urea into faeces resulted in immediate increases in pH (Figure 2). Predicted mean increases were broadly similar across urea concentration-temperature combinations, although increases were smaller for the 2.4 g urea/kg manure treatment, particularly at 25 °C (joint p-value for terms for interaction between urea concentration and temperature: 0.002).
Predicted mean initial pH values (immediately after the addition of urea) for control (0.0 i.e. only water added) and after adding water and 2.4, 6.0 or 9.6 g urea/kg manure to prewarmed simulated manure at each temperature. Error bars indicate 95 % confidence intervals for predicted means. Predicted means for 6.0 and 9.6 were almost identical.

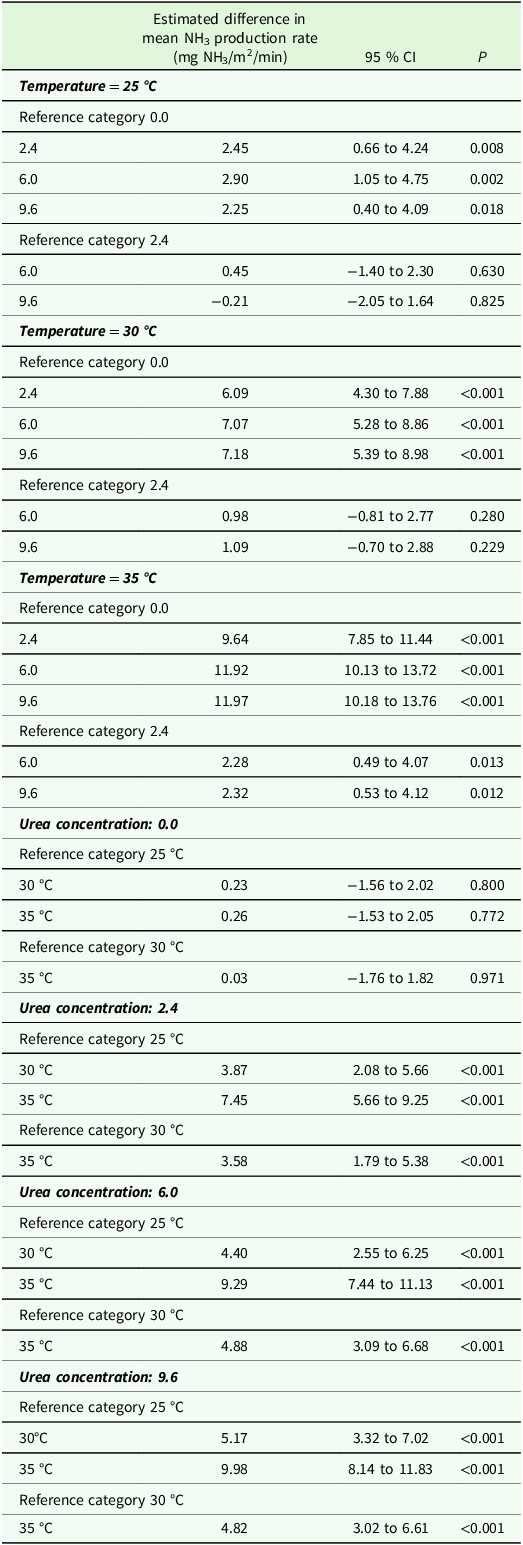
Estimated effects of urea concentration and temperature are shown for differences in mean NH3 production rate (Table 5) and on predicted mean production rates (Figure 3). There was evidence of an interaction between urea concentration and temperature (P < 0.001). The control urea treatment (0 g urea/kg manure) resulted in consistently very low NH3 production rates at all temperatures (mean 0.36 mg NH3/m2/min; SD 0.23, with no clear temperature trend). Compared to the control urea treatment, NH3 production rates for all urea amended treatments were higher across all temperatures, with greater increases with increasing temperature.
Predicted mean rates of air ammonia (mg NH3/m2/min) production by treatment (0.0, 2.4, 6.0 or 9.6 g urea/kg manure) and temperature. Error bars indicate 95 % confidence intervals for predicted means.

Estimated differences in rate of production of gaseous ammonia (NH3; mg NH3/m2/min), for treatments 2.4, 6.0 and 9.6 g urea/kg manure relative to 0.0 g, for 6.0 and 9.6 g relative to 2.4 g, for 30 and 35 °C relative to 25 °C and for 35 °C relative to 30 °C. (CI: confidence interval; P: P-value)

Table 5. Long description
A table with 32 rows and 4 columns comparing estimated differences in mean ammonia production rates (mg NH3/m2/min) under different urea concentrations and temperatures. The columns are labeled Estimated difference in mean NH3 production rate, 95 percent CI, and P. The rows are grouped by temperature (25 degrees C, 30 degrees C, 35 degrees C) and urea concentration (0.0, 2.4, 6.0, 9.6 g urea/kg manure). Each group compares different urea concentrations and temperatures, showing the estimated difference, confidence interval, and P-value. Notable trends include higher ammonia production rates at higher temperatures and urea concentrations.
For treatments with added urea, NH3 production rates increased with temperature, with the effect of urea concentration varying with temperature. Increasing urea concentrations from 2.4 to 6.0 and 9.6 g/kg manure at 25 °C had minimal effect on NH3 production rates (estimated differences of 0.45 and –0.21 mg NH3/m2/min, respectively), whereas at 30 °C and 35 °C, rates observed were similar for 6.0 and 9.6 g/kg manure (for example at 30 °C estimated differences of 0.98 and 1.09 mg NH3/m2/min, respectively). At 35 °C, 6.0 and 9.6 g/kg manure resulted in significantly higher NH3 production rates than 2.4 g/kg manure (estimated differences 2.28 and 2.32 NH3/m2/min, respectively; P = 0.013 and P = 0.012, respectively). In addition, within each urea amended treatment, increasing temperature from 25 to 30 °C, and 30 to 35 °C resulted in significant increases (P < 0.001) in NH3 production rate (Figure 3 and Table 5).
In summary, from 30 °C and above, increasing air and manure temperature, increased NH3 production rates by estimated values ranging from 3.87 to 9.98 mg NH3/m2/min across treatments. Increasing urea concentration from 2.4 to 6.0 g urea/kg manure in the simulated manure was associated with larger increases in NH3 production rates at higher temperatures, with a similar estimated production rates for 6.0 and 9.6 g urea/kg manure (Figure 3).
For the models to assess the final manure pH, the relationship between initial manure pH immediately after urea was added and final pH was non-linear so the best fitting pair of fractional polynomials for this variable were used in place of the linear term. Final pH was not measured for one microchamber due to contamination during the 25 °C run on Day 1. Effects of temperature and urea concentration interacted in their joint effects on final pH (P < 0.001).
Temperature had smaller effects on final pH than urea concentration with predicted means changing approximately linearly across the temperature range. Temperature was associated with slight decreases in final pH at the 0 and 2.4 g urea/kg manure treatment (the estimates decreased by 0.16 and 0.14 units, respectively), but slight increases under the 6.0 and 9.6 g treatments (the estimates increased by 0.10 and 0.11 pH units, respectively; Figure 4). Predicted means for final pH were 1.50 to 1.86 pH units higher than for the control treatment.
Predicted means for final pH of simulated manure by treatment (0.0, 2.4, 6.0 or 9.6 g urea/kg manure) and temperature. Error bars indicate 95 % confidence intervals for predicted means.

The P-value for interaction between temperature and urea concentration in their joint effects on final manure NH4+ concentration was 0.001 and an interaction was assumed. Manure NH4+ concentration increased with increasing urea concentration, with diminishing marginal increases at higher urea concentrations at 25 and 30 °C, where the increases in estimated mean of NH4+ concentration from 2.4 to 6.0 g urea/kg manure were larger than from 6.0 to 9.6 g urea/kg manure (Figure 5). Increases in temperature had little effect on manure NH4 + concentrations at urea concentration of 2.4 g urea/kg manure, but at 6.0 to 9.6 g urea/kg manure, manure NH4 + concentrations declined with increases in temperature (Figure 5).
Predicted means for final manure ammonium concentration (mg NH4 +/kg manure on a wet weight basis) by treatment (0, 2.4, 6.0 or 9.6 g urea/kg manure) and temperature. Error bars indicate 95 % confidence intervals for predicted means.

Discussion
Understanding the fate of dietary N in cattle rations provides insight into the factors influencing NH3 production rates from manure in intensive animal production and transportation systems (Hristov et al., Reference Hristov, Hanigan, Cole, Todd, McAllister, Ndegwa and Rotz2011; Uddin and Wattiaux, Reference Uddin and Wattiaux2021). The controlled in vitro approach used in this experiment enabled the effects of temperature and urea concentration in manure to be investigated under standardized conditions, allowing the sensitivity of NH3 production rates to temperature and urea concentration to be evaluated. Temperature and urea concentration interacted in their joint effects on NH3 production rate. Temperature had little measurable effect in the absence of added urea (control treatment), as there was minimal urea in the collected faeces. This indicates that temperature increases alone are insufficient to generate appreciable NH3 production in the absence of urea. While studies examining temperature effects on faeces without added urea appear limited, previous work has identified urinary urea as the primary source of NH3 production from cattle excreta (Vaddella et al., Reference Vaddella, Ndegwa, Joo and Ullman2010). In contrast, when urea was added to the simulated manure, increasing temperature resulted in substantial increases in rate of NH3 production. This response is consistent with previously reported increases in urea hydrolysis and NH3 production rate with temperature (Moraes et al., Reference Moraes, Burgos, DePeters, Zhang and Fadel2017; Ni, Reference Ni1999). Within treatments, estimated increases in NH3 production rates were similar for increases from 25 to 30 °C and from 30 to 35 °C, suggesting that if there is an upper threshold for temperature effects, under the study experimental conditions it is above 35 °C.
Whilst temperature determined the magnitude of NH3 production rates once urea was present, the effect of urea concentration itself was strongly temperature dependent. At 25 °C, increasing urea concentration had minimal effect on NH3 production rate, indicating that under cooler conditions NH3 production is not strongly responsive to the additional urea. In contrast, at 35 °C, NH3 production rate increased from 2.4 to 6.0 g urea/kg manure (by approximately 2.3 mg NH3/m2/min), however, showed no further increase between 6.0 and 9.6 g urea/kg manure (Figure 3).
The similar production rates from 6.0 g urea/kg manure suggest that NH3 production approached an upper limit under the experimental conditions. The highest experimental urea concentration was derived from simulated urine containing 20.0 g urea-N/L, which is near the upper end of the reported range of 3.0 to 20.5 g urea-N/L for dairy cattle urine (Dijkstra et al., Reference Dijkstra, Oenema, van Groenigen, Spek, van Vuuren and Bannink2013). This suggests that urea hydrolysis became constrained at higher substrate concentrations, potentially due to saturation of active urease sites or other kinetic limitations imposed by mass transfer processes at the manure-air interface, as described by Michaelis-Menten kinetics applied to manure surfaces, where the hydrolysis rate approaches a maximal velocity at high substrate concentrations (Hristov et al., Reference Hristov, Hanigan, Cole, Todd, McAllister, Ndegwa and Rotz2011). It is also consistent with observations by Aarnink et al., (Reference Aarnink, Swierstra, van den Berg and Speelman1997), who reported that NH3 production was likely constrained by urease activity present on the manured floor area.
From a systems perspective, these results suggest that, under voyage conditions, for a given temperature, there may be a threshold and increasing urea concentration above that threshold may not result in further increases in NH3 production. However, even if this does occur, our results also indicate that increases in temperature will still result in increases in NH3 production.
The immediate increase in pH following the incorporation of urea into the faeces would presumably have been due to urease enzymatic activity, as faecal urease catalyses urinary urea to form NH3 and carbonic acid, which in solution dissociates to NH4 + and bicarbonate ions, leading to an increase in pH (Dai and Karring, Reference Dai and Karring2014). This pH increase aligns with the expected chemical equilibria outlined in Table 1. These effects on pH contribute to the effects of urea treatment on NH3 production. As pH shifts towards more alkaline conditions, the equilibrium favours NH3 formation over NH4 +, facilitating greater NH3 volatilisation (Dai and Karring, Reference Dai and Karring2014). Together, the additional urea combined with the associated increase in manure pH jointly create favourable conditions for NH3 volatilisation, particularly at higher temperatures.
Increasing NH4 + concentration in the manure with increasing added urea confirmed that urea hydrolysis was occurring, and that a proportion of the added urea-N was retained in the manure as NH4 + (Dai and Karring, Reference Dai and Karring2014). However, manure NH4 + concentration generally declined with increasing temperature in the urea-treated manure, particularly at the 6.0 and 9.6 g urea/kg manure treatments. This decline in manure NH4 + concentration is consistent with the greater NH3 production rates observed at higher temperatures. As for pH increases as noted above, with temperature increases, the equilibrium also shifts from NH4 + towards NH3, resulting in reduced NH4 + retention in the manure and increased gaseous NH3 loss (Aguado et al., Reference Aguado, Noriega-Hevia, Ferrer, Seco and Serralta2022; Huang and Shang, Reference Huang, Shang, Wang, Hung and Shamma2006).
The findings of the current study should be interpreted within the context of the controlled in vitro system used with 52 air exchanges per hour, being representative of well-ventilated livestock export ships. The experimental design simplified the complexity of commercial livestock environments, where factors such as spatial heterogeneity in manure composition, variable airflow, moisture dynamics and microbial activity influence NH3 production (Hristov et al., Reference Hristov, Hanigan, Cole, Todd, McAllister, Ndegwa and Rotz2011). In addition, the relatively short measurement period captures early-stage NH3 volatilisation rather than longer-term dynamics, and the reported NH3 production rates should therefore be interpreted as short-term rates under controlled conditions rather than estimates of cumulative emissions over extended periods. Total N of the faeces was not measured, and therefore the final NH4 + concentrations cannot be interpreted as a percentage recovery of initial N or as a nitrogen mass balance. Whilst these controlled conditions enabled the sensitivity of NH3 production to temperature and urea concentration to be evaluated, further work is required to determine how these relationships operate under practical conditions, where manure accumulates over time and is regularly disturbed by animal movement and supplemented with additional urine and faecal deposition.
The results supported the hypothesis that increasing temperature of the manure and incoming air increases NH3 production rates, and partially supported the hypothesis regarding increasing urea concentration, as the effect of urea is dependent on temperature, and is larger at 35 °C rather than 25 and 30 °C. The hypothesis of no interaction was not supported, as there was evidence of interaction between temperature and urea.
Conclusions
Temperature and urea concentration interacted to influence NH3 production rates from cattle manure, with once urea was added, temperature becoming the strongest influence under the conditions studied. Increasing urea concentration increased NH3 production rates at higher temperatures, although a threshold was evident beyond which additional urea resulted in little further increase, consistent with kinetic or mass transfer constraints. Overall, urea availability defined the potential NH3 production rate, whereas temperature governed the extent to which this potential was expressed. Further work is required to determine how these relationships translate to commercial livestock systems where additional environmental factors influence NH3 dynamics.
Acknowledgements
We are grateful to Meat & Livestock Australia Pty Ltd., LiveCorp, and the Australian Government for funding this research [W.LIV.0299]. The authors thank Professor Fran Cowley for assistance with experimental design. We would also like to thank Dr Bonnie Mayes and Sue Gooley for their technical assistance.
Author contributions
SC built the microchambers. JW, AT and JT conceived, designed study and conducted data gathering. JM performed statistical analysis. JW, AT, JT, JM and SC wrote the article.
Funding statement
This research was funded by Meat & Livestock Australia Pty Ltd., LiveCorp, and the Australian Government [W.LIV.0299].
Competing interests
The authors declare there are no conflicts of interest.
Ethical standards
The animal component of this experiment was approved by the UNE Animal Ethics Committee (approval ARA 20-112), in accordance with the NSW Animal Research Act, 1985.






 Open access

