
I. INTRODUCTION
Ferritic steels strengthened with β′(B2)–NiAl nanoprecipitates have favorable high-temperature creep properties making them excellent candidates for steam turbine blades in thermal power plants. Reference Bhadeshia1–Reference Stallybrass, Schneider and Sauthoff3 The NiAl nanoprecipitates coherently embedded in a β(b.c.c.)-iron matrix, resulting in a β/β′ microstructure analogous to the γ(f.c.c.)/γ′(L12) microstructure present in Ni-based superalloys, Reference Calderon, Fine and Weertman4,Reference Zhu, Tjong and Lai5 are responsible for outstanding ambient and elevated temperature strength. The dislocation/precipitate interaction dictates the strength of these ferritic steels because the NiAl precipitates block the motion of dislocations, thereby decreasing the rate of plastic flow at elevated temperature. Reference Caron and Khan6–Reference Sauthoff10 Mechanisms include precipitate shearing where the order/disorder mechanism is active, and long-range elastic interactions resulting from modulus and lattice parameter mismatch which may lead to precipitate bypass via dislocation loops. Due to the relatively small modulus and lattice parameter mismatches between the β′(B2)-precipitates and the β(b.c.c.)-matrix, the order/disorder-type interaction is the dominant strengthening mechanism present in this alloy.
Order/disorder strengthening occurs when a single dislocation or dislocation pairs, referred to as a “super-dislocation”, shear through a long-ranged ordered precipitate. Under sufficient stress, the leading dislocation shears through the precipitate, creating an antiphase boundary (APB), Reference Nembach11,Reference Nembach and Neite12 and is followed by the trailing dislocation which then shears through the same precipitate, restoring order to the system. Unlike f.c.c. metal, (b.c.c.) α-Fe contains up to 48 slip systems along which dislocations can propagate. Slip along the 〈111〉 direction in the {110}-type plane has been shown to be preferred at low temperature Reference Naveen Kumar, Tewari, Durgaprasad, Dutta and Dey13–Reference Yoo, Takasugi, Hanada and Izumi15 and this slip system is used in the present work. Several analytical models have been developed to calculate the increase in strength for order strengthening interactions. Reference Nembach11,Reference Ardell16,Reference Brown and Ham17 These models apply to a particular state of the alloy—such as underaged, peak-aged, or high volume fraction of precipitates—and require explicit assumptions about the dislocation geometry. Two-dimensional (2-D) Reference Mohles18–Reference Liang, Huang and Li28 and three-dimensional (3-D) Reference Yang, Li and Huang29–Reference Prakash, Guénolé, Wang, Müller, Spiecker, Mills, Povstugar, Choi, Raabe and Bitzek36 computational models study dislocation dynamics (DD) within a field of precipitates and examine how dislocation interactions translate into hardness results. These 3-D models are able to encompass the geometry of a given crystal structure, eliminating the need for geometrical assumptions, and can incorporate stacking faults as well as the possibility of dislocation motion across multiple slip planes Reference Yang, Li and Huang29 with multiple dislocations present. While the dislocation structures in 3-D DD simulations often match those observed by transmission electron microscopy, the stress/strain relationships are difficult to directly compare to experiments because of long simulation times even for high strain rates. Reference Vattré, Devincre and Roos31,Reference Hafez Haghighat, Eggeler and Raabe33 The 2-D DD simulations, alternatively, require far fewer computational resources and shorter times to simulate a given material but are geometrically restricted to a single 2-D glide plane and do not treat 3-D dislocation phenomena such as cross-slip and climb. The movement of dislocations into a different slip plane is thermally activated and is expected to be negligible when simulating dislocation propagation at low temperatures. Additionally, the precipitate morphology is taken to be static at this temperature.
In the present study, we utilize a 2-D DD line dislocation code created by Mohles and co-workers Reference Mohles18,Reference Mohles20,Reference Mohles22,Reference Mohles and Fruhstorfer23,Reference Mohles37,Reference Mohles, Raabe, Roters, Barlat and Chen38 which was expanded by Krug et al. Reference Krug, Mao, Seidman and Dunand39 and Bocchini et al. Reference Bocchini40,Reference Bocchini41 to study aluminum- and cobalt-based superalloys, respectively, while incorporating microstructure experimentally obtained using atom probe tomography taking into account the additional effect of modulus and lattice parameter mismatch. We compare our simulation results for hardness with room-temperature microhardness measurements of precipitation-strengthened ferritic steels within the β/β′ microstructure. Previously, the Mohles et al. simulation code has been exclusively used to simulate f.c.c systems, i.e., copper strengthened with incoherent BeO and SiO2 precipitates (volume fraction ϕ = 0.7, 3, 10, and 11% with precipitate radii 〈R〉 = 50 nm), Reference Mohles18,Reference Lagerpusch, Mohles, Baither, Anczykowski and Nembach42,Reference Lagerpusch, Mohles and Nembach43 aluminum alloys strengthened with nanoscale, coherent L12 Al3(Li, Sc, Yb) and Al3(Li, Sc, Yb)/Al3Li core–shell precipitates at low volume fractions (ϕ = 0.3–6.5%), Reference Krug44 γ/γ′ Nimonic PE16 nickel-based superalloy with a low, Reference Mohles18,Reference Nembach, Pesicka, Mohles, Baither, Vovk and Krol19 and high Reference Bocchini41 volume fractions (ϕ = 2.9–6.1% and ϕ = 5–70%, respectively) of L12 precipitates (〈R〉 = 25–360 nm and 1–105 nm, respectively), and γ/γ′ Co-based superalloys with L12 precipitates (ϕ = 50–70%, 〈R〉 = 50–200 nm). Reference Bocchini41
This study uses the 2-D DD simulation developed by Mohles et al. and later modified by Krug et al. Reference Krug, Mao, Seidman and Dunand39 to investigate its applicability for predicting room-temperature strengthening increments in a novel order-strengthened ferritic β/β′ superalloy. The DD simulations are compared to closed-form analytical solutions and experimental microhardness results from a B2(NiAl)-strengthened Fe–Ni–Cr–Al–Mo–Zr–B β/β′ ferritic superalloy. Reference Teng, Miller, Ghosh, Liu, Huang, Russell, Fine and Liaw45–Reference Sun, Song, Ilavsky, Ghosh and Liaw47 The simulations are used to predict the combined effect that two distinct precipitate phases (i.e., duplex precipitates) have on the strength and hardness of the studied alloy and compared with previous experimental observations. Reference Sun, Song, Ilavsky and Liaw48
II. EXPERIMENTAL PROCEDURES
A. Simulation method
Mohles Reference Mohles21,Reference Mohles and Nembach49 and Krug et al. Reference Krug, Mao, Seidman and Dunand39 provided a complete description of the simulation methods and Bocchini et al. Reference Bocchini40 gave a detailed description of experimental comparison techniques, thus we provide only a summary of the aspects of the code pertinent to the present study.
1. Line dislocation model
This DD model simulates one or two dislocations propagating through a field of precipitates embedded within a matrix, acting as obstacles to the motion of dislocations. Each dislocation is comprised of multiple nodes, with each node being subjected to up to four interaction forces originating from other dislocations, obstacles, the external applied stress, and the drag force. The nodes positions are adjusted iteratively until a net zero stress is reached, using the following force balance equation:
 $${\tau _{{\rm{ext}}}} + {\tau _{{\rm{obst}}}} + {\tau _{{\rm{dis}}}} + {\tau _{{\rm{drag}}}} = 0\quad ,$$
where τext is the external stress applied to the system, τobst is the stress associated with the dislocation interacting with the precipitates, τdisloc is the stress induced by the dislocation interacting with itself and/or other dislocations, and τdrag is the stress due to viscous drag which is proportional to the nodes local velocity normal to the dislocation line. At the beginning of the simulation, the dislocation is a straight line at the bottom edge of the obstacle field with a periodic boundary condition imposed (as if the glide plane wrapped around a cylinder and the dislocation moved vertically parallel to the cylinder axis). This model can simulate either a single dislocation or a pair of interacting dislocations of the same sign and Burger’s vector propagating through the obstacle field. An external stress, τext, is applied to the system to initiate dislocation motion and is initially set to a value ∼10% below the stress at which large scale dislocation slip occurs (i.e., the critical resolved shear stress, CRSS). This drives the dislocation(s) through the obstacle field until a static equilibrium is achieved at each node. The external stress is then increased by an increment δτ, a value usually ∼2% of the estimated CRSS, which allows the dislocation(s) to continue to progress through the obstacle field until the next static equilibrium is reached. This process is repeated as the dislocation glides through the precipitate field while either shearing through the precipitates or bypassing them with concomitant formation of Orowan loops, with the dominant bypass mechanism being dictated by precipitate average radius 〈R〉 and volume ϕ, as described in more detail in a later section. As τext increases, the lowest value necessary for the dislocation(s) to slip over long distances (i.e., to reach the upper edge of the precipitate field) is taken to be the strengthening increment due to precipitation, τp, for that particular obstacle field. For a given obstacle field, multiple runs were performed with particular set of initial conditions (τext, δτ) with the resulting τp remaining constant within 1–3 MPa.
2. Simulated precipitate field
An array of 3D particles is generated that mirror those present in actual precipitate-strengthened materials that undergo coarsening via isothermal Ostwald ripening. Reference Mohles and Nembach49 The volume fraction, ϕ, of the particles as well as their average radius, 〈R〉, and the distribution function can be chosen. While both 〈R〉 and ϕ vary in this article, the distribution function suggested by Lifshitz and Slyozov Reference Lifshitz and Slyozov50 and Wagner Reference Wagner51 is always used. Once an arrangement of 3D spherical precipitates has been generated, the desired glide plane is created through the simulated volume, producing a realistic 2D precipitate field in a given glide plane. The material-specific parameters are then inputted into the simulation, such as the APB energy of the precipitates and the dislocation Burger’s vector (used here for the 〈111〉 direction on the {110} glide plane because, of the many slip systems active in α-Fe systems, it has been shown to be the dominant system at low temperatures (<297 K). Reference Naveen Kumar, Tewari, Durgaprasad, Dutta and Dey13,Reference Yoo, Takasugi, Hanada and Izumi15 In some cases, the size of field will increase with 〈R〉, however, little stress accumulates after reaching τp, making the additional area negligible.
B. Data for experimental comparison
Using methods similar to those reported by Bocchini et al., Reference Bocchini41 experimental data for 〈R〉 and ϕ collected via scanning transmission microscopy (SEM) and transmission electron microscopy (TEM) images taken from of a ferritic superalloy with a nominal composition of Fe–10Ni–10Cr–6.5Al–3.4Mo–0.25Zr–0.005B (wt%) strengthened by long-ranged ordered β′-precipitates are used in the simulation. Reference Teng, Miller, Ghosh, Liu, Huang, Russell, Fine and Liaw45 Order/disorder stresses are treated as a contact force, meaning that the precipitates only interact with the dislocations when they are in direct contact with one another. When shearing the precipitates, the leading dislocation creates an APB and is subjected to a repulsive stress from the precipitates while the trailing dislocation restores order to the B2 structure and is subjected to an attractive force where
 $${\tau _{{\rm{obst}}}} = \left\{ {\matrix{ { - {{{\gamma _{{\rm{APB}}}}} \over b}} {{\rm{leading}}\;{\rm{dislocation}}\;{\rm{inside}}\;{\rm{precipitate}}} \cr { + {{{\gamma _{{\rm{APB}}}}} \over b}} {{\rm{trailing}}\;{\rm{dislocation}}\;{\rm{inside}}\;{\rm{precipitate}}} \cr} } \right.\quad ,$$
where γAPB = 200 mJ/m2 is the APB energy, consistent with measurements for the NiAl phase Reference Campany, Loretto and Smallman52 and b = 0.251 nm is the Burgers vector of dislocations in α-Fe for the 〈111〉 directions on the {110} glide planes. Reference Teng, Liu, Ghosh, Liaw and Fine53 It should be noted that the shear modulus, G, used is 77 GPa.
The simulations, using 〈R〉 and ϕ as input parameters, provide the strengthening increment τp which is, however, not directly comparable with experimental microhardness measurements; τp is converted to hardness HV using Reference Krug, Mao, Seidman and Dunand39
 $${\rm{HV}} = {\rm{H}}{{\rm{V}}_{{\rm{Fe}}}} + {\left\{ {{{\left( {\Delta {\rm{H}}{{\rm{V}}_{{\rm{SS}}}}} \right)}^k} + {{\left( {CM\tau _{\rm{p}}^{{\rm{sim}}}} \right)}^k}} \right\}^{{1 \over k}}}\quad ,$$
where HVFe is the microhardness of pure Fe taken as 608 MPa Reference Samsonov54 (a high value reflecting the high Peierls stress in bcc-Fe), ΔHVSS = 275 MPa is the increase in hardness due to solid solution strengthening, Reference Rosenhain55 C is the conversion factor from yield strength to Vickers microhardness (we use C = 3, as experimentally observed in many alloys systems Reference Tabor56 ), M is the Taylor factor used to convert τp sheer stress to a tensile stress, and is set equal to 3.067. Reference Rosenberg and Piehler57,Reference Huther and Reppich58 The superposition exponent k is used to describe the effect of multiple strengthening mechanisms and is varied between 1 and 2, Reference Nembach11 as described below.
C. Closed-form analytical equations for order strengthening
Various closed-form equations have been developed to model strengthening effects of long-ranged ordered precipitates. Many of these are based on a force balance of the paired dislocation configuration with a leading dislocation (D1) shearing through precipitates creating an APB, followed by a trailing dislocation (D2) restoring order in the precipitates. We use the following equation for the strengthening increment τp Reference Nembach11,Reference Samsonov54 :
 $${\tau _{\rm{p}}} = {{{\gamma _{{\rm{APB}}}}} \over {2b}}\left\{ {{{{d_1}} \over {{L_1}}} - {{{d_2}} \over {{L_2}}}} \right\}\quad ,$$
where d
i
is the length of leading (i = 1) and trailing (i = 2) dislocation within the precipitate and L
i
is the mean center-to-center spacing of the leading and trailing dislocation. The ratio
 ${{{d_2}} \over {{L_2}}}$
is set equal to unity since the trailing dislocation experiences minimal to no repulsive stress while bypassing precipitates and maintains its roughly straight geometry. The derivation for the term of the leading dislocation,
 ${{{d_1}} \over {{L_1}}}$
, varies depending on the geometry and strength of the precipitate.
Other equations exist that predict the strengthening increment τp for alloys containing precipitate or dispersoids with volume fraction ϕ and radii 〈R〉, used here to show the variations among analytical models as well as to compare with our DD simulations.
The Friedel equation Reference Nembach11,Reference Mohles18 for the case where the particles are sheared is given by
 $$\tau _{\rm{p}}^{{\rm{Friedel}}} = {{2S} \over {b\left\langle R \right\rangle \sqrt {\pi {\omega _{\rm{q}}}} }}\sqrt \phi {\left( {{{{\gamma _{{\rm{APB}}}}{\omega _{\rm{r}}}\left\langle R \right\rangle } \over S}} \right)^{3{\rm{/}}2}}\quad ,$$
where ωr and ωq are spherical correction constants which take into account 2-D planes cutting 3-D spherical particles having values of ωr = 0.82 and ωq = 0.75 and where S = μb 2/2 denotes the line tension, with µ the shear modulus.
The Orowan equation Reference Nembach11,Reference Mohles18 describes bypassing of particles by the looping mechanism:
 $$\tau _{\rm{p}}^{{\rm{Orowan}}} = {{2S} \over {b{\omega _{\rm{L}}}\left\langle R \right\rangle }}\quad ,$$
with
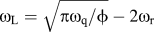 ${\omega _{\rm{L}}} = \sqrt {\pi {\omega _{\rm{q}}}/\phi } - 2{\omega _{\rm{r}}}$
.
For a square lattice, the maximum force, F
0, of a particle and the minimum interparticle distance,
 $\lambda _{E - E}^{\min }$
, are used to determine a theoretical peak strengthening
Reference Nembach11,Reference Mohles18
:
 $$\tau _{\rm{p}}^{{\rm{square}}\;{\rm{lattice}}} = {{{F_0}} \over {b\lambda _{E - E}^{\min }}} = {{2{\omega _{\rm{r}}}} \over {\sqrt {{{\pi {\omega _{\rm{q}}}} \mathord{\left/ {\vphantom {{\pi {\omega _{\rm{q}}}} \phi }} \right. \kern-\nulldelimiterspace} \phi }} }}{{{\gamma _{{\rm{APB}}}}} \over b}\quad ,$$
with
 ${F_0} = 2{\gamma _{{\rm{APB}}}}{\omega _{\rm{r}}}\left\langle R \right\rangle$
.
For alloys in the underaged condition Reference Nembach11,Reference Brown and Ham17,Reference Rosenhain55 where the shearing mechanism is dominant, the strengthening increment is
 $$\tau _{\rm{p}}^{{\rm{underaged}}} = {{{\gamma _{{\rm{APB}}}}} \over {2b}}\left\{ {{{\left( {{{4\omega _{\rm{r}}^3} \over {\pi {\omega _{\rm{q}}}}}} \right)}^{{1 \over 2}}}{{\left[ {{{{\gamma _{{\rm{APB}}}}\left\langle R \right\rangle \phi } \over S}} \right]}^{{1 \over 2}}} - \alpha \phi } \right\}\quad ,$$
and for alloys with high volume fractions of particles, Reference Ardell, Munjal and Chelman60
 $$\tau _{\rm{p}}^{{\rm{HVf}}} = {{{\gamma _{{\rm{APB}}}}} \over {2b}}\left\{ {u - \alpha \phi } \right\}\quad ,$$
where
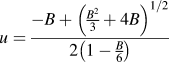 $u = {{ - B + {{\left( {{{{B^2}} \over 3} + 4B} \right)}^{1/2}}} \over {2\left( {1 - {B \over 6}} \right)}}$
and
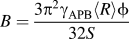 $B = {{3{\pi ^2}{\gamma _{{\rm{APB}}}}\left\langle R \right\rangle \phi } \over {32S}}$
.
Finally, for shearing of particles by closely coupled dislocation, where two dislocations reside in the same particle, Reference Nembach11 the following equation was derived
 $$\tau _{\rm{p}}^{{\rm{SP}}} = 0.69{\left( {{{{\gamma _{{\rm{APB}}}}p\phi S} \over {{b^2}\left\langle R \right\rangle }}} \right)^{{1 \over 2}}}\quad ,$$
where p is a fitting parameter equal to unity.
III. RESULTS AND DISCUSSION
A. Parametric study
A parametric study was performed to investigate how the 2D model results are affected by changes in NiAl precipitate size and volume fraction. The simulated strengthening increment, τp is determined as a function of ϕ and 〈R〉, i.e., 〈R〉 was varied from 5 to 75 nm for three volume fractions, ϕ = 10, 13, 20%, which are in the range of volume fractions experimentally observed in this steel for NiAl precipitates. Reference Teng, Miller, Ghosh, Liu, Huang, Russell, Fine and Liaw45,Reference Rosenhain55 Simulations used initial configurations of a single dislocation of both edge and screw types. Additionally, super-dislocations, consisting of a leading and trailing dislocation of both edge and screw types, were simulated.
1. Single dislocation
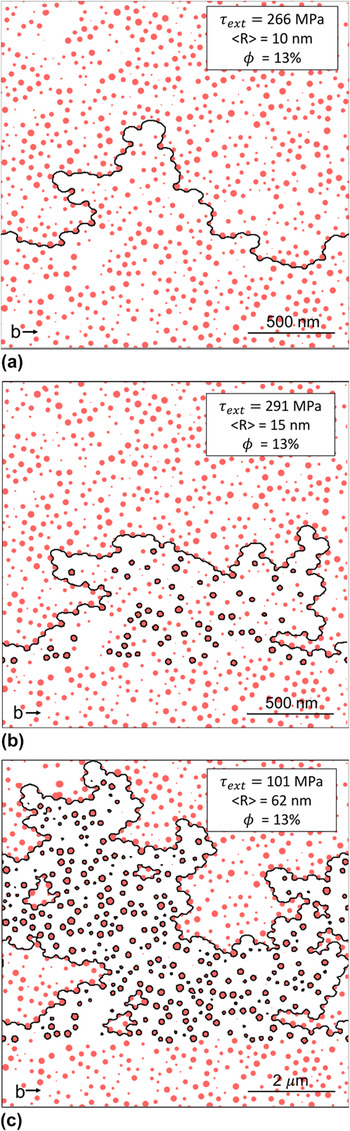
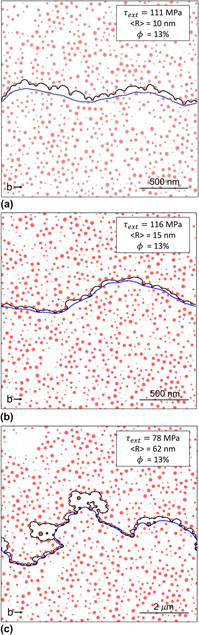
Figures 1(a)–1(c) shows three dislocation configurations for a single-screw dislocation having glided partially through obstacle fields with various average particle radii 〈R〉 = 10, 15, and 62 nm, at a constant volume fraction ϕ = 13%. The dislocation, at the start of the simulation, is a straight line and as it moves and encounters precipitates, it bows between them before shearing through them or bypassing them by the Orowan mechanism and leaving a dislocation loop; in some cases, a combination of both mechanisms operate for the same field of precipitates. The dislocation advances in some regions farther than in others because the local distribution of precipitates is more or less efficient at blocking the dislocation, resulting in a highly sinuous dislocation line. There are two regimes that emerge from these simulations, as illustrated for screw dislocations in Figs. 1(a)–1(c).
DD-simulation examples of single-screw-type dislocation (a) shearing small precipitates, (b) combined shearing/looping intermediate-size precipitate, and (c) looping around large precipitates, with an APB energy of 200 mJ/m2 typical of β′(B2)-precipitates in Fe-base superalloys. Maximum applied shear stress (τext), average precipitate radius (〈R〉), and volume fraction (ϕ) are listed in the insets. Please note scale shift in Fig. 1(c).

Regime 1 is observed when the dislocation interacts with a field of small precipitates which are sheared by the dislocation [Fig. 1(a), 〈R〉 = 10 nm]. A transitional regime arises when the dislocation interacts with precipitates with intermediate 〈R〉, corresponding to an idealized peak-aging conditions. Under this condition, the distribution of precipitate radii is such that the smaller precipitates are sheared by the passing dislocation while the larger precipitates are bypassed via the looping mechanism as exemplified in Fig. 1(b), 〈R〉 = 15 nm, where only some of the bypassed precipitates are surrounded by a loop while the others are sheared. Thus, for this volume fraction, the precipitate distribution with 〈R〉 = 15 nm corresponds to peak strengthening.
Regime 2 occurs when the precipitates are relatively large so that the dislocation bypasses them all via the Orowan looping mechanism with each bypassed precipitate surrounded by a dislocation loops (Fig. 1(c), 〈R〉 = 62 nm). Closely clustered groups of precipitates sometimes act as a single large obstacle around which the dislocation forms a single loop by the Orowan mechanism, as illustrated in Fig. 1(b). Edge dislocations simulations exhibited similar configuration and behavior as screw dislocations.
2. Super-dislocation
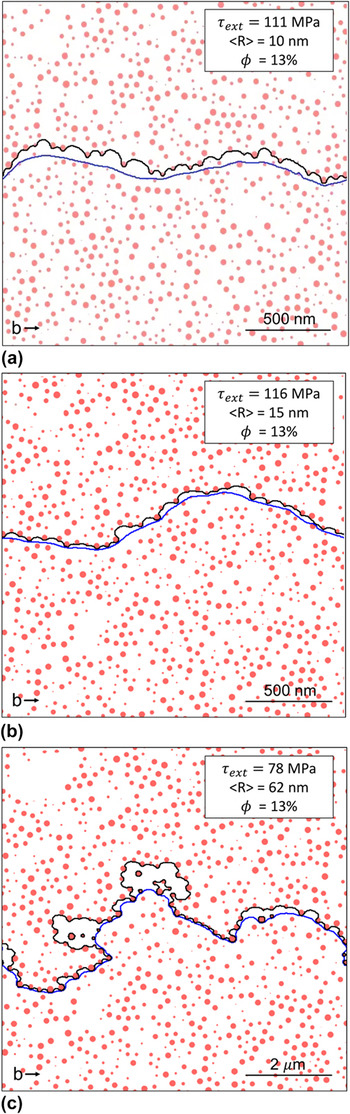
Super-dislocations, consisting of a pair of leading and trailing dislocations, were simulated with both edge and screw configurations. Again, two regimes are observed, as for a pair of screw dislocations in Figs. 2(a)–2(c). Super-dislocations bypass the obstacles through cooperative shearing with the repulsive forces from the trailing dislocation on the leading dislocation assisting in propelling the leading dislocation through the precipitate field. Due to this cooperative shearing, a lower external stress is required to bypass the precipitate field as compared to the single dislocation, thus super-dislocation simulations consistently predict a lower τp than their single-dislocation counterparts for the same combination of precipitate radii and volume fraction.
DD-simulation examples of (a) weakly coupled, (b) strongly coupled, and (c) decoupled screw-type dislocation pairs moving through fields of precipitates with an APB energy of 200 mJ/m2 typical of β′(B2)-precipitates in Fe-base superalloys. Maximum applied shear stress (τext), average precipitate radius (〈R〉), and volume fraction (ϕ) are listed in the insets. Please note scale shift in Fig. 2(c).

Regime 1 occurs when the super-dislocation interacts with relatively small precipitates, shown in Fig. 2(a) where 〈R〉 = 10 nm. The two dislocations are weakly coupled, i.e., their separation is large so there is a weak interaction between their stress fields. Once the leading dislocation shears through a precipitate, it creates an APB in the precipitates left between the two dislocations, which allow the trailing dislocation to easily shear through that same precipitate as it restores order. Under this condition, the trailing dislocation remains primarily straight since the precipitates sheared by the leading dislocation do not hinder the motion of the trailing dislocation. As 〈R〉 increases, a greater external stress is needed for the leading dislocation to shear through the precipitates. This increased τext also acts on the trailing dislocation, forcing it in closer proximity to the pinned lead dislocation despite the repulsion force between the two. In Fig. 2(b), the pair remains so closely coupled that there are no sheared precipitates between the leading and trailing dislocations; in some cases, the two dislocations are simultaneously shearing the same precipitate.
Regime 2 (Orowan bowing) becomes active when the dislocations interact with large precipitates and become increasingly decoupled. In Fig. 2(c) (〈R〉 = 62 nm), while τext is still sufficiently large to force the dislocation pair into close proximity, 〈R〉 has increased to make it easier for the leading dislocation to loop around individual or clusters of precipitates rather than shear them in regions of low precipitate concentration. Here, the trailing dislocation encounters the remaining Orowan loops around the precipitates, which create a repulsive force. When the externally applied load is sufficiently high, the Orowan loops are observed to annihilate, creating an APB by shearing the precipitates, and subsequently allowing the trailing dislocation to move through the same precipitates and restore order by shearing them. By modeling super-dislocation propagating through fields of high ϕ and high 〈R〉 precipitates, strongly coupled dislocation pairs are shown to shear through a precipitate nearly simultaneously, seen in Figs. 2(b) and 2(c). Reference Bocchini40,Reference Bocchini41 Edge dislocation pairs were simulated exhibiting similar types of configuration and behavior as screw dislocations.
3. Effect of dislocation type (single- and super-dislocations) on strengthening
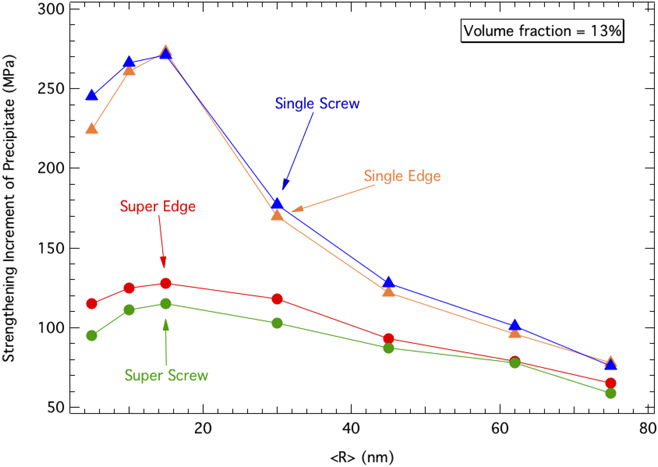
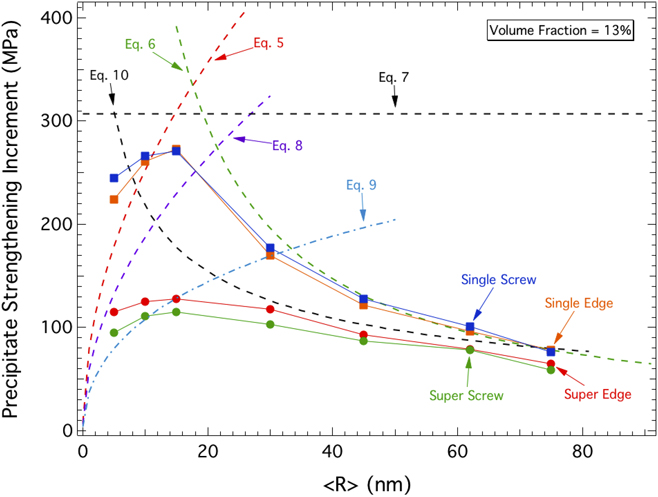
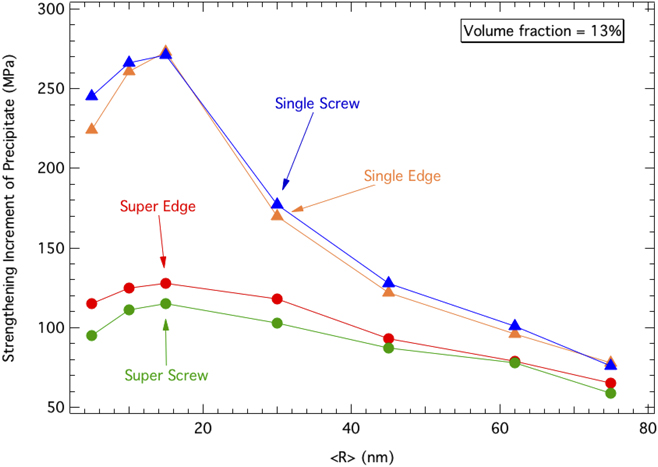
Figure 3 displays the strengthening increment τp due to a constant volume fraction (ϕ = 13%) of NiAl precipitates, as a function of average radii (〈R〉 = 5–75 nm) for the four cases of single- and super-dislocation of both edge and screw types. Figure 3 shows that the edge and screw results are in close agreement with one another for both the single-dislocation and super-dislocation cases, but results are markedly different between these two latter cases. For 〈R〉 up to ∼50 nm, simulations for a single dislocation consistently yield a much higher
 $\Delta \tau _{\rm{p}}^{{\rm{sim}}}$
than the corresponding super-dislocation simulations. For 〈R〉 greater than 50 nm, the single and super-dislocation results converge. The lower value of τp for the super-dislocation case is due to the cooperative shearing that occurs when the repulsive force of the trailing dislocation assists the leading dislocation in shearing the precipitates. This phenomenon is predominant at small average precipitate radii, where obstacles are mostly bypassed by the shearing mechanism, as opposed to being bypassed by Orowan looping which dominates at larger radii, typically above ∼20 nm.
Plot of strengthening increment, τp, in Fe alloys with β(NiAl)-precipitates with an APB energy of 200 mJ/m2 as a function of precipitate average radius for DD simulations of single and super-dislocations of both edge and screw types with volume fraction ϕ = 13%.
4. Effect of volume fraction on strengthening
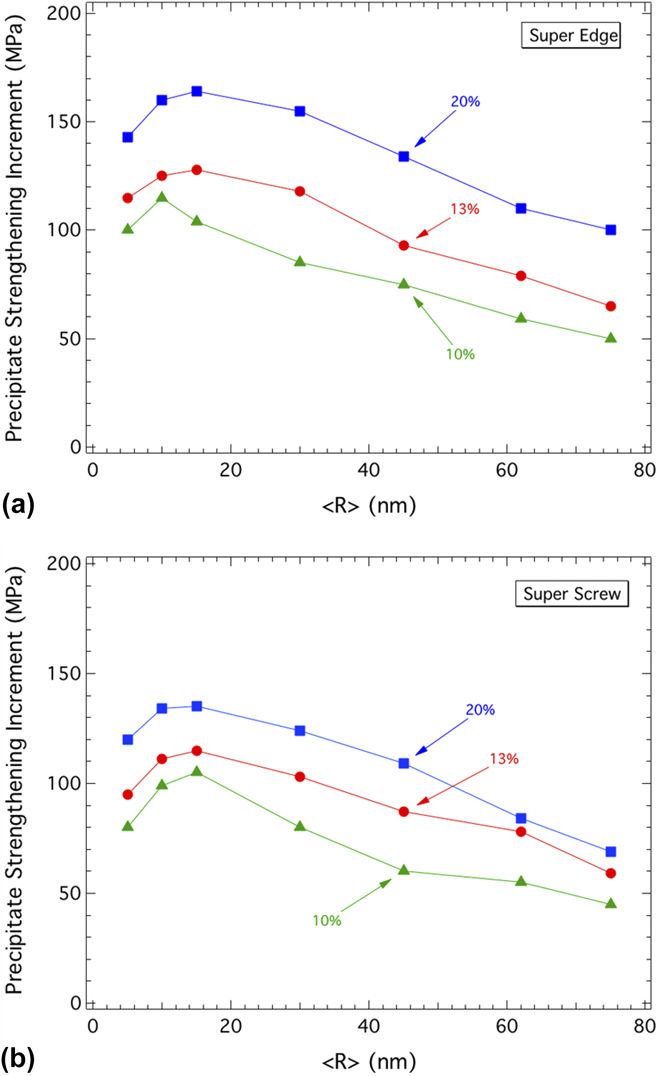
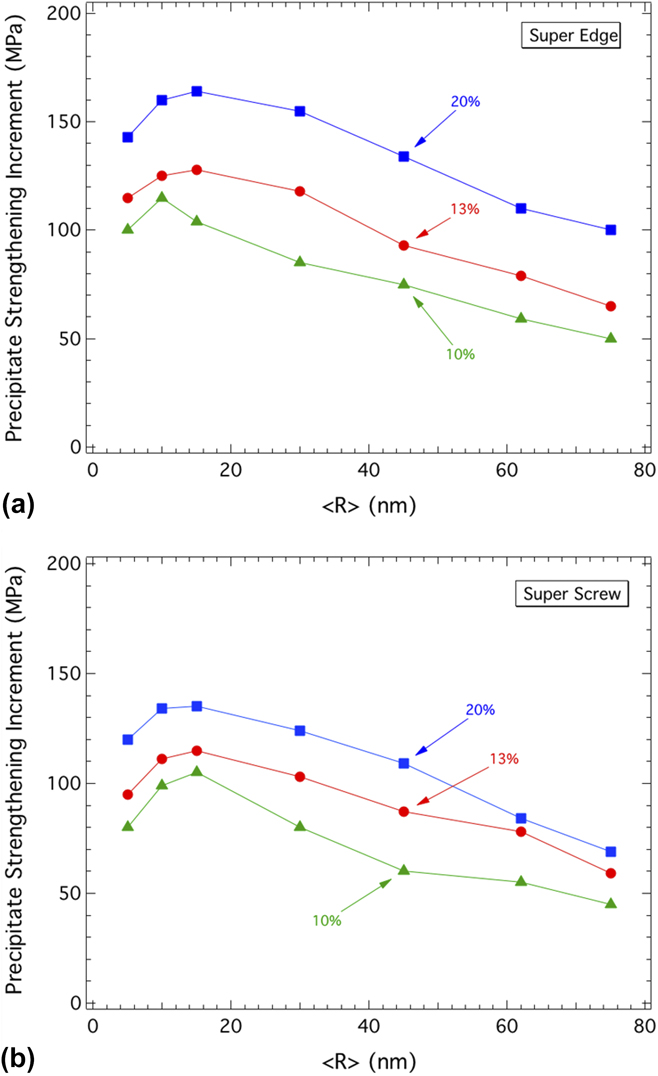
Simulations for super-dislocations of both edge and screw character, plots of Δτp versus 〈R〉 for 〈R〉 ranging from 5 to 75 nm and three volume fractions (ϕ = 10, 13, and 20 %) are shown in Fig. 4. In Figs. 3 and 4, Δτp initially increases with increasing radii, followed by a short plateau at the peak
 $\tau _{\rm{p}}^{{\rm{sim}}}$
for 〈R〉 ∼10–20 nm and subsequent decreases in τp for larger average radius. As reported by Bocchini et al., for Ni base superalloys strengthened by γ′ (L12) precipitates with 〈R〉 between 1 and 110 nm and ϕ = 45%, the decrease in τp results from the formation of strong pair coupling zones as resistances to shear deformation of individual precipitates increases with size. The transition from a positive to a negative slope of τp for small radii versus larger radii is a result of a switch in the bypass method that dominates dislocation propagation and was explicitly observed to occur in the DD simulations summarized in Figs. 1 and 2. Figure 4 shows that the τp generally increases with increasing volume fraction for both super-edge and super-screw dislocations due to a decrease in the interprecipitate distance, λ
E−E
.
Plot of strengthening increment, τp, in Fe alloys with β(B2)-precipitates with an APB energy of 200 mJ/m2 as a function of precipitate average radius for DD DD-simulations of (a) super-edge and (b) super-screw dislocations for volume fractions ϕ = 10, 13, and 20%.
B. Comparison between simulations and analytical solutions
Simulated results, for various radii at a constant volume fraction of 13%, are compared to the analytical equations in Eqs. (5)–(10) in Fig. 5. Obviously, Eqs. (5) and (6), corresponding to the Friedel and Orowan closed-form solutions for the shearing and Orowan mechanisms respectively, most closely follow the results for the single-dislocation simulations for underaged (region of low 〈R〉 below peak τp) and overaged (region of high 〈R〉) regions. In the underaged region, there is only rough agreement between the analytical solutions and the simulated τp values; for both the single and super-dislocation cases, the closed-form solutions fail to accurately capture the trajectory of the simulated results. Similar discrepancies were observed in previous studies Reference Mohles18 and were attributed, among other causes, to the influence of the periodic boundary condition used in the model. A more detailed explanation has previously been outlined by Mohles. Reference Mohles18
Plot of strengthening increment, τp, in Fe alloys with β′(B2)-precipitates with an APB energy of 200 mJ/m2 as a function of precipitate average radius with volume fraction ϕ = 13% for DD-simulations (solid lines with symbols) of super-edge and super-screw dislocations, compared to analytical models (dotted lines).
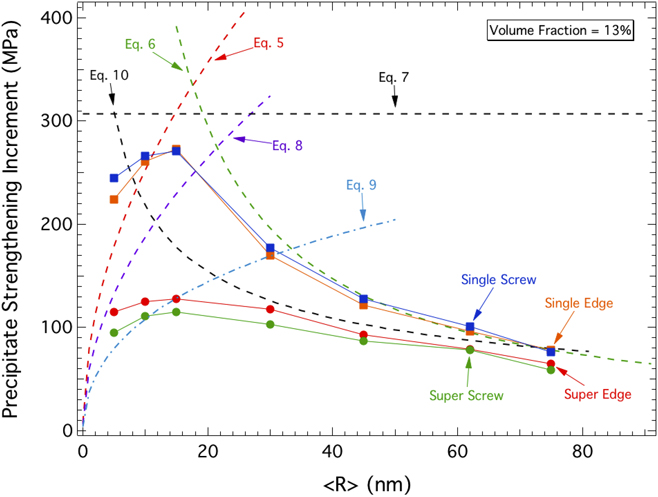
In the overaged region, the closed-form solution associated with the Orowan bypass mechanism [Eq. (6)] accurately captures the trend of the simulated results with excellent agreement at precipitate radii greater than 30 nm. The higher level of agreement between analytical solution and simulated results in the overaged region is expected, as Mohles et al. have shown that the effects of the periodic boundary condition has its greatest impact at smaller radii.
Reference Mohles18
Nembach reports,
Reference Nembach11
the constant value
 $\tau _{\rm{p}}^{{\rm{square}}\;{\rm{lattice}}}$
in Eq. (7) is derived from the maximum force F
0 = 2γωr
r of the average obstacle and the minimum distance L
min between the particles if they were arranged in a square lattice. Since the inputs are independent of the line tension or energy and are based on the elastic interaction between dislocations, Eq. (7) serves as an upper limit for τp and is in good agreement with the highest simulated value.
In the case of super-dislocation pairs, both Eqs. (8) and (9) are plotted in Fig. 5 to compare with the simulated results for small particle radii (〈R〉 < 15 nm). While the analytical solution modeling alloys with high volume fractions [Eq. (9)] best matches the simulated data, Eq. (8) is more appropriate due to the relatively low volume fraction (>20%) simulated in this study and has been used in previous work Reference Bocchini40,Reference Bocchini41 to model underaged super-dislocation results. Neither equation accurately matches the underaged or peak-aged behavior of the simulated results, with Eq. (9) unable to capture the trend of the data and Eq. (8) over-predicting the simulation results. The inability of the analytical solutions to accurately model the behavior of both types of super-dislocations at the peak strengthening condition has also been reported for other systems. Reference Krug, Mao, Seidman and Dunand39,Reference Bocchini40 This discrepancy may be due to numerous simplifying assumptions used when formulating the analytical solutions, such as the effect of the periodic boundary condition mentioned above. In the overaged region, Eq. (10), models closely coupled dislocations shearing the same particle and accurately describes the simulated results for super-dislocation pairs at large radii (〈R〉 > 30 nm), although the simulations show evidence of Orowan looping as well as closely coupled shearing.
C. Comparison between simulations and experimental hardness measurements
The simulation results are compared to room-temperature hardness data measured on a ferritic superalloy with composition Fe–10Ni–10Cr–6.5Al–3.4Mo–0.25Zr–0.005B wt% (labeled FBB8); the alloy was aged at 700 °C for various times to achieve a range of average radii of NiAl β′ precipitates with a near constant volume fraction ϕ ∼ 15%, as measured by TEM and USAXS. Reference Sun, Song, Ilavsky and Liaw48 The APB energy of the NiAl β′-phase in the alloys was set equal to 200 mJ/m2 from data of a ternary Fe–Ni–Al alloy. Reference Campany, Loretto and Smallman52 ΔHVSS from Eq. (3) was chosen to be 275 HV, which is the solid solution hardening contribution of Fe–12.4 at.% Cr, Reference Rosenhain55 and in general agreement with the matrix composition of the studied alloy (Fe–11.9Cr–7.2Al–3.1Mo–3.0Ni at.% or Fe–11.3Cr–5.4Mo–3.5Al–3.2Ni wt%) Reference Teng, Miller, Ghosh, Liu, Huang, Russell, Fine and Liaw45 ; it is a lower bound, since it does not take into account the solid solution hardening effect of the Al, Mo, and Ni. A strengthening superposition exponent, k = 1, is used as it was previously shown to be an accurate exponent for combining the strengthening of strong and weak obstacles as long as the number density of weak obstacles (in this case, solid solution atoms) is much greater than the strong obstacles (precipitates). Reference Nembach11,Reference Ardell, Munjal and Chelman60 The value of k depends on the relative strength and number density of the obstacles present in the system as well as the system itself, as reviewed by Krug et al. Reference Krug, Mao, Seidman and Dunand39
1. Simulations of ferritic superalloys
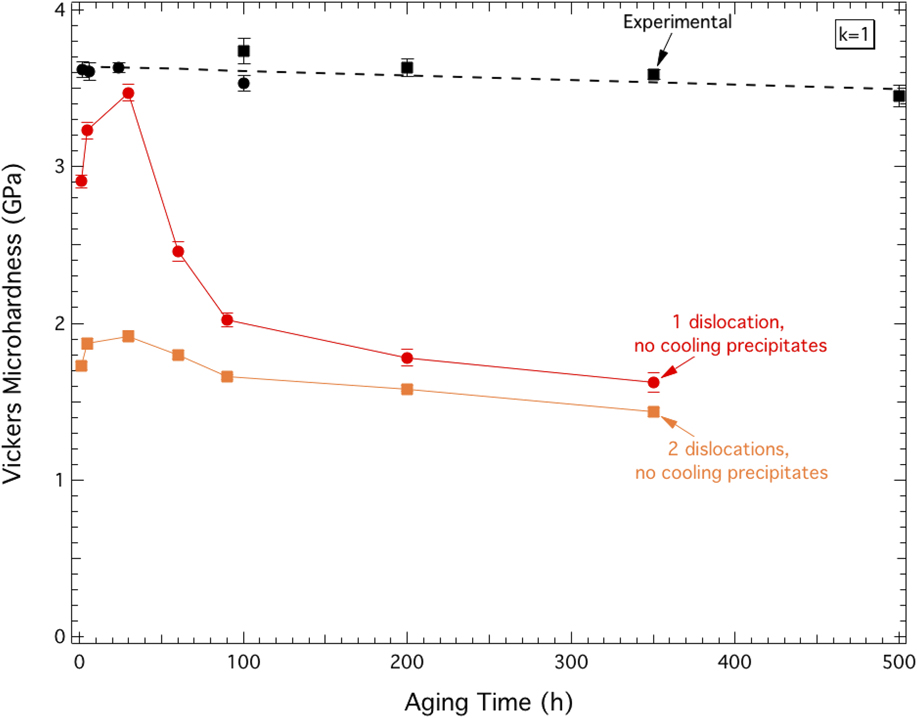
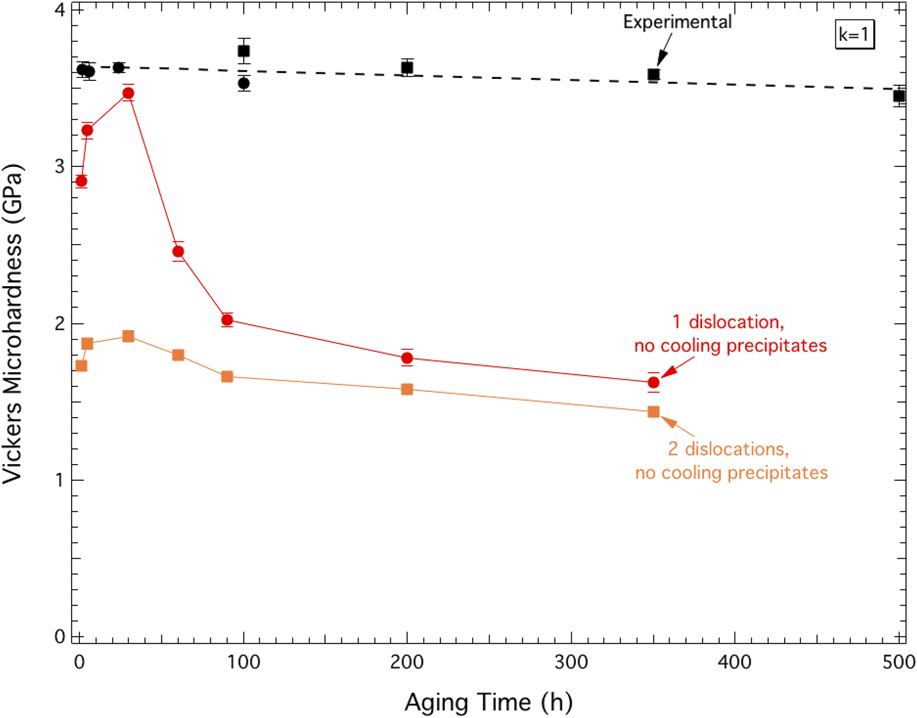
The average precipitate radius used in the DD simulation ranges from 5 to 75 nm with ϕ = 13%, as compared to experimental data for FBB8 with 〈R〉 = 5–105 nm depending on aging time (from 0 to 695 h) at 700 °C and ϕ ∼ 15%. Reference Sun, Song, Ilavsky and Liaw48 Figure 6 shows the simulated hardness values as a function of aging time, using Eq. (3) to convert from simulated Δτp to hardness. As expected from Figs. 3–5, the simulation results exhibit the characteristic hardness increase followed by a peak and sharp decrease as aging time and, thus, average radii, increase. Plotted in Fig. 6 are the experimentally obtained hardness values for the FBB8 alloy measured in the present investigation, as well as those reported by Sun et al., Reference Sun, Song, Ilavsky and Liaw48 which remain remarkably unaffected by aging time. It is apparent that the predictions from the super-dislocation simulations (with under-, peak- and over-aging) do not accurately model the experimental data (showing no effect of aging time), even if the peak hardness results from the simulation using a single dislocation predict a maximum value of ∼3.5 GPa, in the same range as the experimental values. The experimental hardness independence from aging time is unexpected given the marked coarsening of the primary precipitates and is thus most likely due to the presence of secondary precipitates formed on cooling after aging that reinforce the matrix independently of aging time, as discussed in below.
Predicted microhardness from DD-simulations performed with one (red circles) and two (orange squares) dislocations as well as experimental (black) results for Vickers microhardness data from Fe–10Ni–10Cr–6.5Al–3.4Mo–0.25Zr–0.005B wt% aged at 700 °C are plotted as a function of aging time. Solid black circles correspond to data obtained for the present publication, while solid black squares are data obtained from Ref. Reference Sun, Song, Ilavsky and Liaw48.
2. Simulations of cooling precipitates
The formation of Al-rich NiAl secondary precipitates on rapid cooling after aging was shown to have considerable effects on the room-temperature hardening of FBB8. Sun et al. have reported calculated hardening contributions from primary B2 precipitates as well as secondary cooling precipitates to compare to experimentally obtained hardness measurements.
Reference Sun, Song, Ilavsky and Liaw48,Reference Raynor and Silcock59
They report that, for samples cooled to room temperature from 700 °C, the cooling precipitates have an average radius of 1.5 nm and a volume fraction of 3.5% with small variations depending on the cooling rate.
Reference Sun, Song, Ilavsky and Liaw48
The DD simulated hardness contributions due only to the cooling precipitates with radius 〈R〉 = 1.5 nm and volume fractions ϕ = 4% is 445 MPa, obtained by simulating a field containing only cooling precipitates to determine a strengthening increment,
 $\tau _{\rm{p}}^{{\rm{cool}}}$
, which was converted using Eq. (3) into hardness. This value over-predicts the experimentally obtained hardness contribution (322 MPa) of the cooling precipitates previously reported.
Reference Sun, Song, Ilavsky and Liaw48
To account for the presence of these cooling precipitates, a modified version of Eq. (3) is used to integrate the strengthening contributions of the two precipitate populations. Previously, two separate studies on Al–Cu–Mg alloys Reference Vo, Liebscher, Rawlings, Asta and Dunand61,Reference Mohles62 used a combination approach to quantify the strengthening of two types of precipitates. Similarly, in an Al–Cu–Li system, the contributions of two distinct precipitate populations were combined by use of the following equation Reference Khan, Starink and Yan66,Reference Gilmore and Starke67 :
 $${\rm{HV}} = {\rm{H}}{{\rm{V}}_{{\rm{Fe}}}} + {\left\{ {{{\left( {\Delta {\rm{H}}{{\rm{V}}_{{\rm{SS}}}}} \right)}^{{k_1}}} + {{\left\{ {{{\left[ {{{\left( {{\rm{CM}}{\tau _{\rm{p}}}} \right)}^{{k_2}}} + {{\left( {{\rm{CM}}\tau _{\rm{p}}^{{\rm{cool}}}} \right)}^{{k_2}}}} \right]}^{{1 \over {{k_2}}}}}} \right\}}^{{k_1}}}} \right\}^{{1 \over {{k_1}}}}}\quad ,$$
where HVFe and (ΔHVSS) are the same values as reported in Eq. (3), τp is the DD-predicted yield stress contribution due solely to the primary precipitate population,
 $\tau _{\rm{p}}^{{\rm{cool}}}$
is the predicted yield stress increment from the DD simulation for the case of a matrix containing solely cooling precipitates bypassed by a screw-type, super-dislocation and is equal to 50 MPa, k
1 = 1 and k
2 = 1.2 for the under- and peak-aged conditions or k
2 = 1.4 for the overaged conditions, respectively. These k
2 values are in agreement with the values for summation exponents that best fits experimental data for Ni-based superalloy systems under similar aging conditions.
Reference Dong, Nogaret and Curtin63,Reference Song, Sun, Li, Xu, Rawlings and Liebscher64,Reference Genevois65
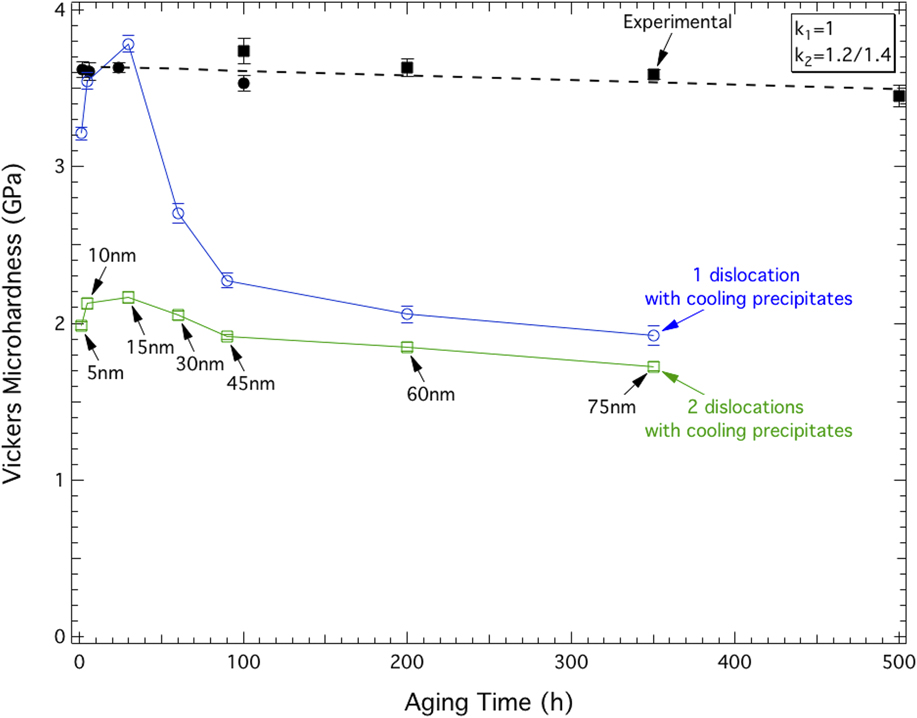
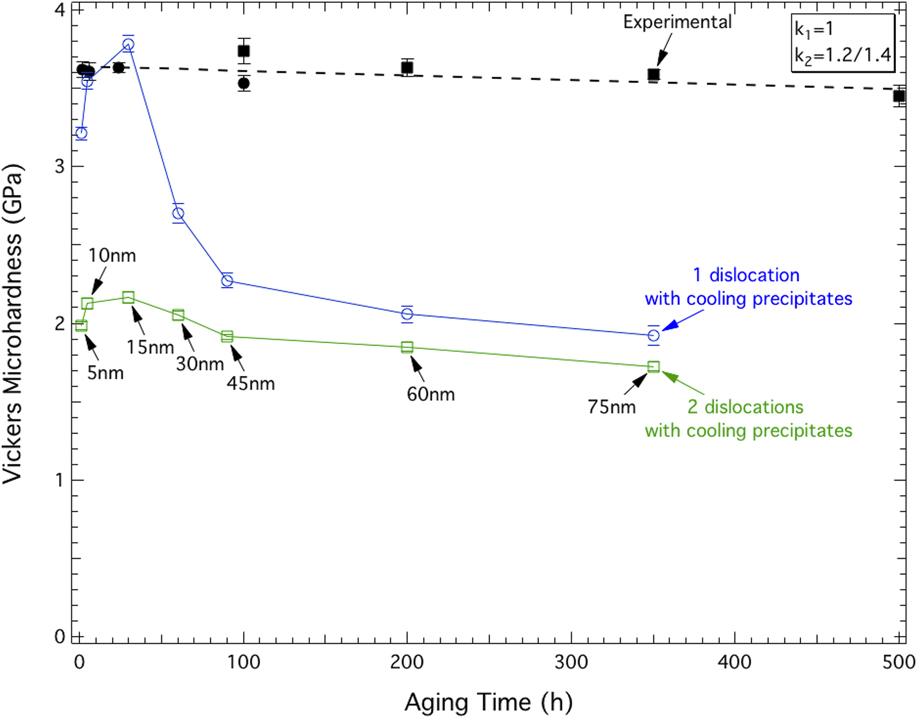
Figure 7 displays the predicted hardness values plotted as a function of aging time due to the combined strengthening effects of both primary and secondary precipitates, each simulated separately and combined via Eq. (11) with the experimentally obtained FBB8 hardness results plotted for comparison purposes. With incorporation of the strengthening effects due to the cooling precipitates, the predicted peak hardness for the single-dislocation simulations, occurring at an aging time of 30 h (〈R〉 = 15 nm), is on par with the experimentally obtained hardness values reported in Ref. Reference Sun, Song, Ilavsky and Liaw48. In addition, the predicted peak hardness results from Eq. (3), taking only into account the larger B2 precipitate population (shown in Fig. 6), and the results from Eq. (11), integrating the effects of the cooling precipitates as well (Fig. 7), effectively provides a lower and upper bound, respectively, between which most of the experimental hardness data are found. This speaks not only to the importance of incorporating the additional strength due to the cooling precipitates into the hardness calculations but also the DD simulations’ ability to give a range of predicted hardness that can capture experimental results. At aging times greater than 30 h, however, there is a steep decline in predicted hardness which is not present in the experimental data and is grossly under-predicted at long aging times. It is important to note that the experimental lack of hardness loss is unexpected, given the very significant coarsening of the primary precipitates from 5 to 75 nm when aging from 0 to 350 h.
Microhardness from a summation, using Eq. (11), of strengthening contributions from primary β′(B2)–NiAl precipitates and secondary Al-rich NiAl precipitates (formed on cooling) as predicted by DD-simulation performed with one (blue open circles) and two (green open squares) dislocations as a function of aging time. In addition, experimental (black) results for Vickers microhardness data from Fe–10Ni–10Cr–6.5Al–3.4Mo–0.25Zr–0.005B wt% aged at 700 °C are plotted. Solid black circles correspond to data obtained for the present publication while solid black squares are data obtained from Ref. Reference Sun, Song, Ilavsky and Liaw48.
The discrepancy between the simulated and experimental hardness results, Fig. 6, necessitates a closer examination of the strengthening phases, namely the primary B2-type precipitates. A composition of Ni–44Al–13Fe–1Cr–1Mo at.% for the large B2 precipitates present in the above alloy composition has previously been reported after an aging time of 100 h, Reference Teng, Miller, Ghosh, Liu, Huang, Russell, Fine and Liaw45 corresponding to a precipitate radius of 60 nm, in the overaged region. Thus, the precipitates are far from the equiatomic, stoichiometric NiAl composition modeled in the DD simulation, and, in fact, contain a significant amount of alloying elements, in particular Fe. Pike et al. have shown that the hardness of the monolithic NiAl B2 phase increases dramatically when Fe is in solid solution in NiAl, by as much as 1 GPa for 10 at.% Fe, due to an increase in vacancy concentration. Reference Pike, Chang and Liu70 Thus, the shearability of the Fe-containing precipitates in the alloy is certainly less than modeled, implying that the DD-calculated hardnesses are too low. It is not currently possible to integrate this effect into the simulations, since the amount of Fe present in the NiAl precipitates (which probably increase with aging time as the precipitates coarsen and converge toward their equilibrium composition) is unknown; also unknown is the effect of Fe on the APB energy of the NiAl precipitates. It is likely, however, that DD-calculated hardness values will significantly increase, especially at prolonged aging times (where the discrepancy between simulations and experiments is highest), when Fe has been fully incorporated into the NiAl precipitates, no later than the 100 h aging time for which it is known that 13 at.% Fe is present within the precipitates.
IV. SUMMARY
2-D DD simulations were performed to model the yield stress of a ferritic matrix with B2–NiAl precipitate volume fractions ranging from 10 to 20% and average radii 〈R〉 between 5 and 75 nm, representative of the ferritic superalloys FBB8 (Fe–10Ni–10Cr–6.5Al–3.4Mo–0.25Zr–0.005B, wt%). The simulations allow for a study of dislocation–precipitate interaction providing a prediction for the strengthening increment due to precipitation, τp. The following observations were made:
-
(1) Three distinct regimes were identified for single dislocations gliding through a field of precipitates: (a) shearing of small precipitates, (b) combined shearing/looping of intermediate-size precipitate, and (c) looping around large precipitates. The relative strengthening of these regimes follows (b) > (a) > (c).
-
(2) Two distinct regimes were identified for super-dislocations (pair of dislocations gliding together): (a) weakly coupled and strongly coupled pairs with leading and trailing dislocations shearing precipitates and (b) decoupled with the leading dislocation looping around precipitates and leading and trailing dislocation in close proximity to one another. The relative strengthening of these regimes typically follows (a) > (b).
-
(3) Super-dislocations can more easily bypass obstacles than single dislocations, likely due to the strong repulsive interdislocation force, which occurs when two dislocations are forced in close proximity to one another assisting the leading dislocation through an obstacle field. Meanwhile, the trailing dislocation shears the precipitates more easily because it eliminates the APB created by the leading dislocation.
-
(4) Super-dislocations, which are expected in this alloy, consistently predict lower strengthening contribution than single dislocations, which are unlikely to exist in this alloy.
-
(5) Closed-form analytical solutions capture the magnitude but not the evolution of the strengthening contribution from DD simulated results for small 〈R〉 for the underaged conditions; both the magnitude and evolution are captured for large 〈R〉 corresponding to the overaged condition, but they do not accurately depict peak-aging τp behavior.
DD yield stress predictions, converted to hardness values, were compared to experimentally obtained hardnesses on the ferritic superalloys FBB8—whose B2 precipitate morphology, size and volume fraction were determined experimentally as a function of aging time at 700 °C—with the following results:
-
(1) The experimental hardness values are remarkably insensitive to aging time, up to the longest time of 350 h, as the precipitate radii 〈R〉 are observed to grow from 5 to 75 nm. By contrast, the simulated hardness values from primary B2 precipitates follow the expected trends: (i) increase in hardness at early aging time (〈R〉 below 15 nm), (ii) a peak (〈R〉 = 15 nm), and (iii) a decrease in hardness (up to 〈R〉 = 75 nm) at prolonged aging times. Only the DD-predicted peak harnesses is in good agreement with the experimental data (i.e., HV ≈ 3.6 GPa).
-
(2) The hardness contribution of secondary, Al-rich B2–NiAl precipitates (with 〈R〉 = 1.5 nm and ϕ = 3.5%, formed upon cooling after aging) was calculated with the DD simulation and was combined with previous simulated hardness values for primary B2 precipitates using a modified hardness conversion equation [Eq. (11)]. Predictions for the underaged state are improved and relatively close to the measurements, but for the overaged condition (≥30 h), the lack of hardness drop, measured experimentally despite the observed precipitate coarsening, is not captured by the simulations.
-
(3) The unexpected observation of lack of hardness loss, despite the measured coarsening of the primary precipitates from 5 to 75 nm, is hypothesized to be due to solid solution strengthening by Fe of the primary NiAl precipitates; its contribution may increase with aging time, thus counterbalancing the decrease of strength due to coarsening.
ACKNOWLEDGMENT
This research was supported financially by the US Department of Energy (DOE), Office of Fossil Energy, under Grant DE-FE0005868 (Dr. V. Cedro, monitor).