

Introduction
The purpose of this paper is to use a living standards method to estimate the extra costs for older people with disabilities in urban areas in Northern China, to inform policies about adequate support to older people with disabilities. China's population is ageing quickly. The number of older people aged 60 years or older, which is the definition for ageing policies in China, has increased at a rate of 8 million per year since 2008. At the end of 2008, the number of older people reached 160 million, 12 per cent of the total population (BNS, 2009). It is predicted that the number will reach 200 million in 2014, 14 per cent of the total Chinese population (CWCA, 2007).
The fast population ageing challenges China's social policies. One important issue related to population ageing is the increase in the number of older people with functional disabilities. In 2006, 74.8 per cent of older people had self-reported chronic diseases, which were likely to lead to functional disability. The number of older people in China with disabilities reached 44 million in 2006 (Guo and Chen, Reference Guo and Chen2006). It is predicted that the number will increase dramatically in the next a few decades. Providing care and support to older people with disabilities is a challenge facing China's society and the state.
A social perspective of disability views disability as exclusion from mainstream society experienced by people with impairments as a result of prejudice and discrimination, at cultural, social and institutional levels (Shakespeare, Reference Shakespeare2006; Burchardt, Reference Burchardt2004). Policy to support the rights of people with disabilities includes support services and financial support to address the costs of disability to older people and their families. If the additional costs of disability fall entirely on the person or the family, they can have a profound impact on living standard. In order to reach the same living standard as that of a household without an older person with disabilities, a family needs extra income or services to cover the disability related costs.
Estimating the cost of disability informs policy about adequate income and other support to older people and their families, but this question has not been addressed systematically in the Chinese social policy context. This article fills that gap by using the living standards method to estimate the extra cost of functional disabilities.
Tibble (Reference Tibble2005) indicates four approaches to calculating the costs of disability, including budget standards, living standards, comparative and subject approaches, and discusses their limitations. Saunders (Reference Saunders2006) discusses the living standards approach in detail, including both its limitations and benefits. The approach has not been used to estimate the costs of disability in China. The research team used multiple methods to estimate the costs of disability in China to inform policy change. In this article, we present the results of the living standards analysis.
Background definitions
Functional disability
In a social services context, disability refers to the level of inequality in achieving life goals and social participation that people with disabilities experience as a result of an inadequate service system and discrimination (Shakespeare, Reference Shakespeare2006; Burchardt, Reference Burchardt2004). Impairment refers to functional disability, which means any impairment that results in a significant difference in body function or structure that has the potential to limit individual activity and ability when undertaking personal and social roles in the absence of support (World Health Organisation, 2001). The theoretical background to this paper acknowledges both the importance of understanding disability as a social phenomenon as described above while also recognising the lived experience of physical impairment and how it impacts on social and community participation, or, in Shakespeare's (Reference Shakespeare2006) terms, the ‘mixed-model’ of disability. For the purposes of analysing costs, this paper adopts the operational definition used by Wan et al. (Reference Wan, Manisha, Zhang and Guo2007), which puts the limitations in into three categories: limitations in activities of daily living (ADL), limitations in physical mobility and limitations in instrumental activities of daily living (IADL). The research also took account of the different impacts on living conditions of functional disability between developed countries and China, which were identified by Zhan and Montgomery (Reference Zhan and Montgomery2003).
Limitations in ADL are a scale used in the evaluation of functional disabilities (Wan et al., Reference Wan, Manisha, Zhang and Guo2007: 17). The ADL includes five activities: eating, putting on clothes, using the toilet, getting into and out of bed and bathing/showering. Limitations in physical mobility, similar to the situation-free limitations identified in 1965 by Nagi, include five items: walking over 1,500–2,000 metres, moving indoors, going up and down stairs, using the telephone and travelling by bus. Limitations in IADL include six activities: cleaning the floor, shopping, cooking, washing clothes, lifting 10 kilograms and family financing. Each limitation is evaluated with a value of 1, 2 or 3; where 1 means easy, 2 is difficult and 3 is impossible. In this article, an older person was identified as having a functional disability if the self-reported value of one or more limitations was 2 or 3.
What are the costs of disability
The extra costs experienced by older people with disabilities have three parts. The first is the direct cost due to functional disabilities, such as the cost for treatment, special care, special services and aid devices. The second is the added cost of daily living specific to functional disabilities incurred as a result of unsuitable or discriminatory social service practices and policies, such as the cost of food, housing, transportation and communication, which may be higher than the cost for people without functional disabilities. The third is the opportunity cost, such as other family members’ income reduction due to supporting the older person. The estimate in this paper includes the direct costs and additional daily living costs only. Although it does not include the opportunity cost, it is likely to be high in some households. The research employs an ‘expenditure equivalence’ approach to understanding the extra costs of disability (Stapleton et al., Reference Stapleton, Protik and Stone2008). The main feature of this model is asking the question: how much additional economic capital is required by a person with a disability to participate in basic activities of daily living and achieve a base level of wellbeing compared to a person without disabilities. The use of this model is consistent with international literature using a best practice analytical approach to the costs of disability (Stapleton et al., Reference Stapleton, Protik and Stone2008).
Living standards method
The living standards method estimates the extra income needed by people with disabilities to reach the same living standard as people without disabilities by using income data and other information to directly measure living standards and by associating the income, disability conditions and other variables (Saunders, Reference Saunders2006).
Before using the living standards method, there are two issues to be addressed. First, the living standards of families with older people with disabilities need to be determined. Older people in families with different living standards have different levels of consumption expenditure, and this is also true for families with older people with disabilities. The extra expenditure for older people with disabilities will not exceed their family income. Second, the factors that influence the extra expenditure of the older people with disabilities need to be identified. The types and levels of expenses for older people with disabilities depend on multiple factors, such as types of living arrangements, the size of households and the categories and degree of their functional disabilities. The family income level influences the family living standard because a family with a higher income level has the potential for a higher living standard.
Having a family member with a functional disability influences the living standard of the whole family. Without support and on the same level of income, a family with an older person with a disability will have a lower living standard than a family without one because the interaction between functional disability and an inadequate service system causes the extra cost to fall on the household, leaving less money for other commodities and services. To reach the same living standard as that of a family without an older person with a disability, a family would need additional income or support to cover the extra cost (Burchardt and Zaidi, Reference Burchardt and Zaidi2005; Indecon International Economic Consultants, 2004; Poland and Seth-Purdie, Reference Poland and Seth-Purdie2005). This article measures this extra cost.
If it is expressed in a functional relationship, the basic principle of the living standards method is that the family living standard is a function of income and demand. At a certain level of income and with other variables controlled, the extra cost to offset disability can be derived from a comparison between the living standards of families with older people with disabilities and the living standards of families without older people with disabilities.
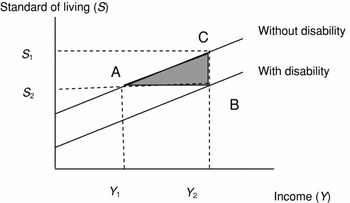
Figure 1 shows the basic principle of the living standards method. The line AC shows a positive correlation between income and living standard, meaning that living standard goes up as income increases. When the income level is at Y 2, the relevant dotted line intersects the line AC at C, indicating S 1 as the living standard of families without disabled members. For families with members with disabilities, however, the line AC moves downwards to intersect the dotted line at B because the extra cost of disabilities lowers the living standard from S 1 to S 2 while the income level is unchanged. The distance between B and C shows the difference in living standard. Additionally, the extra cost for disabilities lowers the income level from Y 2 to Y 1. In order to reach the same living standard as that of a family without a member with disabilities, a family will need an extra portion of income of Y 2 − Y 1, which is the distance between A and B. This distance is the extra cost for disabilities, or the extra portion of income needed to counterbalance the negative effect imposed on living standard by disabilities. This negative effect can be estimated from the lines AC and CB, that is AC = CB/AB. By using the regression technique, the slope of AC and the line displacement of CB can be calculated, and the extra cost for disabilities can be determined (Saunders, Reference Saunders2006).
Standard of living, income and disability.

We use a basic mathematics model for the living standards method to express this relation as follows:

where:
S is an indicator of the standard of living;
Y is household income;
D is a dummy variable used to express the status of disability;
X is a vector of the structure of the family;
a, b and g are coefficients to be estimated; and
k is a constant.
In this model, b represents the distance between the two lines (BC), and a represents the slope of the lines (a = BC/AB). Therefore, b/a = BC/(BC/AB) = AB, which is the extra cost for disabilities.
The extra cost of disabilities is calculated as E in the following equation:

Dataset
The data in this paper are sourced from the Follow-up Survey of the Elderly Population in Urban and Rural China 2006 (Guo and Chen, 2006). The samples are selected from the 31 provinces, autonomous regions and municipalities in China. The samples surveyed are distributed in 20 of the 31 provinces, autonomous regions and municipalities. Representation of the samples – a design of stratified, staged sampling is adopted in the survey – and a method of systematic sampling is used to select a similar sample in each province. A total of 1,000 older people are surveyed in each province: 500 in urban areas and 500 rural areas. Random sampling is used in sub-provincial areas. The results of the survey represent all provinces, autonomous regions and municipalities included in the survey. It covers 85 per cent of the total older population nationwide. The subjects of the survey are people aged above 60 years from 20,000 sampled households, with one older person interviewed in each household. A total of 20,000 individual survey questionnaires were distributed, with a response rate of 99.80 per cent (Guo, 2006). For reasons explained below, this article only calculates the living costs of urban older people in Northern China, which is a sample of 9,920 households (people). Half of the older people have disabilities (52.5 per cent) and over half of these are women with disabilities (58 per cent).
In the national survey, the 20 provinces, autonomous regions and municipalities are grouped into six categories based on their geographical regions.1 The article analyses Northern China (Beijing city, Hebei and Shanxi provinces) because the living standards there are just above the medium level among the six regions in China and social security coverage for disability is at similar level in the three provinces (Li and Li, Reference Li and Li2008).
The results for the other regions are too detailed to present in full here. Our in-depth interviews suggest that, although the living standards in the locations are different, the difference in the costs of functional disability between areas is not as large as differences in other living costs. Other research (Li and Li, Reference Li and Li2008), including our field investigation found that given the large income inequality between rich and poor households, the vulnerabilities of the most disadvantaged groups, such as older people with disabilities, in different parts of China are similar. Because of this, the article focuses on Northern China only. The results of the other regional analysis will be published elsewhere.
Analysing the costs of disability
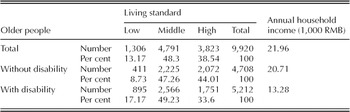
The descriptive analysis of the survey results suggests that the living standards of households with older people with disabilities are lower than that of the households without them (Table 1); nearly half the households with older people without disabilities have a high standard of living (44 per cent), compared to only one third of households with older people with disabilities (33 per cent). The annual mean income of households with older people without disabilities is 20,710 RMB, but that of the households with older people with disabilities is only 13,280 RMB. More analysis is required to determine whether the difference is caused by the costs of disability.
Living standard and family annual income of urban older people in Northern China

Model specification and variable selection
This paper uses a basic mathematics model for the living standards method that uses a multivariate measurement model to analyse the relations between living standard and income, disability characteristics and other variables, such as age, gender and the geographic location of families. In the model, the extra costs for older people with disabilities in different types of families are calculated through comparison of differences between these families.
The measurement model is specified as follows

Supposing that the error term ui is independent and normally distributed, the mean is 0, and the standard deviation equals to σ, hence the following:

The coefficients b 0, . . ., b 6 are parameters to be estimated, and i represents the family i.
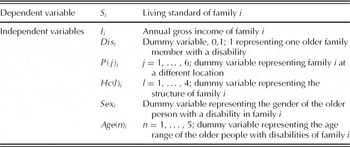
In the model, the dependent variable is the index of family living standards, and the explanatory variables, used as control variables, include family income levels, disability conditions, and other variables in terms of demographics and family characteristics. Variables in the model are defined as in Table 2.
Definitions of variables

Household income as an independent variable in the model is one of the key factors affecting living standards. The household income referred to in this study includes the gross income of all the family members living under the same roof and dining at the same table, and covers household income obtained from salary, investment, rent, social security, farming, forestry, animal husbandry, sideline production and fishery, among other variables.
In the regression analysis, the dependent variable – living standard – is not only affected by quantifiable variables such as annual gross household income, but also by qualitative variables such as gender, social stratum, location and people with disabilities in a household. These variables are represented by dummy variables. For instance, 1 represents that there is one disabled senior citizen in a household and 0 represents that there is no disabled senior citizen in a household.
Selecting explanatory variables is primarily determined by the importance of the relationships between the explanatory variables and living standard, income and functional disability. The explanatory variables contained in the finalised model are determined by their statistical importance.
Selecting living standards indicators
There are two principles in choosing living standards indicators. First, a living standards indicator is an objective value, and therefore the determination process of the indicator should be unrelated to the functional disability and be able to objectively reflect the living standards of all people. The other principle is that the living standards indicator should be sensitive to income changes. Food expenditure lacks elasticity, because there is a certain limit in people's need for food, and there is limited demand for essential food even when the income is very high. Hence, consumption of food is not sensitive to income changes. However, whether a household does or does not purchase durable goods is primarily influenced by income. Therefore, there is a positive correlation between the purchase of durable goods (as a composite indicator for living standards) and income. For instance, there is a greater possibility for a low-income family to purchase a television when its income has increased.
Berthoud et al. (Reference Berthoud, Lakey and McKay1993) has found that the composite indicator, based on the possession of seven types of durable consumer goods and five budgetary behaviours (e.g. ability of saving), is particularly useful. Burchardt and Zaidi (Reference Burchardt and Zaidi2005) have also used the combination of relevant variables of household possession of durable goods and savings to reflect living standards.
Constrained by survey data, the method of household consumer durable goods was adopted to assess living standards. Household consumer durable goods included: telephone, television, washing machine, mobile phone, electric fan, air conditioning, computer, refrigerator, microwave oven, water heater, electric radiator and electric blanket. These 12 types of household consumer durable goods were used as a composite indicator to assess the living standards of different households. For each household, the composite indicator of living standard was given a score, 1, 2 or 3, where the low living standard, rating 1, was three or less of the items in the household; the medium living standard, rating 2, was four to eight items; and the high living standard, rating 3, was nine items or more.
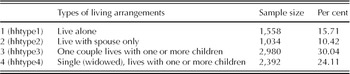
Households are grouped into four types according to their living arrangements in this study (Table 3).
Types of living arrangements of older people in urban areas and distribution

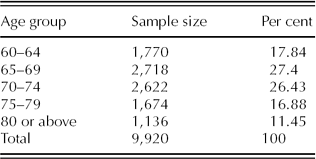
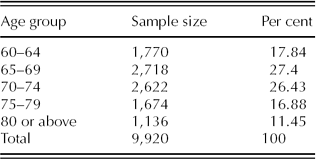
The consumption and expenditure of older people differs by age. The older they are, the less likely they are to leave their home, which increases care costs and decreases external activity costs. They are divided into five age groups for the analysis (Table 4).
Age groups of older people
An indicator of health care is not included in the analysis because health has already attracted considerable academic and policy attention. The government committed to providing universal health care for all Chinese citizens after the survey was conducted. Our future research will evaluate the impact of the new policy on the costs of disability and living standards of families with older people with disabilities.
Ordered logit model estimate
An ordered logit model is used to estimate the relationship between living standard and variables such as income level because the independent variable for the model is in the ordinal form, i.e. in the order of ‘low living standard’, ‘medium living standard’ and ‘high living standard’. Similarly, any explanatory variable without statistical significance was removed from the model to reach an ‘optimal balance’. To obtain the most suitable equation, we conducted a number of tests by removing variables from the logic sequence after the estimate was completed for the entire model.
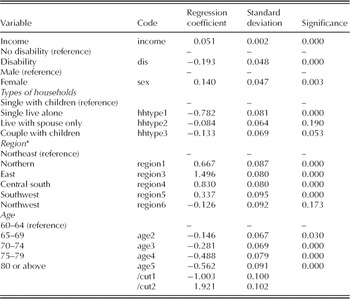
The estimate was completed by using a maximum-likelihood ordinal logit, with the results of the optimal model estimate shown in Table 5. There are 8,861 observed values for the model, the chi-square value is 2,649.65, Prob > chi2 = 0.0000. The model features significant integrity, and the simulated R2 = 0.1525, indicating that independent variables in the model explain well changes in the dependent variable.
Optimal model of ordered-logit regression

The estimated coefficient of the dummy variables for income is β 1 = 0.051, quite different from 0, bearing statistical significance. This also indicates that once income increases 1,000 RMB, the increase in log odds of living standard is 0.05, assuming other conditions do not change. The positive sign indicates a positive correlation between income and living standard.
The estimated coefficient of the dummy variables for functional disabilities is β 2 = −0.193.The negative sign indicates that there is a negative correlation between functional disability and living standard, since functional disability is associated with lower family living standard. The result supports the descriptive profile in Table 1.
In the interaction between living standards and household types, the absolute value of the estimated coefficient of the dummy variable for old people living alone is −0.782. This is higher than other household types, indicating that older people with disabilities who live alone have greater potential for their living standard to be negatively influenced.
The interaction between age and living standard shows the absolute values of the estimated coefficients of the dummy variables for the oldest age groups (75–79 and 80 years old or above) are −0.488 and −0.562, indicating that oldest people are more likely to have their living standard negatively influenced.
Extra costs of disability
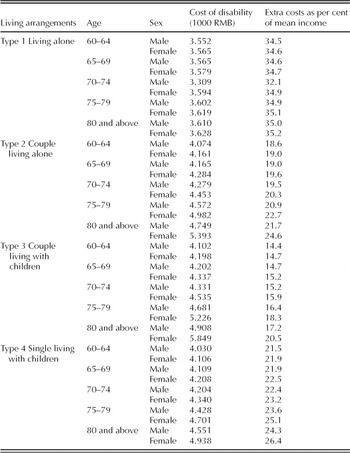
Finally, the model was used to calculate the extra cost of functional disability within different types of living arrangements and age groups by means of a regression model for older people with disabilities in Northern China (Table 6). For example, for older men with disabilities living alone aged 70–74 years to reach the same living standard as that of households of older people without disabilities, the men would need an extra 3,309 RMB income each year or the equivalent value of social service support. When all other conditions are fixed, the extra cost for women with disabilities is 3,594 RMB, which is even higher than for men.
Extra costs of functional disability for older people in urban areas in Northern China

Except for households where the older person lives alone, the extra cost for older people with functional disabilities increases with age, regardless of gender or household arrangements, especially for older people aged 80 years or above. From the perspective of gender, the extra cost for older women with disabilities is higher than for older men with disabilities.
With the same level of income for older people aged 75–79 years, the extra costs of support required by older men living alone is 3,602 RMB and considerably less than other household types (couple alone 4,572 RMB; couple with children 4,681 RMB; and single with children 4,428 RMB).
Household type also has an impact on costs of disability. For men aged 70–74 years, the extra costs estimated is about 32.1 per cent of mean household income of this type of living arrangement, higher than for men in other living arrangements (couple alone 19.5 per cent of household income; couple with children 15.2 per cent; and single with children 22.4 per cent). The regression model (Table 5) and calculation of the extra cost (Table 6) both indicate that the living standards of older people with disabilities living alone are most likely to be negatively influenced by the shortcomings in the disability service system.
The findings suggest that although the older people living alone have lower extra costs than other people, the extra cost as percent of income in the group is higher than for other people. This is because the mean income of this group is lower than other groups of older people, and the extra costs of disability unaccounted for by the service system for older people who live alone is higher than for people who live in other household types.
Policy implications
Policy implications from these findings are firstly, the research provides evidence that functional disability comes with high costs. Without sufficient support to families of older people with disabilities in China, families bear most of the costs of disability. This means that the cost of functional disability for older people with disabilities has a financial impact on the living standards of families with older people with disabilities. With the same level of income, families of older people with disabilities have lower living standards than families without, due to the extra costs of addressing the functional disability, leaving less money for purchase of commodities and services. This exerts social and financial pressure on older people with disabilities, their families and communities. It has implications for social policy responsibilities, especially in view of China's rapidly ageing population. Without government support, older people with disabilities and their families are more likely to experience poverty and social exclusion. However, the implications of the costs of disability have not attracted enough policy attention in China. Policy debates about the impact of the shortcomings of current disability support policies on the rights of older people with disabilities and their families remain a low government priority.
The second implication of the analysis is that the types of living arrangements have a significant impact on the extra costs of disability, especially for older people who live alone. Income sources are fewer and people to provide care in the home are fewer for older people who live alone, yet the extra cost of disability as a percent of their income is higher for them. Policy implications are that this group of older people with disabilities needs additional income and service support compared to others.
Thirdly, the research found that the extra cost for functional disability increases as older people with disabilities grow older, especially for people aged 80 years or above. This finding suggests that not only living costs but also the cost of disability for this group of older people should be included in the social policy consideration.
Finally, the extra cost of disability for families with older women with disabilities is higher than those with older men in urban Northern China. On the one hand, because older women get less pension than older men, this makes the living standards of the older women lower. On the other hand, because older women with disability receive less home care from family members than men, this makes the extra cost for older women higher. This result indicates that gender is an important policy consideration affecting the extra cost of disability.
Future research could examine the extra costs for older people with disabilities in different household types and in different regions by applying the same methods. This paper focuses on the extra cost for older people with disabilities in Northern China, where the living standard is at the medium level among the six regions in China. In this paper, types and degree of disability of older people were considered, but the calculation was simplified to analyse only whether any disability existed or not.
Acknowledgement
The study was funded by the Australian Research Council and the China Research Center on Aging.