Implications
Cubicle dimensions in relation to the cow's body dimensions in practice do not often comply with recommendations. Nevertheless, teat and teat tip cleanliness are frequently unsatisfactory. This situation can be improved through adequate management such as better cubicle maintenance and bedding regime.
Introduction
Dirty udders result in a higher workload in terms of udder cleaning before milking (Bernardi, Reference Bernardi2008) and may constitute a risk for udder health (Schreiner and Ruegg, Reference Schreiner and Ruegg2003; Reneau et al., Reference Reneau, Seykora, Heins, Endres, Farnsworth and Bey2005). Therefore, in a number of experimental studies, the impact of different housing and management aspects on udder cleanliness has already been investigated. The type of cubicle flooring (Chaplin et al., Reference Chaplin, Tierney, Stockwell, Logue and Kelly2000; Fulwider et al., Reference Fulwider, Grandin, Garrick, Engle, Lamm, Dalsted and Rollin2007), absence or presence of a brisket board (Tucker et al., Reference Tucker, Zdanowicz and Weary2006), neck-rail position (Tucker et al., Reference Tucker, Weary and Fraser2005; Bernardi et al., Reference Bernardi, Fregonesi, Winckler, Veira, von Keyserlingk and Weary2009; Fregonesi et al., Reference Fregonesi, von Keyserlingk, Tucker, Veira and Weary2009), type of bedding material (Magnusson et al., Reference Magnusson, Herlin and Ventorp2008; Norring et al., Reference Norring, Manninen, de Passillé, Rushen, Munksgaard and Saloniemi2008), as well as the degree of soiling of the passageway (Christiansson et al., Reference Christiansson, Bertilsson and Svensson1999; Magnusson et al., Reference Magnusson, Herlin and Ventorp2008) were found to influence cubicle and udder soiling. With regard to cubicle dimensions, it was found that restrictive cubicle dimensions result in cleaner stalls (Tucker et al., Reference Tucker, Weary and Fraser2004, Reference Tucker, Weary and Fraser2005 and Reference Tucker, Zdanowicz and Weary2006), and therefore in cleaner udders (Bernardi et al., Reference Bernardi, Fregonesi, Winckler, Veira, von Keyserlingk and Weary2009; Fregonesi et al., Reference Fregonesi, von Keyserlingk, Tucker, Veira and Weary2009). However, this was not confirmed in observational studies. Neither Veissier et al. (Reference Veissier, Capdeville and Delval2004) nor Martiskainen et al. (Reference Martiskainen, Koistinen and Mononen2007) and Lombard et al. (Reference Lombard, Tucker, von Keyserlingk, Kopral and Weary2010) discovered any influence of cubicle dimensions on udder cleanliness. One reason for this discrepancy between experimental and observational studies might be a high interaction effect between the many different cubicle characteristics and further factors. In addition, interactions with the cows’ body dimensions may be influential. According to literature (CIGR, 1994; Bartussek et al., Reference Bartussek, Lenz, Würzel and Zucca2008), suitability of cubicle dimensions should be assessed in relation to the mean body dimensions of the 20% to 25% largest cows in the herd. Only Veissier et al. (Reference Veissier, Capdeville and Delval2004) followed these recommendations and classified cubicles into two categories: smaller or bigger than recommended, that is, whether they were at least 10% below or above the optimal value for the 20% tallest cows in the herd. Only in two of the experimental studies, information about body height and length was given (Tucker et al., Reference Tucker, Weary and Fraser2005; Fregonesi et al., Reference Fregonesi, von Keyserlingk, Tucker, Veira and Weary2009); however, it remains unclear if and how they have been used to define ‘restrictive’ cubicles.
Thus, the relationship between characteristics of cubicles, their management and passageway soiling on the one hand and udder or teat cleanliness on the other hand needs further investigation while taking body dimensions into account.
Regarding udder or teat cleanliness it is, additionally, questionable whether they should be treated without differentiation, as done in most studies (Cook and Reinemann, Reference Cook and Reinemann2007; Bernardi et al., Reference Bernardi, Fregonesi, Winckler, Veira, von Keyserlingk and Weary2009; Fregonesi et al., Reference Fregonesi, von Keyserlingk, Tucker, Veira and Weary2009). In some investigations, it is not transparent whether teats had been included in the udder scoring (Bowell et al., Reference Bowell, Rennie, Tierney, Lawrence and Haskell2003; Martiskainen et al., Reference Martiskainen, Koistinen and Mononen2007; Lombard et al., Reference Lombard, Tucker, von Keyserlingk, Kopral and Weary2010). Only few studies scored udder and teats separately (Magnusson et al., Reference Magnusson, Herlin and Ventorp2008; Norring et al., Reference Norring, Manninen, de Passillé, Rushen, Munksgaard and Saloniemi2008) or even assessed teat tip cleanliness (Christiansson et al., Reference Christiansson, Bertilsson and Svensson1999). Currently, there is a lack of information on associations between udder and teat or teat tip soiling. Zdanowicz et al. (Reference Zdanowicz, Shelford, Tucker, Weary and von Keyserlingk2004) did not find any clear relationship between udder cleanliness and bacterial counts of environmental pathogens on teat ends, which hints at a low correlation between soiling of the udder in general and soiling of teats or teat tips.
Therefore, it was the aim of this prevalence study to investigate the relationship between udder, teat and teat tip cleanliness and their association with cubicle characteristics and management factors on Central German dairy farms while taking the cows’ body dimensions into account.
Animals, materials and methods
On-farm data collection
On-farm data collection took place at the end of the winter housing periods, 2008 (March until early May) and 2009 (February until April), on dairy farms with cubicle housing located in Central Germany (Hesse, North Rhine-Westphalia, Lower Saxony). Before farm selection, a catalogue of requirements was assigned. It included a range in herd size from 30 to 120 lactating cows. Farms with more than 120 cows were excluded for the sake of feasibility regarding the measurement of the cows, because self-locking feed racks are mostly absent in such bigger herds. The Holstein–Friesian herds could either be black and white or red and white. Single cows of other breeds or crossbreeds were tolerated but not included in the study. Cubicles within farms were allowed to differ in length by a maximum of 15 cm and in width by 10 cm. Partition type, cubicle flooring, bedding material and neck-rail types had to be identical within each farm. Over 30 farms were visited, but only 23 farms fitted these strict requirements.
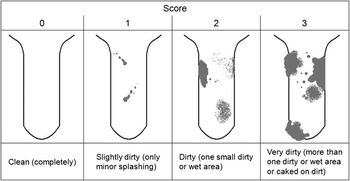
Each farm was visited once during the study, starting at morning milking. After the cows had entered the milking parlour and before preparation and cleaning of the udders, each teat of each cow present was scored individually on a scale ranging from 0 (clean) to 3 (very dirty; Figure 1). All teats with wet or dirty areas of a radius of more than 1 cm were scored as very dirty. In addition, it was assessed whether each teat tip was completely clean or dirty. After the attachment of the milking machine, the cow's abdomen and upper rear limb of the side facing the assessor, as well as the udder (lateral, rear and base) and the tail head (excluding the udder region) were scored regarding their cleanliness according to the scheme of Reneau et al. (Reference Reneau, Seykora, Heins, Endres, Farnsworth and Bey2005), but scoring from 0 (clean) to 4 (very dirty) instead of from 1 (clean) to 5 (very dirty). Throughout the study, all the cows were examined by the same person wearing a headlight to avoid an impact of lighting conditions on the assessment.
Teat cleanliness scoring scheme.

Cows in their colostrum period that were recently moved to the cubicle house (e.g. from a deep litter barn), heifers and other non-lactating cattle present in the main herd were excluded from cleanliness scoring.
A second person recorded the cubicle dimensions, further cubicle and housing characteristics (like cubicle and partition type, cubicle flooring, presence of a brisket board, bedding type and height of loose bedding). For each cubicle type, for example, head-to-head or single row cubicles, at least one cubicle from the middle part of each row, altogether five to six cubicles, were measured per farm and weighted mean values calculated. Cubicle hardness was subjectively scored after falling on the assessor's knees from a similar height that the cow would fall when lying down. For data analysis, the original 3-score key was dichotomised into the categories soft (painless/soft landing like landing on mattress or a minimum of 10 cm loose bedding) and medium or hard (unpleasant landing like on rubber foam camping mat or no voluntary knee dropping because of hard surface like concrete). Cubicle cleanliness was assessed in three categories with focus on the rear part of the cubicle: clean = dry and no or very few faeces present; medium = some urine and fresh or caked faeces present; dirty = wet and/or a lot of dry or caked faeces present.
After morning milking, all cows were locked in the feeding barrier in order to measure body dimensions, that is, height at withers (HW), diagonal body length and shoulder width in a random sample of cows. Necessary sample sizes for estimating prevalences were calculated using the programme Winpepi (Abramson, Reference Abramson2004) with an initial assumption of 50% prevalence, confidence interval of 95% and absolute precision of 5%. Consequently, 79% (at a herd size of 115 cows) to 100% of the cows (at a herd size of 30 cows) were measured. They were selected by releasing each xth cow from the feed rack according to the target number of cows, except for very large or small cows (then the next cow was released) so that the largest and smallest cows (visually assessed) were always included in the sample. Each selected cow was immediately released after the measurement.
Soiling of the feeding passage and passageways was assessed following Dippel et al. (Reference Dippel, Dolezal, Brenninkmeyer, Brinkmann, March, Knierim and Winckler2009) at the end of the farm visit at least 30 min after the last run of the scraper: a metal frame of 100 × 100 cm (1 m2), divided into nine segments, was placed on the floor every 5 m, keeping a distance of 2 m from the walls. Each section of the frame was classified as dirty if more than 50% of the surface was covered with faeces or slurry. Dirty segments were counted and summed up (score from 0 = all clean to 9 = completely dirty). The same was done for scoring the wetness of the passageways.
Furthermore, at the end of the farm visit, details on milking routine, cubicle maintenance and other operations were enquired by a questionnaire-guided interview with the farmer. This included estimates of the daily, weekly and monthly time spent for cubicle maintenance, which were summed up to the maintenance time per day in minutes and divided by the number of cubicles per farm.
Calculations on fulfilment of requirements regarding cubicle measures
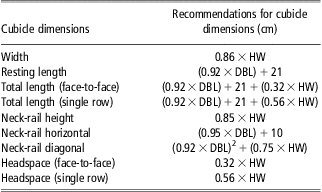
Relationships between cow and cubicle dimensions were calculated by applying the recommendations of Bartussek et al. (Reference Bartussek, Lenz, Würzel and Zucca2008). Following their instructions, the mean of the 25% largest animals of each herd in terms of the HW and the diagonal body length (DBL) was calculated. On this basis, farm individual target values were calculated for cubicle width, resting length, headspace, total length, neck-rail horizontal, as well as for neck-rail height and neck-rail diagonal (using Pythagoras’ theorem; Table 1). The degree of compliance with the recommendations was calculated for head-to-head and single row cubicles separately. To reach one value per farm, a weighted mean according to the proportion of the two cubicle types was used. If target and current values were equal, compliance was 100%. Smaller cubicle dimensions yielded values below 100% and larger cubicles yielded values above 100%.
Recommendations for cubicle dimension according to Bartussek et al. Reference Bartussek, Lenz, Würzel and Zucca(2008) considering body dimensions, namely HW and DBL

HW = height at withers; DBL = diagonal body length.
Statistical analysis
Possible relationships between cleanliness of udders, teats and teat tips were investigated using Spearman's rank correlation analysis.
Linear regression analyses were conducted using the PROC REG procedure with stepwise selection (SAS Version 9.2, SAS Institute) in order to identify risk factors for teat and teat tip dirtiness. The outcome variables were the percentages of teats per herd with score 2 and 3 and of dirty teat tips per herd, representing cows with undesirably soiled teats.
Preselection of independent variables for the multivariate regression modelling was carried out by univariate analyses: ‘Spearman's rank correlation coefficient r s’ for non-normally distributed and ‘Pearson's correlation coefficient r p’ for continuous normally distributed measures, as well as point biserial correlation coefficient ‘r pb’ for dichotomous in combination with metric variables and the Fisher test, respectively, for dichotomous variables. All predictors yielding values of P < 0.3 and additionally some potentially important factors according to the literature were presented to the regression modelling procedure. However, potential predictors that strongly correlated with each other (r > 0.70) were not included in the same model to avoid multicollinearity. In those cases the variable with the closer association to the dependent variable was chosen.
The limit for model entry was set at P = 0.3 and at P = 0.15 for variables to stay in the model. Predictors with P < 0.05 were regarded to be significant. Assumptions concerning normality (normal distribution) and homoscedasticity were met. Influence statistics were checked by looking at the studentized residuals and Cook's D. Collinearity within the data was checked using variance inflation factor and eigenvalues. When providing statistical dispersion, standard error was used.
Results
Descriptive statistics of the study herds
Average herd size was 59.5 cows (30 to 115 cows). Out of the 1369 cows and heifers present on the 23 farms, in total, data from 1171 and 1178 lactating Holstein cows (85.5%; 86.0%) were included in cleanliness scoring and measuring of body dimensions, respectively.
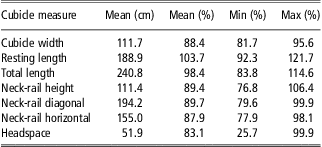
Ten farms had deep-bedded cubicles and 13 farms had raised cubicles, including three farms with curb. Compliance regarding cubicle width, neck-rail horizontal, neck-rail diagonal and headspace was below 100% on all farms (meaning that they did not comply with the recommendations of Bartussek et al., Reference Bartussek, Lenz, Würzel and Zucca2008), whereas for the other measures it varied between 76.8% and 121.7% (Table 2). Hard cubicle flooring was present in seven (rear part) and eight (front of cubicle) farms, respectively. Post milking teat dipping was performed on 14 farms. In 13 cases, the cubicles were considered to be clean cubicles. The bedding on 15 farms included any type of straw and three farmers did not use any bedding material. A brisket board was present on 15 farms.
Mean cubicle dimensions and compliance of cubicle measures with recommendations for the 25% tallest cows in the herd, respectively, providing mean, minimum and maximum compliance (n = 23 farms)

Average HW of all measured Holstein–Friesian cows was 142.3 ± 0.12 cm. A higher variation was observed in diagonal body length with a mean of 166.2 ± 0.22 cm. Shoulder width was on average 47.6 ± 0.13 cm (not used for further calculations). The average HW of the 25% largest animals in the herds was 146.9 ± 0.15 cm and 174.7 ± 0.23 cm for diagonal body length.
On average, 18.8% of the cows’ tail heads, 29.9% of the hindquarters, 16.5% of the abdomens and 11.1% of the udders were scored dirty or very dirty (scores 3 and 4). Including score 2 (moderately dirty), mean percentage of dirty udders was 52.2%. The mean percentage of dirty and very dirty teats (scores 3 and 4) was 56.0 ± 2.14%. The average percentage of soiled teat tips was 41.3% with a high standard error of 2.38.
Correlations between cleanliness measures
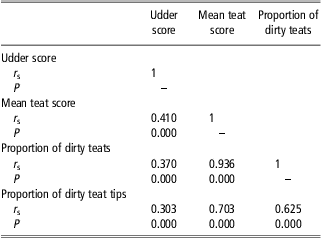
On the individual level (n = 1171 cows), measures of udder, teat and teat tip cleanliness were significantly correlated with each other (Table 3). On herd level, there was no significant correlation between the percentage of udders scored 2, 3 or 4 and the percentage of dirty teats (scores 2 and 3; r s = 0.231, P = 0.288) or the percentage of dirty teat tips (r s = 0.117, P = 0.595). Furthermore, the percentage of dirty teat tips was not significantly correlated with the percentage of dirty teats (r s = 0.223, P = 0.306).
Correlations between different hygiene scores with regard to specific udder areas on cow level (n = 1171 cows)

Spearman's rank correlation coefficient (r s) for udder score, mean teat score, proportion of dirty teats (teats scored 2 or 3 per all assessed teats) and the proportion of dirty teat tips (dirty teat tips per all scored teats).
Multivariate analyses of impacts on teat cleanliness
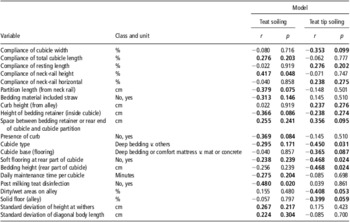
Six dichotomous and 11 metric variables, representing certain farm characteristics, were used for stepwise regression regarding possible effects on the percentage of dirty teats and teat tips. Correlations of dirty teats and teat tips, respectively, with potential predictors are presented in Table 4. Variables in bold were included in the analyses.
Correlation between cleanliness measures and housing and management characteristics as well as variation in body dimensions using Pearson correlation coefficient (r p) and point biserial correlation coefficient (r pb)

Figures in bold indicate predictor variables that were selected for the model (P < 0.3 or according to literature).
The final model for soiled teats contained four factors and explained 58.5% of the total variance (F = 6.34, P = 0.0023; Table 5). Significantly fewer dirty teats were predicted if compliance with recommendations for total cubicle length was lower, when teat dipping was carried out after milking and when a higher amount of time was spent for cubicle maintenance. The factor cubicle type also contributed to the model, with fewer dirty teats if deep-bedded cubicles were present. No influencing cases or problems with collinearity were found.
Final model of stepwise regression (PROC REG stepwise, SAS 9.2) with the dependent variable ‘percentage of dirty and very dirty teats’ including 17 independent variables (n = 23 farms)

Regarding the percentage of soiled teat tips, the final model explained 46.0% of the variance and included three variables (F = 5.39, P = 0.0075; Table 6). A significantly lower percentage of dirty teat tips was found with increasing bedding height at the rear part of the cubicle and with lower fulfilment of recommendations regarding resting lengths of cubicles. In addition, the factor dirtiness of the passageways contributed to the model. Contrary to expectations, higher passageway dirtiness tended to be associated with a lower percentage of dirty teats tips. Collinearity was not detected, but one influential case was found (student residual = 2.969, Cook's D = 0.461).
Final model of stepwise regression (PROC REG stepwise, SAS 9.2) with the dependent variable ‘percentage of dirty teat tips’ including 14 independent variables (n = 23 farms)

Discussion
Cow cleanliness was assessed in a number of observational studies, but all of them only analysed the impact of housing- and management-related factors on overall cow cleanliness or soiling of other specific body parts (e.g. Veissier et al., Reference Veissier, Capdeville and Delval2004; Martiskainen et al., Reference Martiskainen, Koistinen and Mononen2007; Ruud et al., Reference Ruud, Boe and Osteras2010). Compared with other parts of the body, a lower percentage of udders was found to be dirty, which conforms to other studies (Schreiner and Ruegg, Reference Schreiner and Ruegg2003; Veissier et al., Reference Veissier, Capdeville and Delval2004; Ruud et al., Reference Ruud, Boe and Osteras2010). Percentages in the present study were lower than that found by Schreiner and Ruegg (Reference Schreiner and Ruegg2003), who reported that 14.2% of udders were mostly covered with dirt and 7.4% were completely dirty, although comparability of results is slightly limited because of the different numbers of assessment categories used. Ruud et al. (Reference Ruud, Boe and Osteras2010), on the other hand, found much lower values (4.7% dirty and very dirty udders) from relatively small farms (38.6 cows/herd), which was attributed to improved individual cleaning and general care because of small herd sizes. In contrast to the findings regarding the udder, the ascertained percentages of soiled teats were high, with more than half of all teats found dirty or very dirty, and still more than 40% of teat tips soiled. Also Magnusson et al. (Reference Magnusson, Herlin and Ventorp2008) found relatively high teat soiling. On a continuous scale from 0 (completely clean) to 100 (completely covered with dirt), they found that on average about one-third of each teat including the teat tip (24.2% to 37.9%) was soiled.
Consequently, on an individual cow level, correlations between udder cleanliness score and percentage of dirty teats and teat tips were only low, but significant because of the high n. On herd level, correlations between percentages of dirty udders (scores 3 and 4) and teats or teat tips were even lower and not significant. According to these results, it appears necessary to differentiate between udder, teat and teat tip cleanliness or soiling. It can be expected that it is predominantly the soiling of teats and teat tips that carries a risk for invasion of environmental pathogens through the streak canal, and thus for mastitis. Furthermore, in terms of workload for udder cleaning before milking, teat and teat tip cleanliness is of particular concern. Therefore, we focused our analysis on teat and teat tip cleanliness expressed as percentages of dirty teats or teat tips.
By selecting farms without major changes in management or housing equipment within the last year before the farm visit and choosing the same point of assessment in time (before morning milking) in all farms, we tried to limit possible chance influences on cleanliness, for example, because of variation in cubicle maintenance. Moreover, no herd visibly suffered from pronounced acute diarrhoea. However, the assessments used in this study still reflect only the instantaneous state of the herds. In the future, it should also be investigated how repeatable such cleanliness assessments are over time. Another issue is the repeatability of assessments within or between assessors. Only one assessor performed each type of subjective assessment in this study, so that it can be expected that assessments were consistent in relation to each other, but caution is necessary when comparing results with other studies. Nevertheless, in general, it would have been favourable to control for possible misjudgements, even though the very few studies reporting inter- or intra-assessor reliability regarding cleanliness assessments did not reveal major problems in this respect (Faye and Barnouin, Reference Faye and Barnouin1985; Schreiner and Ruegg, Reference Schreiner and Ruegg2003; Reneau et al., Reference Reneau, Seykora, Heins, Endres, Farnsworth and Bey2005).
The farms investigated in this study were typical Central German farms regarding breed (predominantly Holstein–Friesian), size and husbandry conditions, although no attempt had been made to select a representative sample of this region. Instead, the main focus of farm selection besides considering breed was on uniformity of cubicles within farms to allow a stringent analysis of possible associations between cubicle characteristics, cow dimensions and cleanliness. The inclusion of farms with larger variation in terms of cubicle dimensions and design would have required to determine individual cubicle use by the cows, which was not possible within this study. However, it was unexpectedly difficult to find farms with sufficiently uniform cubicles, which is an interesting finding in itself. Unfortunately, this led to a relatively small dataset. However, the assessment of ∼86% of cows provided relatively exact data for each herd.
Assessments were carried out only in the housing period mainly to avoid additional effects by possible pasture access. Even though the recording months were slightly different in the two recording years, weather conditions were rather comparable with generally low temperatures. However, as we cannot exclude confounding effects of temperature and humidity on cleanliness of cubicles, alleys and teats, we recommend future studies to additionally take into account climatic parameters, such as the comprehensive climate index (Mader et al., Reference Mader, Johnson and Gaughan2010).
Cubicle dimensions on the investigated farms did not largely comply with common recommendations such as those from Bartussek et al. (Reference Bartussek, Lenz, Würzel and Zucca2008). This applied, for instance, for 52% of the farms regarding the total resting length. This finding is in line with statements, for example, from Phillips (Reference Phillips2002) that common cubicles are too small because of the increasing sizes of the modern dairy cow. Also Veissier et al. (Reference Veissier, Capdeville and Delval2004) reported from their investigation on 70 farms in France that only few cubicles corresponded with the recommendations (±10%) of CIGR (1994), which is largely comparable to Bartussek et al. (Reference Bartussek, Lenz, Würzel and Zucca2008). Neck-rail height for example complied in 20%, total length in 26% and resting length in 23% of the farms (Veissier et al., Reference Veissier, Capdeville and Delval2004). If we apply the criteria of Veissier et al. (Reference Veissier, Capdeville and Delval2004), considering 90% to 110% compliance as adequate, 26% of farms provided sufficient cubicle width, 73% sufficient resting length, 39% an adequate neck-rail horizontal, 30% sufficient neck-rail height, 78% adequate total length and only 9% of farms sufficient headspace. Thus, compared with the results of Veissier et al. (Reference Veissier, Capdeville and Delval2004), compliance concerning neck-rail positioning was similarly low, but concerning total length and resting length was much higher.
Depending on individual replacement rates within the dairy herds, high variation in body sizes can be expected. At the high replacement rates that are presently common, about one-quarter of the herd may consist of heifers, and therefore of mostly small cows. These are the ones that are more likely to soil the cubicles (Fregonesi et al., Reference Fregonesi, von Keyserlingk, Tucker, Veira and Weary2009). However, contrary to expectations, in this study, larger variation in body sizes within the herd was not associated with higher teat or teat tip soiling. One possible explanation is the rather restrictive cubicle dimensioning in relation to the 25% largest cows per herd. Another aspect for consideration is that ‘large cows’ in terms of height need not necessarily be very long and vice versa. Actually, the correlation between HW and diagonal body length was relatively low (r = 0.371, P < 0.0001, n = 1178). In a herd with large cows being relatively short, calculated dimensions may be too generous with respect to cleanliness, whereas the opposite would be true for herds with low and long cows. In this study both long and high cows had been included in the selection of the 25% largest cows. Different results would have accrued, that is, different animals would have been selected, if we only had chosen one measure for selection of cows.
The final regression model concerning dirty teats contained total cubicle length as a predictive variable, with ∼0.6% predicted increase in dirty teats with each percentage of increase in compliance. This generally conforms to the findings from experimental studies (Tucker et al., Reference Tucker, Weary and Fraser2004; Bernardi et al., Reference Bernardi, Fregonesi, Winckler, Veira, von Keyserlingk and Weary2009; Fregonesi et al., Reference Fregonesi, von Keyserlingk, Tucker, Veira and Weary2009) that cubicles that are considered to be restrictive, even if this was not clearly defined or extremes of the dimensional range were chosen, lead to better cleanliness, but is in contrast to the findings of Martiskainen et al. (Reference Martiskainen, Koistinen and Mononen2007) and Bowell et al. (Reference Bowell, Rennie, Tierney, Lawrence and Haskell2003). As both have not taken into account body dimensions of the cows, this may serve as one tentative explanation for the discrepancy. Another aspect is the assumption of Bowell et al. (Reference Bowell, Rennie, Tierney, Lawrence and Haskell2003) that, depending on the level of restrictiveness, insufficiently dimensioned cubicles in fact may contribute to increased dirtiness if hindquarters or tails are hanging over the edge of the cubicles and drop onto the passageway, thereby getting soiled. In fact, cubicles in our study were ∼45 cm longer than that reported by Bowell et al. (Reference Bowell, Rennie, Tierney, Lawrence and Haskell2003), therefore such soiling of hindquarters or tails probably happened less often. However, in line with the hypothesis of Bowell et al. (Reference Bowell, Rennie, Tierney, Lawrence and Haskell2003), it is worth mentioning that in the present study, three out of four farms, that yielded less than 90% compliance, showed teat soiling rates above the overall farm average.
Even though within the range of cubicle lengths investigated in this study, shorter cubicles turned out to be beneficial for teat cleanliness, three further factors contributed to the final regression model and partly explained more of the variation between farms. This was true for cubicle maintenance time and whether teat dipping was carried out or not.
Each extra minute spent for cubicle maintenance according to the model decreased the percentage of dirty teats by ∼21.7%. Although daily cubicle maintenance time was estimated by the farmers themselves and may therefore be debatable with regard to reliability, results are in agreement with other studies, which found that the frequency of bedding replacement and service, such as removal of faeces, positively influences cow cleanliness (Veissier et al., Reference Veissier, Capdeville and Delval2004; Fulwider et al., Reference Fulwider, Grandin, Garrick, Engle, Lamm, Dalsted and Rollin2007; Martiskainen et al., Reference Martiskainen, Koistinen and Mononen2007). Unfortunately, for economic reasons such as cost of labour and expenditure for bedding materials, farmers often do not fully implement this well-known measure (Weary et al., Reference Weary, von Keyserlingk and Edmond2008). Cleanliness of cubicles, in contrast, had no significant explanatory value concerning teat cleanliness, possibly because repeatability of this measure over time is not high enough to reflect the common housing situation, or because farmers may have paid particular attention to cubicle cleanliness in preparation of the visit by an external person.
Teat dipping was predicted to result in ∼10.6% less dirty teats. It is unlikely that teat dipping has a direct effect on teat soiling as teat scoring had been carried out before cleaning and milking. Instead, this effect may be attributable to the general management style of the farms. Barkema et al. (Reference Barkema, van der Ploeg, Schukken, Lam, Benedictus and Brands1999) found that post milking teat dipping was performed on farms with a ‘clean and accurate’ management style for several years longer than on farms with a ‘quick and dirty’ style. Thus, teat dipping may be an indicator for an overall precise working attitude.
The last predictive variable in the model was cubicle type, accounting for ∼8.1% less dirty teats on farms with deep-bedded cubicles. Other related potential influencing factors presented to univariate selection or the model, namely bedding height and softness of flooring at the rear part of cubicle, kind of cubicle flooring (deep bedding or comfort mattress v. mat or concrete) and presence of a curb, were in contrast not significantly associated with teat cleanliness. Probably, it is the combination of factors rather than single aspects that may affect teat cleanliness. In contrast, it could be argued that farmers having decided for deep-bedded cubicles might be more willing to spend more time on cubicle maintenance and by this they positively affect cleanliness. However, the average time spent for daily cubicle service and cleaning was rather similar on farms with deep-bedded cubicles (0.37 min/cubicle per day) and raised cubicles (0.43 min/cubicle per day), showing that the effect of cubicle type was independent from cubicle maintenance times.
Concerning dirty teat tips, a clear benefit of increased bedding height in the rear part of the cubicle became apparent. With each additional cm of bedding height, a decrease of ∼2.8% soiled teat tips was predicted. This is in line with the finding of Magnusson et al. (Reference Magnusson, Herlin and Ventorp2008) that an increasing amount of bedding improves cleanliness of teat and teat tips. It was expected that additionally litter type is relevant, although little information can be obtained from the literature. Norring et al. (Reference Norring, Manninen, de Passillé, Rushen, Munksgaard and Saloniemi2008) found dirtier udders in straw stalls compared with sand bedding. However, no cubicles with sand were present in our study. Moreover, because of the diverse bedding combinations present on the farms, it was only possible to discriminate between bedding containing any type of straw or those not containing straw. This was presumably not specific enough to find any significant influence on cleanliness.
Resting length was the second influential variable, although explaining less variation between farms than bedding height. With each percentage of increase in compliance, ∼0.5% increase in soiled teat tips were predicted.
The last though not significantly associated variable was the percentage of soiled passageways. The predicted decrease in soiled teat tips of ∼0.2% with increased soiling of the passageways is difficult to explain and is in opposition to results from Christiansson et al. (Reference Christiansson, Bertilsson and Svensson1999) and Magnusson et al. (Reference Magnusson, Herlin and Ventorp2008). As some farms had outdoor feeding areas or uncovered passageways, it cannot be excluded that such outdoor alleys might, for example, have been more dirty on some farms, but that because of lower temperatures outside less dirt splashed up to the teats, or that such farms provided a better separation between dirty alleys and the direct vicinity of the cubicles so that less dirt was carried into the cubicles. In addition, interaction effects with concrete versus slatted floors might have played a role. However, all of this needs to remain speculative at the current level of information.
Both final models contained a measure of cubicle length. The difference between total cubicle length and resting length lies in the head lunging space. As compliance concerning total cubicle length and head lunging space was significantly correlated, it was decided to present total cubicle length to the models because of the higher correlation with the outcome variable. In general, effects of cubicle length cannot be considered independently from the neck-rail position. In contrast to other studies (Tucker et al., Reference Tucker, Weary and Fraser2005; Bernardi et al., Reference Bernardi, Fregonesi, Winckler, Veira, von Keyserlingk and Weary2009; Fregonesi et al., Reference Fregonesi, von Keyserlingk, Tucker, Veira and Weary2009), the neck-rail position did not appear as predictive factor, even though in the univariate preselection of factors the neck-rail height was significantly correlated with the percentage of dirty teats (r = 0.421, P = 0.046). However, the height of the neck rail complied with recommendations on only three farms, horizontal and diagonal position on no farm at all. Perhaps, results would have differed with sufficient neck-rail positions. As described by Tucker et al. (Reference Tucker, Weary and Fraser2005) and Bernardi (Reference Bernardi2008), restrictive neck-rail placement possibly prevents cows from standing in the cubicle, but still allows the cows to lie in the fore position in the cubicle while limiting the cow's movements during lying down or rising (Veissier et al., Reference Veissier, Capdeville and Delval2004). Even though total length was sufficient on about half of the farms, the cows perhaps avoided to rise because of restrictive neck-rail placement and defecated while lying in the cubicle, as reported by Whistance et al. (Reference Whistance, Arney, Sinclair and Phillips2007) or Fregonesi et al. (Reference Fregonesi, von Keyserlingk, Tucker, Veira and Weary2009). In combination with a longer cubicle where the cow's rear is lying further from the curb, the faeces may be deposited where perhaps another cow's udder is placed afterwards. This points at the necessity to take into account not only single cubicle measures but also possible interactions between different cubicle characteristics. A multivariate approach as applied here was one attempt to better address this. However, it appears that this was not completely successful and that rather some kind of combined cubicle measures might better reflect the situation the cows are facing in the cubicle. This should be a topic of future research.
Conclusion
Even under relatively restrictive cubicle conditions, a certain increase in teat and teat tip soiling can be expected with increasing cubicle length. However, at the same time, there are feasible and effective measures available to limit teat and teat tip soiling. In the farms investigated, we found significant associations with a good management and specifically with bedding management in the cubicles. In addition, deep-bedded cubicles yielded advantages in this regard. Both regression models for teat and teat tip cleanliness contained similar but not identical predictive variables. This indicates that dirtiness of each particular area may originate from slightly different though related causes. The low correlations between udder, teat and teat tip cleanliness should be considered in future studies.
Acknowledgements
We are grateful to the participating farmers for their hospitality, participation and interest, the people who helped us with farm recruitment and to Sabine Dippel, as well as two anonymous referees for their comments on the manuscript. Maja Günther, Anja Zimmermann and Tobias Gorniak assisted us with on-farm data collection and data entry.