

Introduction
Increasing interest in the effectiveness of special education (Morgan, Frisco, Farkas, & Hibel Reference Morgan, Frisco, Farkas and Hibel2010; Samuels, Reference Samuels2011) has drawn attention to the longitudinal outcomes of students identified with additional needs. However, there is very limited research that investigates the extent to which students receiving special education assistance continue to receive that assistance over time.
Some studies conducted in the United States (US) have investigated the status of children with special needs over time. In one such study, Flynn (Reference Flynn2012) examined young US school students’ movement in and out of special education and school-based predictors for later special education placement. She found that 13% of the sample of over 500 kindergarten children accessed special education support but that 80% of those students had exited special education services by the end of first grade and had been replaced by a group of children with higher support needs. Regression analyses showed that male students and students with lower academic performance were predictive of later special education placement.
The early years of schooling are strongly related to students’ later academic success and educational attainment (Entwisle, Alexander, & Olson, Reference Entwisle, Alexander and Olson2005), and so there has been interest in the ongoing status of preschoolers receiving special education services. In a large, nationally representative sample of 3–5-year-old children, Daley and Carlson (Reference Daley and Carlson2009) found that 16% of the preschool group who received additional support in 2003 did not receive that support a year later, and that this trend continued the following year. Significant predictors of placement out of special education were gender, size of the special education program, type and level of disability, behaviour problems and academic skills.
Although the following studies did not include a longitudinal component, some research in the US and in Ireland gives insight into the variables associated with initial placement in special education. Using a US nationally representative database, Hibel, Farkas, and Morgan (Reference Hibel, Farkas and Morgan2010) determined that the strongest predictor of special education placement in kindergarten was academic achievement, with male gender also making a significant contribution. McCoy, Banks, and Shevlin (Reference McCoy, Banks and Shevlin2012) found in a large representative sample of Irish school children that male gender, socioeconomic status, teacher experience and rural versus urban location were significant predictors of special education support.
Recent interest in the movement into and out of special education services, as well interest in the predictors of special education placement, has been associated with a number of different lines of research. This research includes concern about the overrepresentation of minority groups in special education, the inclusion movement, and financial expediency. Each of these lines of research as they relate to use of special education services is now examined.
Overrepresentation
Concern about the overrepresentation of minority groups in special education services has continued for several decades. In the US, in particular, a swathe of studies have highlighted the disproportionate representation of African American, Native American, Hispanic and Asian students receiving additional assistance at school (Hibel et al., Reference Hibel, Farkas and Morgan2010; Hosp & Reschly, Reference Hosp and Reschly2004; Zhang & Katsiyannis, Reference Zhang and Katsiyannis2002). In a review of the research in this area, Waitoller, Artiles, and Cheney (Reference Waitoller, Artiles and Cheney2010) concluded that much of this research was driven by US legal requirements to report education outcomes for specific ethnic groups (U.S. Department of Education, 2012). Further, although most studies focused on the relationship between ethnic status, sociodemographic characteristics and access to special education, the research ‘. . . did not shed light on the role of policies, educators’ beliefs, school climate, and other local practices that might have mediated how overrepresentation affected some (but not all) ethnic groups in certain disability categories’ (Waitoller et al., Reference Waitoller, Artiles and Cheney2010, p. 43).
However, (Hibel, Faircloth, and Farkas (Reference Hibel, Faircloth and Farkas2008) found that, after controlling for socioeconomic status and characteristics of the school, there were no significant differences in the special education placement rates of American Indian and Alaska Native students with that of non-Hispanic White students. The strongest predictor in this study that used a large US database was students’ reading and numeracy skills on entry to school. Hibel and his colleagues (Reference Hibel, Farkas and Morgan2010) also found that social class was a weak predictor of special education placement.
There has been little interest in Australia in disproportionate representation in special education. Discussion about inequity and disproportionate representation in Australian general education has concentrated on Indigenous students, students whose first language is not English, and on gender. Reporting on the educational outcomes of these groups of students has occurred for many years as part of the National Assessment Program – Literacy and Numeracy (NAPLAN; Australian Curriculum Assessment and Reporting Authority, 2012). In his review of the very limited research in Australia, Dempsey (Reference Dempsey2003) concluded that overrepresentation in special education is a complex issue and that ‘. . . an assumption that equity means, by induction, that there should be an equal number of males and females receiving special education services, or that support services for Indigenous students should not exceed their proportionate share, may be faulty logic’ (p. 43).
The Personal Costs of Inclusion
There can be personal costs associated with access to special education services because such access is generally dependent on being labelled with designated cognitive, behavioural or other needs. The costs associated with this labelling may extend to stigmatisation, access to a restricted curriculum, lowered expectations from others, and difficulty in discarding the label in the future. For many students, particularly students with substantial disability, the benefits of remaining in special education for most or all of their schooling experience may vastly outweigh the disadvantages of such placement (Kauffman & Hallahan, Reference Kauffman and Hallahan2005). However, for other students, there is justifiable concern that access to special education services does not inexorably lead to a permanent special education placement.
Over time, students placed in lower ability groups in the early years of school fall increasingly behind students placed in higher groups (Tach & Farkas, Reference Tach and Farkas2006). In Australia at least, the persistent gap between the performance of the most capable and least capable students in general education continues to fuel both public and professional concerns (Thomson, De Bortoli, Nicolas, Hillman, & Buckley, Reference Thomson, De Bortoli, Nicolas, Hillman and Buckley2011). All this means that scrutiny of any turnover in the population of students accessing special education is well justified. Such turnover may not necessarily be an indicator of successful outcomes for these students. However, the lack of substantial turnover, particularly in the early years of school when early intervention efforts are at their greatest, will preclude any speculation that special education is working to the extent that it substantially addresses some students’ academic and social skill deficits.
The Financial Efficacy of Special Education
It has been well documented that special education enrolment and expenditure has been rapidly increasing for at least a decade in many developed countries. The population of US students eligible for special education assistance has grown at nearly twice the rate of the general education population. Between 1980 and 2005, US students with special needs increased by 37%, while the general education population grew by only 20%. Moreover, students with special needs in the US account for about 14% of the total education population, up from about 10% in the 1980s (U.S. Department of Education, 2012). The US federal government alone allocates 90% more funding per student to students with special needs, in comparison to students without such needs (Parrish, Reference Parrish2006). Given the legislative requirement to provide special education assistance in that country, some have argued that special education expenditure is a sacred cow, even in pressing economic times (Samuels, Reference Samuels2011), whereas others claim that rising special education expenditure is responsible for stagnant educational outcomes for all US students over several decades (Winters & Greene, Reference Winters and Greene2007).
In Australia, the limited data indicates that the proportion of school students with a disability increased from 2.6% in 1996 to 4.8% in 2009 (Australian Government Productivity Commission, 2002–2011). Some Australian states now spend in excess of A$1 billion annually on students with special needs (Parliament of New South Wales Legislative Council, 2010), and others are actively exploring support models for students with special needs that are perceived to be more cost effective (NSW Department of Education and Training, 2011). Associated with this increased proportion of the total school population with special needs and the rising costs of educating these students, is evidence that public schools are shouldering much of the burden of servicing these special education needs (Dempsey & Davies, Reference Dempsey and Davies2013).
Taken as a whole, the limited research base suggests that there is considerable student turnover in special education services, at least in the early years of schooling. In addition, a number of student and school factors, including student gender and academic skills, appear to predict use of special education support later in students’ school careers. However, virtually all of this research emanates from the US where education law and school resourcing are quite different from the situation in Australia (Stiglitz, Reference Stiglitz2012).
This study sought to answer the following questions. First, what are the main reasons why individual students are provided special education support at Australian schools? Second, to what extent do young Australian students who receive additional support continue to receive this support over time? Finally, what factors are associated with special education support to young Australian students?
Methodology
Sample and Participants
The Longitudinal Study of Australian Children (LSAC) seeks to examine the impact of a range of social and environmental influences on childhood development (Australian Institute of Family Studies, 2011a). Information on children's physical and mental health, their education and social, cognitive and emotional development is being collected from parents, carers, and teachers and from the children themselves. Begun in 2002 and commissioned by the then Commonwealth Department of Community Services, the study recruited and surveyed in 2004 over 10,000 children and their families and teachers in a stratified random sample (based on postcodes) from the Medicare database. Information on overall response rates and response rates from subpopulations are available in several LSAC technical papers (Australian Institute of Family Studies, 2011b). LSAC has collected data from participants every 2 years up to 2012, and later data collection waves are planned. The first wave of data collection involved roughly equal numbers of children in two cohorts of 0–1-year-old (birth cohort) and 4–5-year-old children (kindergarten cohort). The response rates at the first wave of data collection were 64% (birth cohort) and 59% (kindergarten cohort).
The data reported in this paper makes secondary use of the Wave 2, Wave 3 and Wave 4 data collected in mid-2006, mid-2008 and the middle of 2010. Further, this paper reports selected relevant results from the teacher and parent surveys that relate to the cohort of study children (SC) who were between 6 and 7 years of age in 2006 (kindergarten cohort). Teachers were potential participants when the parents of study children consented to them being contacted. The number of children in the kindergarten cohort in 2006, 2008 and in 2010 was 4464, 4332 and 4168, respectively.
Instruments
The teacher survey used at each phase of LSAC sought to establish the characteristics of the educational program that the child was attending as well as the characteristics of the teacher and the child (Australian Institute of Family Studies, 2011c). This questionnaire also sought responses on the academic and social development of the SC. In addition, one of the child's parents completed a questionnaire at the commencement of LSAC data collection in 2004, and in later years, that questionnaire included demographic information about the SC and the family. For the research reported here, the following items from the teacher survey were of interest:
• Whether the SC required ‘specialised services provided within the school because of diagnosed disability or additional need’.
• The main reason these specialised services were provided to the SC.
• The number of children enrolled at the school.
• The number of years of teaching experience that the SC's teacher had in 2006.
• The 2006 teacher assessment of the SC's literacy and numeracy skills, and the SC's level of behaviour problems.
An adapted version of the Academic Rating Scale (ARS) that was developed for the Early Childhood Longitudinal Study, Kindergarten Cohort was used to measure SC's academic skills at each time point (U.S. Department of Education, Institute of Education Sciences, National Center for Education Statistics, 2012). The adapted ARS measures growth in language and literacy and in numeracy skills over time. Its items measure the same construct by increasing complexity as children progress through the grades. Examples of literacy and numeracy items in 2006 were ‘understands and interprets a story and can continue a pattern using three items’. Teachers rated each item on a 5-point Likert scale from not yet displayed to proficient. There were nine literacy and 10 numeracy items on the 2006 teacher questionnaire.
The language and literacy section of the ARS showed moderate correlations with the Peabody Picture Vocabulary Test (Dunn & Dunn, Reference Dunn and Dunn2007) in both 2006 and 2008 LSAC data (.34–.36), the correlation between the numeracy and the language/literacy sections was very high (.82–.83) across 2006 and 2008, and overall ARS scores were highly correlated (.57–.63) across both waves (Rothman, Reference Rothman2009). Internal reliability (Cronbach's alpha) of both components of the ARS ranged from .95 to .97 over the 2 years (Australian Institute of Family Studies, 2011e). Rasch modelled scores (Bond & Fox, Reference Bond and Fox2007) of these two academic measures, which were included in the LSAC database, were used in the present research.
The measure of behaviour was derived from the Strengths and Difficulties Questionnaire (SDQ; Goodman, Reference Goodman1997). The SDQ is a widely used 25-item scale with good psychometric properties (Hawes & Dadds, Reference Hawes and Dadds2004). The instrument subscales measure the level of conduct behaviour problems, difficulties with peer relationships, hyperactivity, and emotional difficulties. These are typically combined into a total SDQ score that is a measure of the extent of behavioural difficulties.
The following items were drawn from the 2006 parent questionnaire:
• The gender of the SC.
• A 5-point Remoteness Area Classification derived from family postcode that ranged from highly accessible to very remote.
• A standardised score comparing all families on a composite socioeconomic variable.
Procedure
The researcher accessed these data via an individual licence (Australian Institute of Family Studies, 2011d). Consequently, approval from an ethics committee was not required for this study.
Data Analysis
All analyses were conducted using SPSS Version 19. A range of descriptive analyses was used to describe the SC receiving support. Logistic regression was conducted to check the predictive status of selected independent variables on whether the SC received assistance in 2006 and in 2010. Finally, several contingency analyses were completed to determine if the proportion of SC in particular groups changed over time. In the last of these contingency analyses, the children receiving special education support in 2006 were grouped into students receiving assistance primarily because they had a learning disability in reading or in maths, and students receiving assistance primarily because they had a need in an area other than learning disability. The rationale for this dichotomisation was twofold. First, to create two fairly evenly sized groups for later statistical analysis. Second, because some of the special education assistance categories had very low cell counts (e.g., visual and hearing impairment) and did not lend themselves to amalgamation with other categories.
Results
The number of study children receiving specialised services in 2006, 2008 and in 2010 declined from 597 to 522 and to 399, respectively. This represents a percentage reduction in the proportion of students receiving support over the same period from 18.0%, 16.9% to 14.7%, respectively. The proportion of male students receiving additional services in 2006, 2008 and in 2010 was 59.8%, 63.2% and 59.8%, respectively.
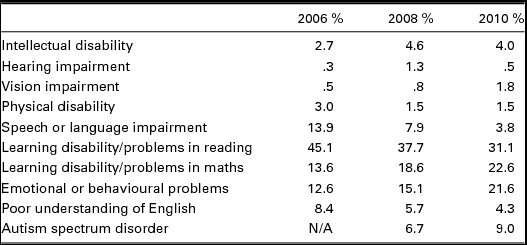
In all years, the most common reason for special education services was learning disability with reading problems. Table 1 details the main reason why the SC received specialised services as a proportion of all SC receiving assistance. Over the 4-year period, the proportion of SC receiving support and with problems in maths or with emotional or behavioural problems increased substantially, and the proportion of SC with speech or language impairment, with reading problems or with a poor understanding of English decreased substantially. Over the 4-year period, students with a learning disability comprised over 50% of the children receiving additional assistance.
Percentage of Students With Special Needs by Type of Special Needs for 2006 (n = 597), 2008 (n = 522) and 2010 (n = 399)
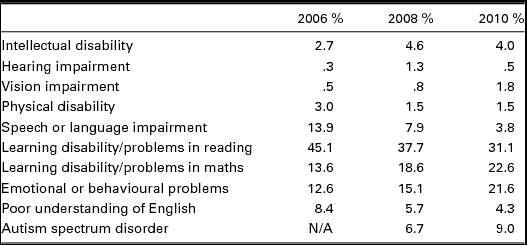
Note. The autism spectrum disorder category was not used in the 2006 survey.
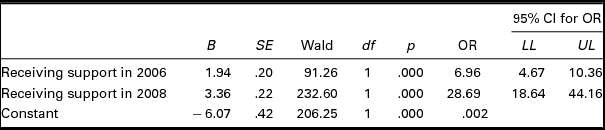
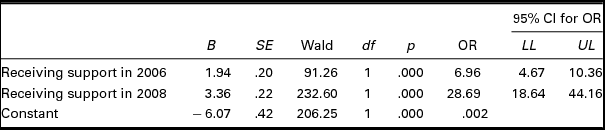
Logistic regression analysis was used to assess the relationship between several predictors and the likelihood that the SC received specialised services at school in 2010. The model contained two independent variables (whether the SC received specialised services in 2006 and in 2008). After 120 outlier cases (standardised residuals < −2.5 or > 2.5) were removed from analysis, the full model containing all predictors was statistically significant, χ 2 (2, 2131) = 553.41, p < .001, indicating that the model was able to effectively discriminate between SC who did and who did not receive specialised services in 2010. As a whole, the model was able to predict between 23% (Cox and Snell R 2) and 52% (Nagelkerke R 2) of the variance in receipt of specialised services, and the model was able to correctly classify 91.3% of cases.
Table 2 shows that both of the independent variables made a statistically significant contribution to the model. The strongest predictor was whether the SC received specialised services in 2008 and provided an odds ratio of 28.69. Regardless, the odds ratio for 2006 status was also high at 6.96. This means that for the total cohort, the 2008 status for SC was more helpful in predicting whether the SC received assistance in 2010 than their 2006 status.
Logistic Regression Results of Predicting the Likelihood of Receiving Specialised Services in 2010 (n = 2131 at 2010)
Note. OR = odds ratio; LL = lower limit; UL = upper limit.
As the logistic regression analysis did not permit an examination of change over time, some additional analyses were completed. The first of these additional analyses checked bivariate correlations between receiving and not receiving special education support for all SC across the 4 years. There were statistically significant relationships between support status of students across all three time comparisons. For the comparison between status at 2006 and 2008, r = .37, n = 3577, p < .001; between 2006 and 2010, r = .26, n = 2833, p < .001; and between 2008 and 2010, r = .40, n = 2753, p < .001. The weakest relationship was the comparison across the full 4-year period and the effect sizes for all these relationships ranged from small to medium (Hojat & Xu, Reference Hojat and Xu2004).
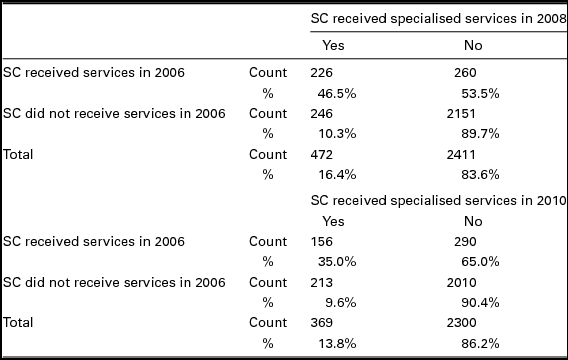
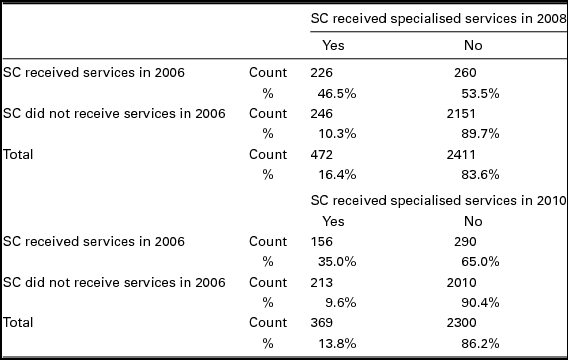
The next analysis determined whether there were differences in the proportion of SC receiving specialised services in 2006, 2008 and in 2010. Table 3 shows that 54% of the SC who received assistance in 2006 did not continue to receive that assistance in 2008. By 2010, this proportion had increased to 65%. Just over 10% of the SC who did not receive support in 2006 received specialised services in 2008, and this proportion dropped to 9.6% in 2010. Chi square tests were not computed from these contingency tables because the very large proportion of SC not receiving specialised services effectively guaranteed a statistically significant difference across table cells. Although it does not appear in Table 3, 53.7% of SC who received additional assistance in 2008 did not receive that assistance in 2010, and 8.4% of SC who did not require specialised services in 2008 were receiving such services in 2010.
Number and Proportion of SC Who Did and Who Did Not Receive Support in 2006 and Their Status in 2008 and in 2010 (n = 2411 in 2008 and n = 2300 in 2010)
Note. SC = study children.
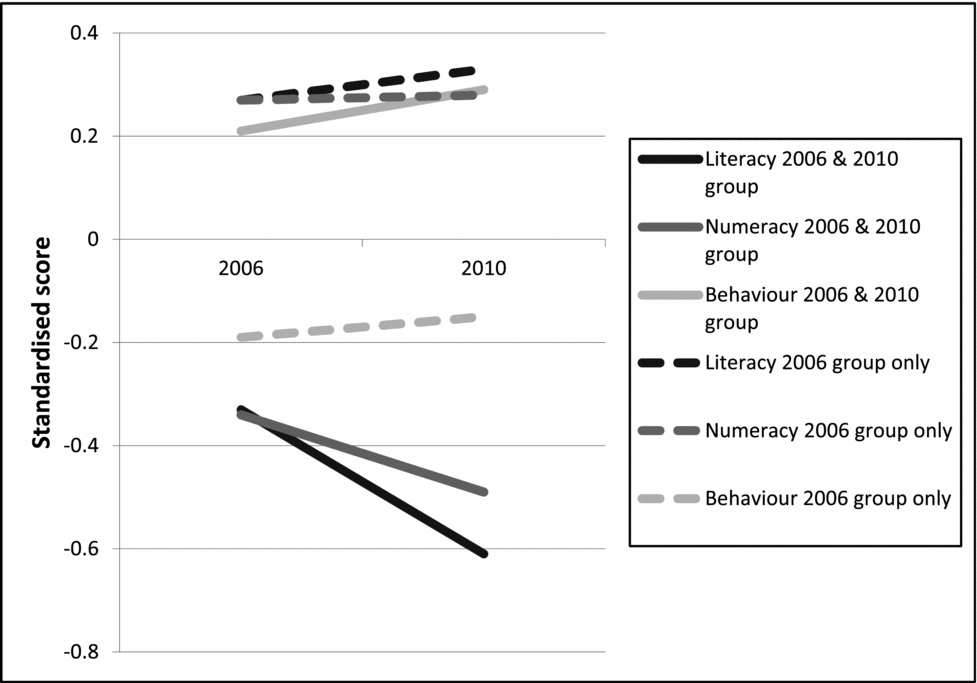
Although nearly two thirds of the SC who received assistance in 2006 did not receive assistance in 2010, there were significant differences in the academic and social skills of this 2006 group that was dependent on their 2010 status. The 2006 group who continued to receive assistance 4 years later had significantly lower literacy, M = 2.67, 3.46, respectively, t(436) = −10.50, p < .001, and numeracy skills, M = 2.48, 3.17, t(424) = −8.25, p <.001, and significantly higher behaviour problems, M = 10.31, 7.36, t(444) = 4.57, p < .001, than the 2006 group who did not continue to receive specialised support. Two sets of paired t-test analyses were then completed to check on changes in academic and social skills first, for the group of SC who received special education services in 2006 and in 2010, and second for SC who received assistance in 2006 but no longer received support in 2010. Standardised literacy, numeracy scores and SDQ were used in this process. Figure 1 shows that for the group receiving specialised services at both time points, there were significant reductions in relative literacy, t(148) = 4.02, p < .001, and numeracy skills, t(137) = 1.95, p = .053, and a nonsignificant deterioration in their behaviour, t(154) = −0.96, p = . 34. For the group no longer in receipt of support in 2010, there were nonsignificant improvements in literacy, t(285) = −0.96, p = .34, and in numeracy, t(274) = −0.18, p = . 85, and a nonsignificant increase in the level of behaviour problems, t(287) = −0.63, p = .53.
Mean standardised literacy, numeracy and Strengths and Difficulties Questionnaire (SDQ) scores in 2006 and in 2010 for Study Children (SC) receiving specialised services in both 2006 and in 2010 (2006 & 2010 group), and SC receiving specialised services in 2006 only (2006 group only).

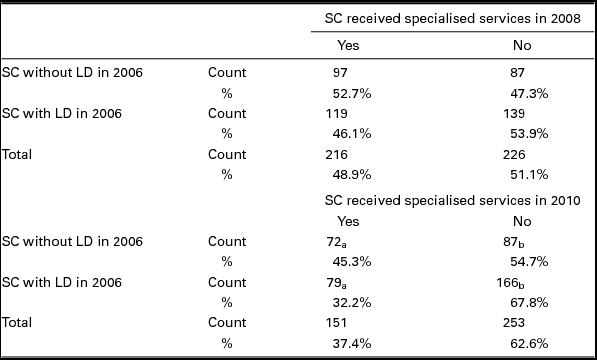
To determine the differential relationship between type of special education need in 2006 and whether specialised services were provided in 2008 and in 2010, the categories of special need for SC receiving support in 2006 were dichotomised into a group of SC with learning difficulties in reading or maths (n = 350) and SC with special needs other than learning difficulties (n = 247). Missing cases reduced the size of this group of children receiving specialised services from n = 597 in 2006, to n = 442 in 2008 and n = 404 in 2010.
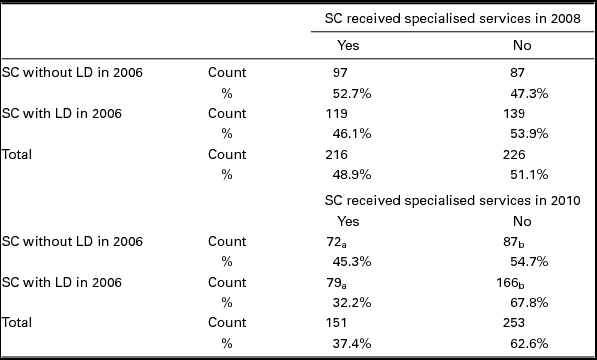
Table 4 shows the 2008 and 2010 status of the 2006 children with learning difficulties in reading or in maths, and the status of the 2006 children with special needs other than learning difficulties. There were no statistically significant differences in the proportion of SC across the cell groups reported for 2008, χ 2(1,442) = 1.87, p = .102. However, there were significantly more SC in both the 2006 groups who did not receive special education services in 2010, χ 2(1,404) = 7.00, p = .006. The effect size for this latter difference, d = 0.28, was small (Hojat & Xu, Reference Hojat and Xu2004).
The final analysis examined the predictive value of several independent variables on whether the SC received special education support in 2006. The independent variables chosen for this analysis were those identified by the US and the Irish research reviewed earlier in this paper. Specifically, gender, socioeconomic status, academic skills, teacher experience, a remoteness measure, school size and level of behaviour problems were included. Type and level of disability were not included as independent measures because the identification of disability on the teacher survey was dependent on the SC receiving specialised services.
Differential Status of the 2006 Group of SC Receiving Specialised Services in 2008 (n = 442 in 2008 and n = 404 in 2010)
Note. Each subscript letter notes column proportions that do not significantly differ from each other at the .05 level. SC = study children; LD = learning difficulties.
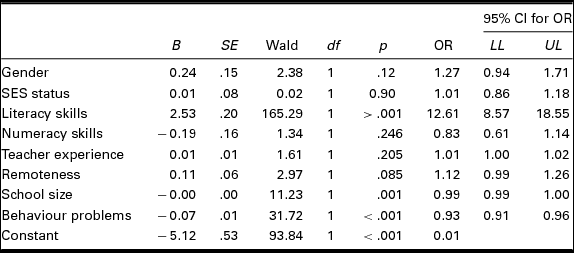
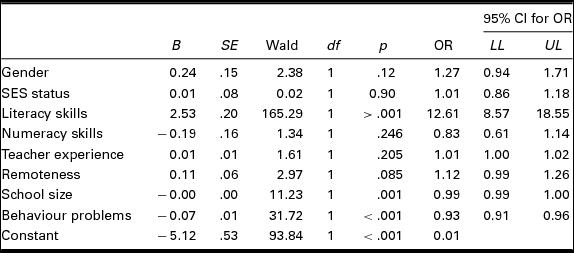
Table 5 details the output from a logistic regression analysis with whether the SC received additional support in 2006 as the dependent measure and the independent variables detailed above. Following the removal of 80 outlier cases (standardised residuals < −2.5 or > 2.5), the full model containing all predictors was statistically significant, χ 2(8, 354) = 768.00, p < .001, indicating that the model was able to effectively discriminate between SC who did and who did not receive specialised services in 2006. In total, the model was able to predict between 28% (Cox and Snell R 2) and 48% (Nagelkerke R 2) of the variance in receiving specialised services, and the model was able to correctly classify 87.5% of cases. Literacy skills, school size and the level of behaviour problems were significantly associated with special education support in 2006 at the .05 level.
Logistic Regression Results of Predicting the Likelihood of Receiving Specialised Services in 2006 (n = 362 at 2006)
Note. OR = odds ratio; LL = lower limit; UL = upper limit.
Discussion
The current study sought to find the main reasons why young children in Australian schools receive special education support, whether these children continue to receive support over time, and some factors associated with this support. Although there was a decrease in the proportion of children receiving specialised services for a learning disability in reading problems, and a similar increase for children with a learning disability in maths, the overall proportion of students with a learning disability remained at just over 50% of all children receiving assistance over the years 2006–2010. Receiving or not receiving assistance for a learning disability in 2006 was not associated with either continuing or not continuing to receive such assistance over the next 2 or 4 years. Nevertheless, the status of students at both 2006 and 2008 had substantial predictive value in determining whether they received specialised services in 2010.
The most striking changes across the 4 years of this study were for students with speech or language problems (reduction from 13.9% to 3.8%), and for students with emotional or behaviour problems (increase from 12.6% to 21.6%). Although these changes are not well documented in Australian sources, the substantial increase in the proportion of children receiving special education services for behaviour problems as they progress through school matches some Australian evidence (Beaman, Wheldall, & Kemp, Reference Beauman, Wheldall and Kemp2007; Ford, Reference Ford2007).
As they progressed through the school system, there was a decrease in the likelihood that the students who received special education support in 2006 continued to receive that support. Nearly two thirds of this 2006 group did not continue to receive specialised assistance 4 years later, and over half of the students receiving support in 2008 did not retain that support in 2010. These results paint a picture of a highly fluid population for a substantial proportion of children with special education needs during the primary school years in Australian schools. This finding is consistent with the limited international research (Daley & Carlson, Reference Daley and Carlson2009; Flynn, Reference Flynn2012) and suggests that Australian schools are continually screening the status of young children and transitioning them into and out of special education services as required. No doubt this implies that Australian schools are responsive to their students’ needs. However, the present study says nothing about how effectively the allocated support provided to such students addressed their primary needs.
The LSAC database does not include detail on the level of students’ disability beyond measures of their academic and social skills. Nevertheless, some comment on the level of students’ support needs over time is warranted. The subgroup of 2006 children who maintained support in 2010 had substantial deficits in their skills, in comparison to the group who transitioned out of special education. This lends weight to the intuitive view that students who consistently receive special education assistance maintain substantial skill deficits in comparison to their peers without additional needs, and that the relative academic and social skills of this former group declines over time.
Unlike some international research (Daley & Carlson, Reference Daley and Carlson2009; Hibel et al., Reference Hibel, Farkas and Morgan2010; McCoy et al., Reference McCoy, Banks and Shevlin2012), the results of the present study found no significant relationship between gender, socioeconomic status and remoteness, and whether children received special education support in Australian schools. On the other hand, literacy skills and the extent of behaviour problems were strong predictors. The size of the LSAC database and its representative sampling process gives some confidence to these findings, but a wider range of predictors are worthy of further investigation. In particular, the longitudinal status of Aboriginal and Torres Strait Islander students in special education services deserves attention because the chronic poor outcomes of this group of Australians in national testing are well known (Australian Curriculum Assessment and Reporting Authority, 2012). Also worth attention is the longitudinal status of children in different special needs groups. The relatively small number of students in some low incidence disability groups (e.g., sensory disability) in the LSAC database make such work presently difficult.
In conclusion, the research reported here for the first time demonstrates the fluid movement into and out of special education services in Australian primary schools. Whether most of the one third of students who received specialised services at the start of their school careers, and again after 4 years of school, continue to receive that assistance into high school will require the tracking of those students’ experiences into the future. While the fluidity of the special education population in the early years of Australian schools does not necessarily demonstrate the effectiveness of special education, it does add weight to a view that for the majority of students with special needs, their specialised needs are regarded as transient.