I. INTRODUCTION
Since the isolation of graphene in 2004 (Ref. Reference Novoselov, Geim, Morozov, Jiang, Zhang, Dubonos, Grigorieva and Firsov1) there has been an incredible amount of research in the field of two-dimensional (2D) materials. Although, graphene boasts of many remarkable properties, the lack of a band gap makes it unsuitable for digital electronics. Transition metal dichalcogenide (TMDs) is a family of materials with the general chemical formula MX2, where the M stands for a transition metal and X stands for a chalcogen. Nearly 40 different TMDs have layered structures and among these members the properties vary from metallic to semimetallic to semiconducting. Reference Chhowalla, Shin, Eda, Li, Loh and Zhang2 Even among the semiconducting members there exist a large variation of band gaps and this opens up a route for designer optoelectronic devices. It also opens up the possibility of tuning material properties by controlling the TMD chemical composition.
Of the different TMDs, so far MoS2 has been at the forefront. Reference Wang, Kalantar-zadeh, Kis, Coleman and Strano3 Since the initial demonstration of single layer MoS2 transistors Reference Radisavljevic, Radenovic, Brivio, Giacometti and Kis4 using mechanically exfoliated samples, significant effort has been invested to not only improve device performance Reference Das, Chen, Penumatcha and Appenzeller5–Reference Chang, Yang, Lee, Tao, Hwang, Jena, Lu and Akinwande9 but also demonstrate device capabilities of synthesized materials. Reference Sanne, Ghosh, Rai, Movva, Sharma, Rao, Mathew and Banerjee10,Reference Sanne, Ghosh, Rai, Nagavalli Yogeesh, Shin, Sharma, Jarvis, Mathew, Rao, Akinwande and Banerjee11 Of the different synthesis processes used for MoS2, the vapor transport process using solid precursors (MoO3 and S) has shown the best electrical performance. Due to the success of this process similar synthesis efforts have been successfully used to produce other TMDs such as WS2, WSe2, and MoSe2. However, this growth process inherently includes a variety of meso-scale imperfections Reference Liu, Ghosh, Wu, Ismach, Ruoff and Lai12 that might affect nano-scale devices. This growth process is initiated by isolated domains that merge together to form pseudocontinuous regions. Performances of devices built across these grain boundaries suffer due to charge scattering. For TMDs to move to commercial applications it is essential to synthesize atomically flat and defect free regions over large areas. To truly explore the versatility of different TMDs, the synthesis processes should either be interchangeable between different TMDs or simple post-growth processes need to be explored for this interchangeability.
In this work, we demonstrate a single step process to obtain monolayer MoSe2, continuous over a large area (>1 cm × 3 cm) with sub-nanometer surface roughness. In addition, we discovered that this large area film can be controllably converted from MoSe2 to MoS2 based on sulfurization annealing.
II. EXPERIMENTAL SECTION
A. Material synthesis
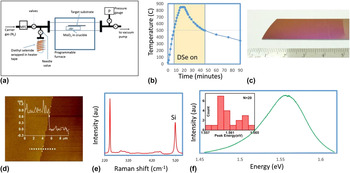
Figure 1(a) depicts the schematic of the setup used for the low pressure chemical vapor deposition growth of large area MoSe2. The system consists of a quartz tube with an inner diameter of 22 mm (outer diameter = 25 mm) inside a single zone Lindberg/Blue M furnace. The precursors used for MoSe2 growth are MoO3 (Sigma Aldrich, CAS number 1313-27-5, 99.98%) and diethyl selenide (DSe, Sigma Aldrich, CAS number 627-53-2, 99.999%). The target substrates used for this work were surface cleaned 285 nm SiO2 on moderately doped p-type Si. At the start of the growth process, MoO3 (15 mg) was loaded in an alumina crucible, then the target substrate was placed on top of the crucible with the polished side facing the MoO3 powder and placed at the center of the furnace. This was followed by pumping down the system to base pressure (∼1.5 mTorr) and four subsequent purge cycles using ultra high purity nitrogen at 200 sccm. After the purge cycles, N2 flow was reduced to 40 sccm for the rest of the growth. Background pressure of the system was held at 2.75 Torr. Temperature profile used during the growth process is shown in Fig. 1(b). Once the furnace reaches 650 °C, the needle valve is opened for introduction of DSe. The background pressure after the introduction of DSe is controlled at 3.00 Torr. After the furnace reaches 850 °C, the temperature is held there for 5 min. This is followed by allowing the furnace to cool back down to room temperature without any feedback control. The needle valve to DSe was turned off at 650 °C.
(a) Schematic of CVD growth system, (b) heating profile used for MoSe2 growth. DSe is turned on at 500 °C during heat up and turned of at 500 °C during cool down, (c) optical image of large area MoSe2 growth, and (d) AFM map. (Inset) Height profile along the dashed horizontal line in the map. Thickness of MoSe2 is ∼0.8 nm, which corresponds to mono layer. The RMS roughness of MoSe2 region was ∼150 pm, which is comparable with thermally grown SiO2 (∼200 pm in shown region) (e) Raman spectrum of MoSe2 sample. Peak at 520 cm−1 is from the Si substrate. (f) PL profile of MoSe2 sample. (Inset) Histogram of 20 PL peak energy randomly measured over the sample.

The setup used for sulfurization has been previously reported. Reference Sanne, Ghosh, Rai, Nagavalli Yogeesh, Shin, Sharma, Jarvis, Mathew, Rao, Akinwande and Banerjee11 However, in this case the MoSe2 film on Si–SiO2 substrate was loaded into the furnace without any MoO3 precursor, while the sulfur powder was positioned upstream and heated separately using a heating coil. Sulfurization procedure was initiated by raising the temperature of the MoSe2 film to the target temperature. Once the target temperature of the MoSe2 was reached, sulfur was heated to 200 °C and a carrier gas (N2) was flown in at 10 sccm. After holding the MoSe2 film at the target temperature for 30 min, the furnace and the heating tape for sulfur were cut-off and subsequently allowed to cool down without any feedback control.
B. Characterization
Raman and photoluminescence (PL) spectroscopy were performed using Renishaw inVia Raman spectrophotometer system coupled with 532 nm green laser. Raman spectra were collected using a grating with 3000 lines/mm and for PL spectra, a grating of 1200 lines/mm was used. Raman and PL mapping were done with 1 s/pixel time integration and 3 pixels/μm spatial resolution.
X-ray photoelectron spectroscopy (XPS) spectra were acquired at room temperature using an Omicron Multiprobe system and monochromatic Al–Kα (hν = 1486.7 eV) x-ray radiation source. Reference Roy, Guchhait, Sonde, Dey, Pramanik, Rai, Hema, Colombo and Banerjee13 The background pressure during measurements was kept below 3 × 10⁻¹⁰ mbar.
III. RESULTS AND DISCUSSIONS
The MoSe2 sample obtained has very high optical uniformity as shown in Fig. 1(c). To obtain material characteristics of the CVD film, we used atomic force microscopy [AFM, Fig. 1(d)], Raman [Fig. 1(e)] and PL [Fig. 1(f)] spectroscopy. As the films are very uniform over the whole substrate and show full coverage, artificial scratches were made mechanically to measure film thickness. The scratches were gentle enough as to not to damage underlying SiO2 substrate, which can be also confirmed from the AFM line profile [Fig. 1(d)]. Line profile shown in inset of Fig. 1(d) indicates a step height of ∼0.8 nm which corresponds to monolayer MoSe2 film. The AFM scan also provides an overall RMS roughness of ∼0.140 nm for the MoSe2 film region which is comparable to that of SiO2 (0.199 nm RMS) and confirms the uniformity of the MoSe2 film at the atomic scale. The Raman spectra [Fig. 1(e)] shows a main peak at 242.7 cm−1 which corresponds to the out-of-plane A1g mode. Smaller peaks at 288.4 and 354.5 cm−1 corresponding to the
 ${\rm{E}}_{{\rm{2g}}}^{\rm{1}}$
and
 ${\rm{B}}_{{\rm{2g}}}^{\rm{1}}$
in-plane vibrational mode peaks are also easily identifiable (not shown). The PL spectra [Fig. 1(f)] reveals one clear peak at 1.55 eV. The narrowness of the main Raman peak (FWHM = 2.9 cm−1) and strong PL signal is indicative of the high material quality of the film obtained. Moreover, from 20 PL peak energy measurements over a wide range of the sample, deviation among the PL peak energy is less than 10 meV, which also confirms uniformity of the sample [inset of Fig. 1(f)].
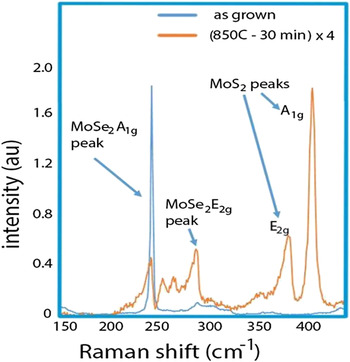
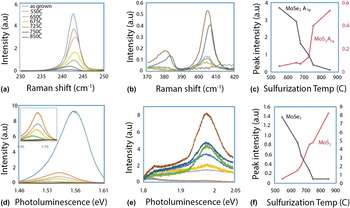
In Fig. 2, we compare the material properties of as-grown CVD MoSe2 to that of films sulfurized for 30 min at 850 °C. The Raman spectra shows a sharp drop in the intensity of the MoSe2 A1g peak with the simultaneous emergence of a strong peak at 405.7 cm−1 which corresponds to the MoS2 A1g peak. Reference Li, Zhang, Yap, Tay, Edwin, Olivier and Baillargeat14 This along with the decrease in PL intensity at around 1.56 eV (corresponding to MoSe2 direct band gap) Reference Tongay, Zhou, Ataca, Lo, Matthews, Li, Grossman and Wu15 and increase in PL intensity at around 1.91 eV (corresponding to MoS2 direct band gap) Reference Mak, He, Lee, Lee, Hone, Heinz and Shan16 points to the thermal conversion of MoSe2 to MoS2. To better understand the conversion process and show that conversion between the materials is possible we repeated the sulfurization experiments at different temperatures. For this purpose, a single CVD grown MoSe2 sample was cleaved into multiple pieces. In Figs. 3(a) and 3(b) we show how sulfurization affects the A1g Raman peaks of MoSe2 and MoS2, respectively. Intensity of the MoSe2 A1g peak decreases with sulfurization temperature, while the MoS2 A1g peak intensity increases. In Fig. 3(c), we display the intensities of the two peaks as a function of the sulfurization temperature. The black curve in Fig. 3(c) which corresponds to the drop in the MoSe2 A1g peak has three distinct regions. There appears to be a small change in the peak intensity between 550 and 650 °C (from 3.7 to 2.9) as well as another small change between 750 and 850 °C (0.42–0.12). However, a much sharper decrease in the intensity occurs between 650 and 750 °C (2.9–0.42). The red curve in the same figure shows the increase in the MoS2 A1g peak intensity and it roughly follows the inverse trend of the MoSe2 A1g peak intensity. In Figs. 3(d) and 3(e), the PL peaks at the energies expected for the MoSe2 and MoS2 direct band gap transitions can be seen. In Fig. 3(d), we observe that, besides the decrease in peak intensity, there is a red shift of the MoSe2 PL peak. This has been noted by others as well as for exfoliated samples into which defects have been introduced. A gradual strengthening of the peak at around 1.97 eV is observed in Fig. 3(e). In addition, Fig. 3(f) shows the intensity variation of the MoSe2 and MoS2 direct band gaps as a function of the sulfurization temperature. The shifting Raman and PL results demonstrate the ability to control the sulfurization of the MoSe2 film by temperature. We note that there is not a gradual shifting in the PL spectra which would have reflected transformation from MoSe2 to MoS2 through an intermediate MoSe x S y species. We hypothesize that the initial MoSe2 is a polycrystalline structure consisting of nanoscale domains, and these individual domains either get completely sulfurized or remain as MoSe2.
Raman spectra of the as grown MoSe2 film compared to the same film sulfurized at 850 °C for 30 min (intensity multiplied by 4).

Raman and PL spectra of the as grown films compared to those sulfurized at different temperatures. All Raman data have been normalized with respect to the Raman peak obtained from the Si. (a) Raman spectra in the 230–250 cm−1 range for the different samples. Peak around 241 cm−1 corresponds to the A1g peak seen for MoSe2 (b) Raman spectra in the 370–420 cm−1 range for the different samples. Peak around 380 cm−1 corresponds to the E1,2g peak for MoS2. Peak around 405 cm−1 corresponds to the A1g peak seen for MoS2. (c) Comparison of the normalized MoSe2 (left axis) and MoS2 (right axis) A1g peak intensities as a function of sulfurizing temperature. (d) PL spectra in the 1.46–1.61 eV range for different samples. Expected band gap of MoSe2 is at 1.56 eV. Inset shows relative peak intensities of sulfurized samples without as grown sample included. (e) PL spectra in the 1.8–2.05 eV range. Expected band gap of MoS2 due to the two excitonic transitions are at around 1.85 and 2.0 eV. (f) Intensity comparisons of the MoSe2 PL signal (left axis) and the MoS2 PL signal (right axis) as a function of sulfurization temperature.

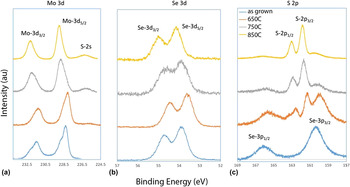
Elemental analysis was done using XPS, which indicates that sulfurization dominates more at higher temperature. Figure 4(a) shows the high resolution Mo-3d peaks from different samples. The film sulfurized at 650 °C remains almost the same as the as-grown film with only a very weak signal of S-2s peak. Mo-3d peaks for both cases show the presence of molybdenum oxide which vanishes for the films sulfurized at higher temperatures. The film sulfurized at 750 °C shows a clear presence of S-2s peak in the XPS spectrum, which becomes stronger for the film sulfurized at higher temperature (850 °C). Se-3d peaks [Fig. 3(b)] are present for all the samples sulfurized at different temperatures. This indicates that a part of the MoSe2 film remains in the film even after sulfurization at 850 °C. The results contradict an observation by Su et al. Reference Su, Hsu, Hsu, Chen, Chiu, Lin, Chang, Suenaga, He and Li17 where they could not observe any Se-3d signal from the MoSe2 film sulfurized at and above 800 °C. We have observed, though less intense compared to other cases, a clear signal from Se-3d peaks for the sample sulfurized at 850 °C. This difference can be attributed to several initial conditions of the experiment, e.g., the rate of sulfurization, the temperature, the film thickness, etc. The initial films used for sulfurization are also very different in both the cases—for our case, we started with a large area MoSe2 film, whereas, Su et al. started with individual triangular domains. Figure 4(c) shows the evolution of the S-2p and Se-3p peaks with sulfurization at different temperatures. It clearly shows that with rise in sulfurization temperature, S-2p peaks become stronger, indicating that a larger part of the film has been sulfurized. As expected, Se-3p 1/2 and Se-3p 3/2 peaks are very prominent in as-grown films. Though the strength of Se-3p peaks decreases with rise in sulfurization temperatures, it can be observed that even for the film sulfurized at 850 °C, a weak signal from Se-3p peaks still remains. The peak from S-2p arises for the film sulfurized at 650 °C. At this temperature, the relative intensity between Se-3p and S-2p peaks are comparable. At higher temperatures, the S-2p peaks become stronger compared to the Se-3p peaks indicating that the sulfurization process intensifies with a rise in sulfurization temperature.
High resolution x-ray photoelectron spectra from MoSe2 film compared before and after sulfurization at different temperatures: (a) Mo-3d, (b) Se-3d, and (c) Se-3p and S-2p peaks.

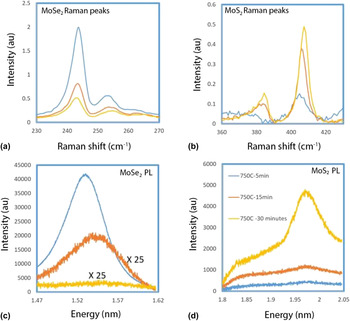
Figure 5 shows the MoSe2-to-MoS2 transition as a function of sulfurization time at a fixed temperature (750 °C). The results reveal that the Raman peak due to the MoSe2 A1g mode decreases as the time of sulfurization increases while that of the MoS2 A1g mode increases with increasing time. The PL peak corresponding to the MoSe2 direct band gap transition also decreases in intensity as sulfurization time is increased while that corresponding to the MoS2 direct transition increases.
Raman (a,b) and PL (c,d) spectra of time dependent sulfurization of MoSe2.

IV. CONCLUSION
In conclusion, a CVD method was developed and optimized to grow cm-scale uniform monolayer MoSe2. The resulting MoSe2 monolayer nano-sheets have excellent material properties with sharp and strong Raman and PL spectra. Conversion of the MoSe2 atomic sheets to MoS2 was observed after annealing under atmospheric pressure, high temperature, sulfur-rich environment. Systematic characterization including Raman, PL, and XPS revealed gradual conversion of MoSe2 to MoS2 with increasing sulfurization. Further experiments were conducted to explore the conversion criteria with respect to the sulfurization temperature and duration. Overall, this work promises a facile route toward synthesis of ternary TMD compounds or heterostructures, 2D materials design, and tunable optoelectronic properties.
ACKNOWLEDGMENTS
This work was supported in part by the Office of Naval Research (ONR), and the Army Research Office (ARO). M.V. and S.K.B. acknowledge support from the NASCENT NSF Engineering Research Center (ERC). The authors would also like to thank Dr. Di Wu and Prof. Keji Lai (Department of Physics, UT Austin).