Introduction
Cardiac remodelling is a dynamic process encompassing all molecular, cellular, and interstitial changes in the size, geometry, and function of the heart following myocardial damage or altered haemodynamic overload conditions. Reference Cohn, Ferrari and Sharpe1 Although initially arising as an adaptive response aimed at maintaining cardiac output, this process can, over time, acquire a pathological character and progress to ventricular dysfunction and heart failure. Reference Radosinska, Barancik and Vrbjar2,Reference Spinale, Coker and Thomas3 Often defined in the context of the left ventricle, the concept of remodelling involves unique and complex dynamics related to right ventricular pathophysiology in congenital heart surgery. In particular, surgical repair of pathologies presenting with right ventricular outflow tract obstruction, such as tetralogy of Fallot, offers one of the most striking examples of this process. Reference Apitz, Webb and Redington4 Ventriculotomy, infundibular resection, and transannular patch techniques applied during surgery inevitably lead to pulmonary failure and a chronic volume overload on the right ventricle while relieving right ventricular outflow tract obstruction. In the literature, it is widely accepted that this volume overload developing in the postoperative period is the primary determinant of right ventricular dilation, tricuspid regurgitation, and long-term right heart failure. Reference Gatzoulis, Clark, Cullen, Newman and Redington5–Reference Sachdev, Bhagyavathy, Varghese, Coelho and Kumar8 During the cardiac remodelling process, the balance of the extracellular matrix is determined by a delicate balance between “synthesis” and “degradation.” Disruption of this balance leads to fibrosis and increased ventricular stiffening through excessive collagen deposition or thinning and dilation of the ventricular wall through excessive degradation of the collagen network. Reference Spinale9 Extracellular matrix remodelling is regulated by a family of zinc-dependent endopeptidase enzymes called matrix metalloproteinases. Circulating levels of matrix metalloproteinase-2 and matrix metalloproteinase-9 have been shown to be important biomarkers in heart failure. Reference Radosinska, Barancik and Vrbjar2 However, data on the long-term course of these enzymes after right ventricular surgery are limited. Procollagen type-1 N-terminal propeptide reflects the current rate of type 1 collagen biosynthesis and, indirectly, the burden of myocardial fibrosis. Reference López, González and Díez10,Reference Querejeta, Varo and López11 The concept of “Restrictive Physiology,” whose role in determining disease course is often debated, has been successful in demonstrating its effect on ventricular function in recent studies. In the congenital heart surgery literature, restrictive right ventricular physiology is defined by the presence of antegrade flow to the pulmonary artery in late diastole. Reference Norgård, Gatzoulis, Josen, Cullen and Redington12 Regarding long-term prognosis, an increasing amount of evidence suggests that this physiology may have a “protective” role. Reference Norgård, Gatzoulis, Josen, Cullen and Redington12 In our hypothesis, agreeing with Gatzoulis et al., we hypothesised that the postoperative fibrotic response (high matrix metalloproteinase and procollagen type-1 N-terminal propeptide) stiffens the ventricular wall, creating a restrictive physiology, and that this stiffness acts as an “internal corset” or “biological banding” that prevents ventricular dilation against the excessive volume overload caused by pulmonary regurgitation. The aim of this study is to evaluate the relationship between postoperative matrix metalloproteinase-2, matrix metalloproteinase-9, and procollagen type-1 N-terminal propeptide levels and long-term right ventricular remodelling in patients assessed at mid- (6 months) and late (10 years) intervals.
Materials and methods
Study design and patient selection
This prospective comparative cohort study was conducted between 2012 and 2013. The study protocol was approved by the institutional ethics committee (Decision Date: 05.05.2012, Decision No: 07-06). Forty paediatric patients who underwent corrective surgery for CHD under cardiopulmonary bypass were included in the study. To ensure a non-restrictive baseline and to isolate the effect of the new remodelling process, all patients underwent a comprehensive preoperative echocardiographic evaluation; individuals exhibiting pre-existing late diastolic anterograde pulmonary flow (an indication of restrictive physiology) were strictly excluded from the study. Patients were divided into two groups: study group (n = 20): patients who underwent right ventricular outflow tract reconstruction via ventriculotomy due to right ventricular outflow tract (tetralogy of Fallot or severe pulmonary stenosis); control group (n = 20): patients who underwent Atrial septal defect (ASD) or Ventriculer septal defect (VSD) repair via transatrial approach only, without ventriculotomy, and who did not have right ventricular outflow tract stenosis were used as a control group for cardiopulmonary bypass effects.
Surgical Technique and Preoperative Management: All procedures were performed under general anaesthesia via median sternotomy. Following aortic and bicaval cannulation, the heart was stopped with cardioplegia. In the control group, defects were repaired transatrially. In the study group, infundibular muscle resection and, if necessary, pulmonary commissurotomy were performed via ventriculotomy. Right ventricular outflow tract reconstruction was completed using a transannular patch (n = 15) or subannular patch (n = 5) according to age-appropriate Hegar dilator measurements. Standardised surgical techniques were applied by the same team. Monocusp valve technique was not applied to these patients. Post-bypass, pressure gradients across the right ventricular outflow tract were measured; reconstruction was re-evaluated if the pressure difference exceeded 15 mmHg. Additionally, the right ventricular (RV)/left ventriculer (LV) pressure ratio was monitored intraoperatively using echocardiography. If the ratio exceeded 0.6, measurements were repeated 15 minutes after stabilisation.
Biochemical Analysis and Blinding: Venous blood samples were collected at three time points: preoperative (T0), 24–48 hours postoperatively (T1), and 6 months postoperatively (T2). Samples were collected in anticoagulant-free tubes, centrifuged at 4000 rpm for 10 minutes, and the separated serum was stored at −40°C. To ensure objectivity, laboratory personnel performing biochemical analyses were blinded to clinical groups and echocardiographic findings. Serum levels of matrix metalloproteinase-2, matrix metalloproteinase-9 (RayBio Human ELISA, RayBiotech Inc.), and procollagen type-1 N-terminal propeptide (CUSABIO Human ELISA Kit) were measured using a high-sensitivity competitive ELISA. Absorbance was read at 450 nm using a µ-quant microplate reader. Matrix metalloproteinase concentrations were calculated using KC4 software, and procollagen type-1 N-terminal propeptide levels were determined using the 4-parameter logistic (4-PL) curve fitting method.
Echocardiographic Follow-up: Echocardiographic assessments were performed at 1 week, 1 month, and 6 months. These patients were recalled for echocardiographic follow-up 10 years later to check for remodelling. The 10-year follow-up (2023) served as a cross-sectional snapshot to assess long-term remodelling. To ensure the highest level of objectivity, all 10-year echocardiographic assessments were performed by a single senior cardiologist unaware of the patients’ biochemical data and initial 6-month clinical groupings. Right ventricular dilation was defined as right ventricular end-diastolic volume index > 150 ml/m2 or diameter z-score > 2, while preserved geometry was defined as right ventricular end-diastolic volume index < 100 ml/m2 or diameter z-score < 1.5. Restrictive physiology was defined by the presence of late diastolic anterograde pulmonary flow (A wave) independent of respiration. Statistical analysis data were analysed using SPSS version 19.0 and presented as mean ± standard deviation or median (min-max). The Mann–Whitney U test was used for intergroup comparisons, and Bonferroni correction was applied to control for type I errors. Time-dependent changes were assessed using repeated measures ANOVA (multivariate analysis), applying Greenhouse–Geisser corrections where the sphericity assumption was violated. For the categorical variables in Table 2, Fisher’s exact test was used due to small subgroup sizes. Pearson correlation was used to assess the relationship between 6-month biomarker levels and 10-year right ventricular volumes. A p-value < 0.05 was considered statistically significant.
Results
Demographic data and patient characteristics
A total of 40 paediatric patients were included in the study (study group n = 20; control group n = 20). The mean age of the study group was 3.8 ± 2.3 years, and that of the control group was 4 ± 2.9 years, with no statistically significant difference (p = 0.940). The relatively high mean age at primary repair was attributed to the low socioeconomic status and delayed clinical presentation of the patient population.
Biochemical dynamics
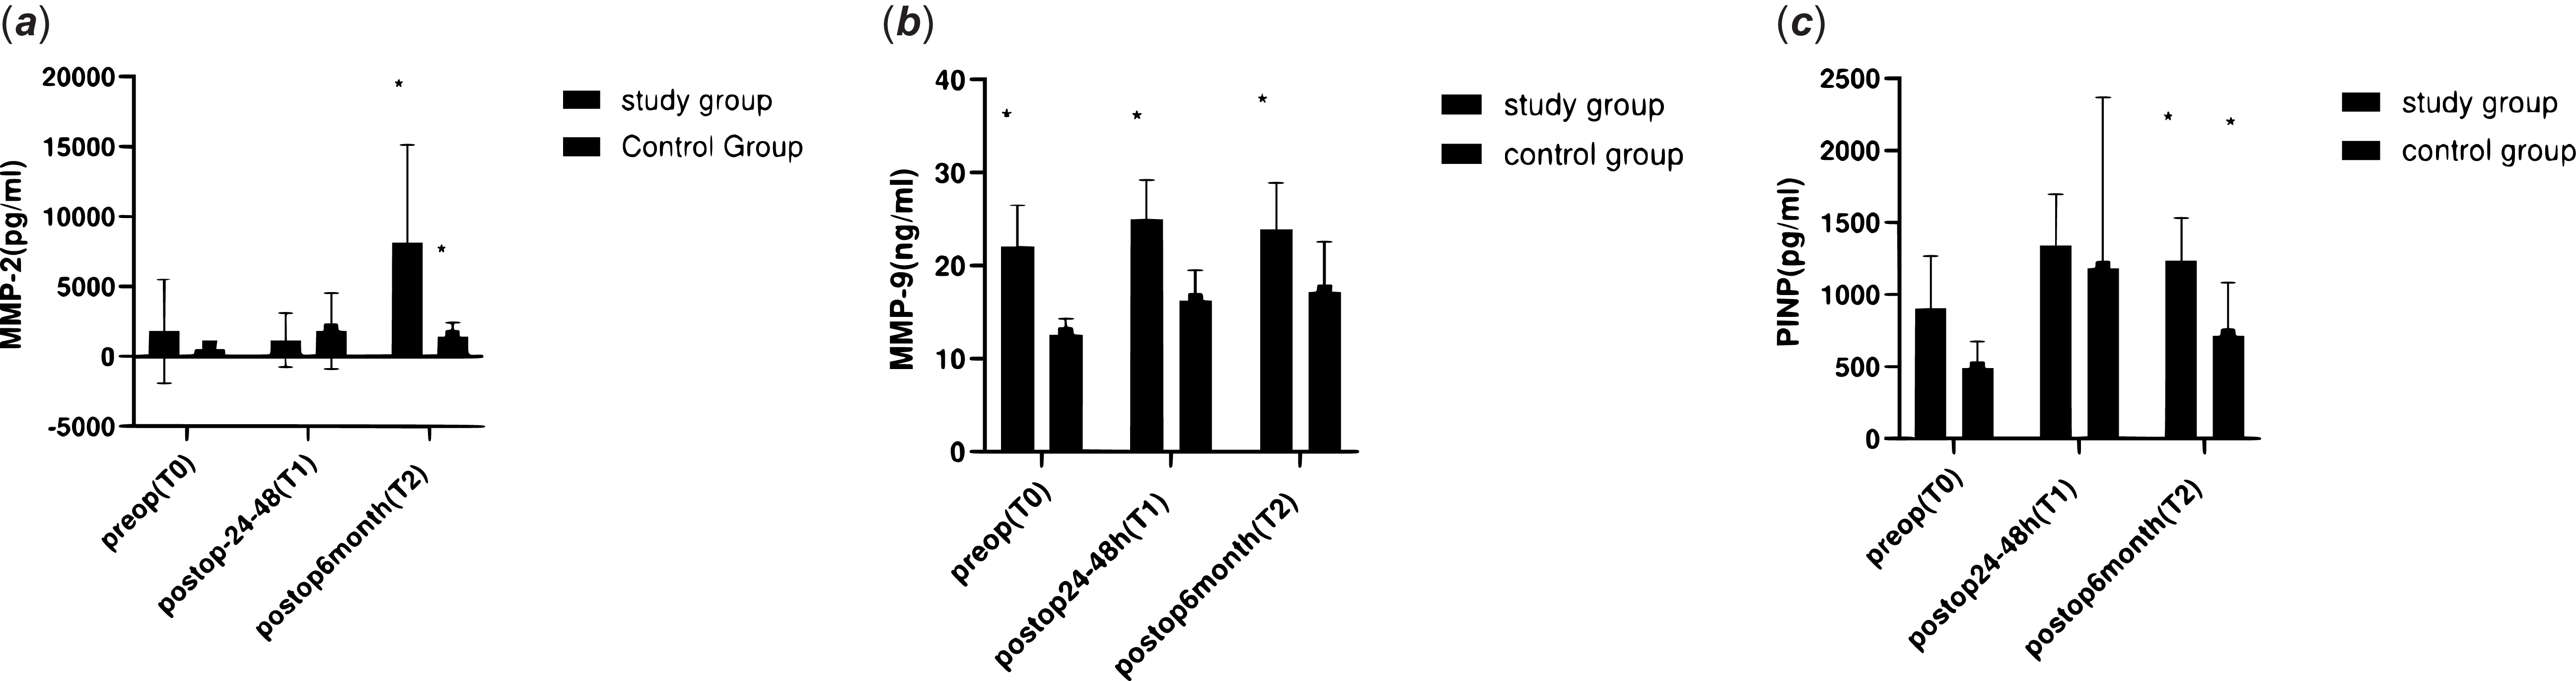
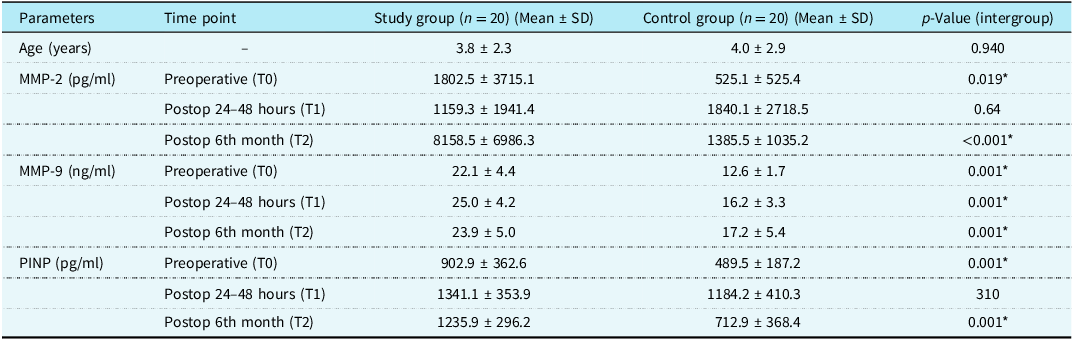
Although preoperative matrix metalloproteinase-2 levels were higher in the study group (p = 0.019), no significant difference was observed at 24–48 hours (p = 0.064). However, at 6 months, a dramatic and highly significant increase in matrix metalloproteinase-2 was observed in the study group compared to the control group (8158.5 ± 6986.3 vs. 1385.5 ± 1035.2 pg/ml; p < 0.001) (Figure 1). Matrix metalloproteinase-9 levels remained significantly higher in the study group at all time points (p = 0.001). Procollagen type-1 N-terminal propeptide levels increased similarly in both groups in the early postoperative period, reflecting surgical trauma (p = 0.310); however, they remained consistently high only in the study group at 6 months (p = 0.001) (Table 1) (Figure 2).
Longitudinal dynamics of myocardial remodelling biomarkers. (a) Matrix metalloproteinase-2 (MMP-2) levels (pg/ml). (b) Matrix metalloproteinase-9 (MMP-9) levels (ng/ml). (c) Procollagen type-1 N-terminal propeptide (PINP) levels (pg/ml). Data for the study (n = 20) and control (n = 20) groups are presented as mean ± SD. Statistical analysis was performed using repeated measures ANOVA with Bonferroni correction for post-hoc multiple comparisons . Asterisks (*) denote a statistically significant difference (p < 0.05) between the study and control groups at the specific time point.

Demographic data and biochemical biomarker levels across study periods

Data Presentation: Data are presented as mean ± standard deviation. Statistical Methods: Inter-group comparisons were performed using the Mann–Whitney U-test. Time-dependent intra-group changes were assessed via Repeated Measures ANOVA with Bonferroni correction applied for post-hoc multiple comparisons. Significance: (*) denotes statistically significant difference (p < 0.05) between the Study and Control groups at the specified time point. Assay Characteristics: Serum levels were measured using high-sensitivity competitive ELISA (MMP-2/MMP-9: RayBio Human ELISA, RayBiotech Inc.; PINP: CUSABIO Human ELISA Kit). MMP = matrix metalloproteinase; PINP = procollagen type-1 N-terminal propeptide.
Temporal changes in serum MMP-2, MMP-9, and PINP levels across study periods. The graph illustrates the biochemical profile of the study group (n = 20, blue) and control group (n = 20, red) at preoperative (T0), early postoperative (T1: 24–48 hours), and late postoperative (T2: 6th month) stages. Note the significant divergence at the 6th month, where MMP-2 and PINP levels remain elevated in the study group despite the resolution of the acute surgical trauma. Data Presentation: Values are expressed as mean ± SD. Statistical significance: (*) denotes p < 0.05$ between groups; (†) denotes p < 0.05 compared to T0 within the group (Repeated measures ANOVA with Bonferroni post-hoc test). Abbreviations: MMP = matrix metalloproteinase; PINP = Procollagen Type-1 N-terminal Propeptide.

Clinical and echocardiographic
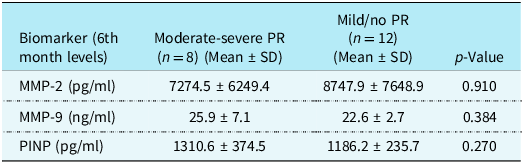
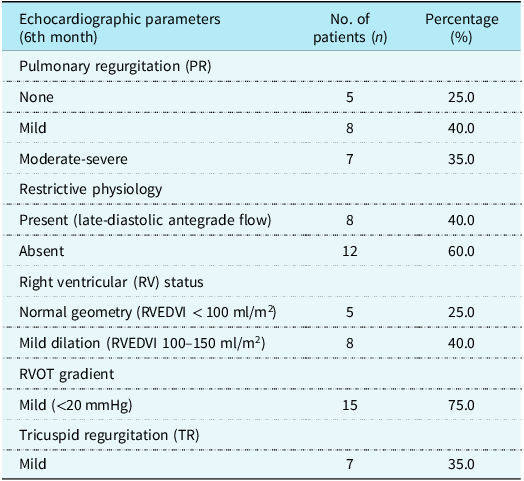
Results: At 6 months, moderate to severe pulmonary regurgitation was detected in 35% (n = 7) of the study group. During this 6-month period, restrictive physiology (late diastolic antegrade pulmonary flow) was detected in 40% (n = 8) of patients. Importantly, there was no significant correlation between pulmonary regurgitation severity and matrix metalloproteinase-2 (p = 0.910), matrix metalloproteinase-9 (p = 0.384), or procollagen type-1 N-terminal propeptide (p = 0.270) levels; this suggests that the biochemical increase at 6 months is an intrinsic myocardial response to surgical reconstruction, rather than a direct consequence of haemodynamic volume overload (Table 3).
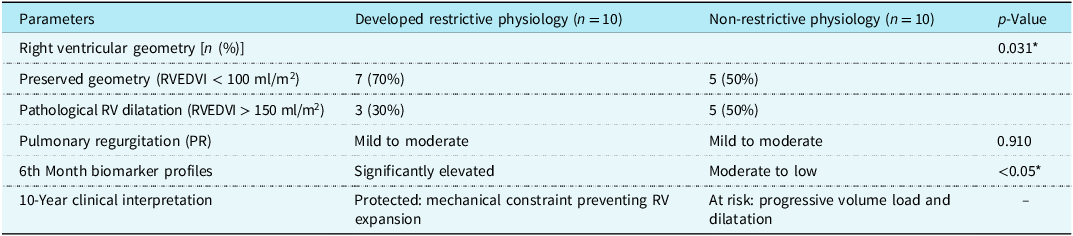
10-Year follow-up outcomes of the study group (n = 20) stratified by restrictive physiology status

Data Presentation: Results are presented as frequencies (n) and percentages (%) or clinical descriptors. Temporal Progression: The restrictive group includes 8 patients identified at 6 months and 2 additional patients who developed the restrictive pattern by the 10th year, representing a maturation of the diastolic remodelling process. Statistical Methods: Categorical variables were analysed using Fisher’s Exact Test due to small subgroup sizes. Continuous biomarker correlations were assessed via Pearson analysis. Significance: (*) denotes statistically significant difference (p < 0.05). RV = Right Ventricle; RVEDVI = Right Ventricular End-Diastolic Volume Index.
Comparison of postoperative 6th-month biomarker levels according to pulmonary regurgitation severity within the study group (n = 20)

Data are presented as Mean ± Standard Deviation. Inter-group comparisons were performed using the Mann–Whitney U-test. All p-values > 0.05 indicate that biochemical activity at 6 months is independent of the severity of pulmonary regurgitation. MMP = matrix metalloproteinase; PINP = procollagen type-1 N-terminal propeptide; PR = Pulmonary Regurgitation.
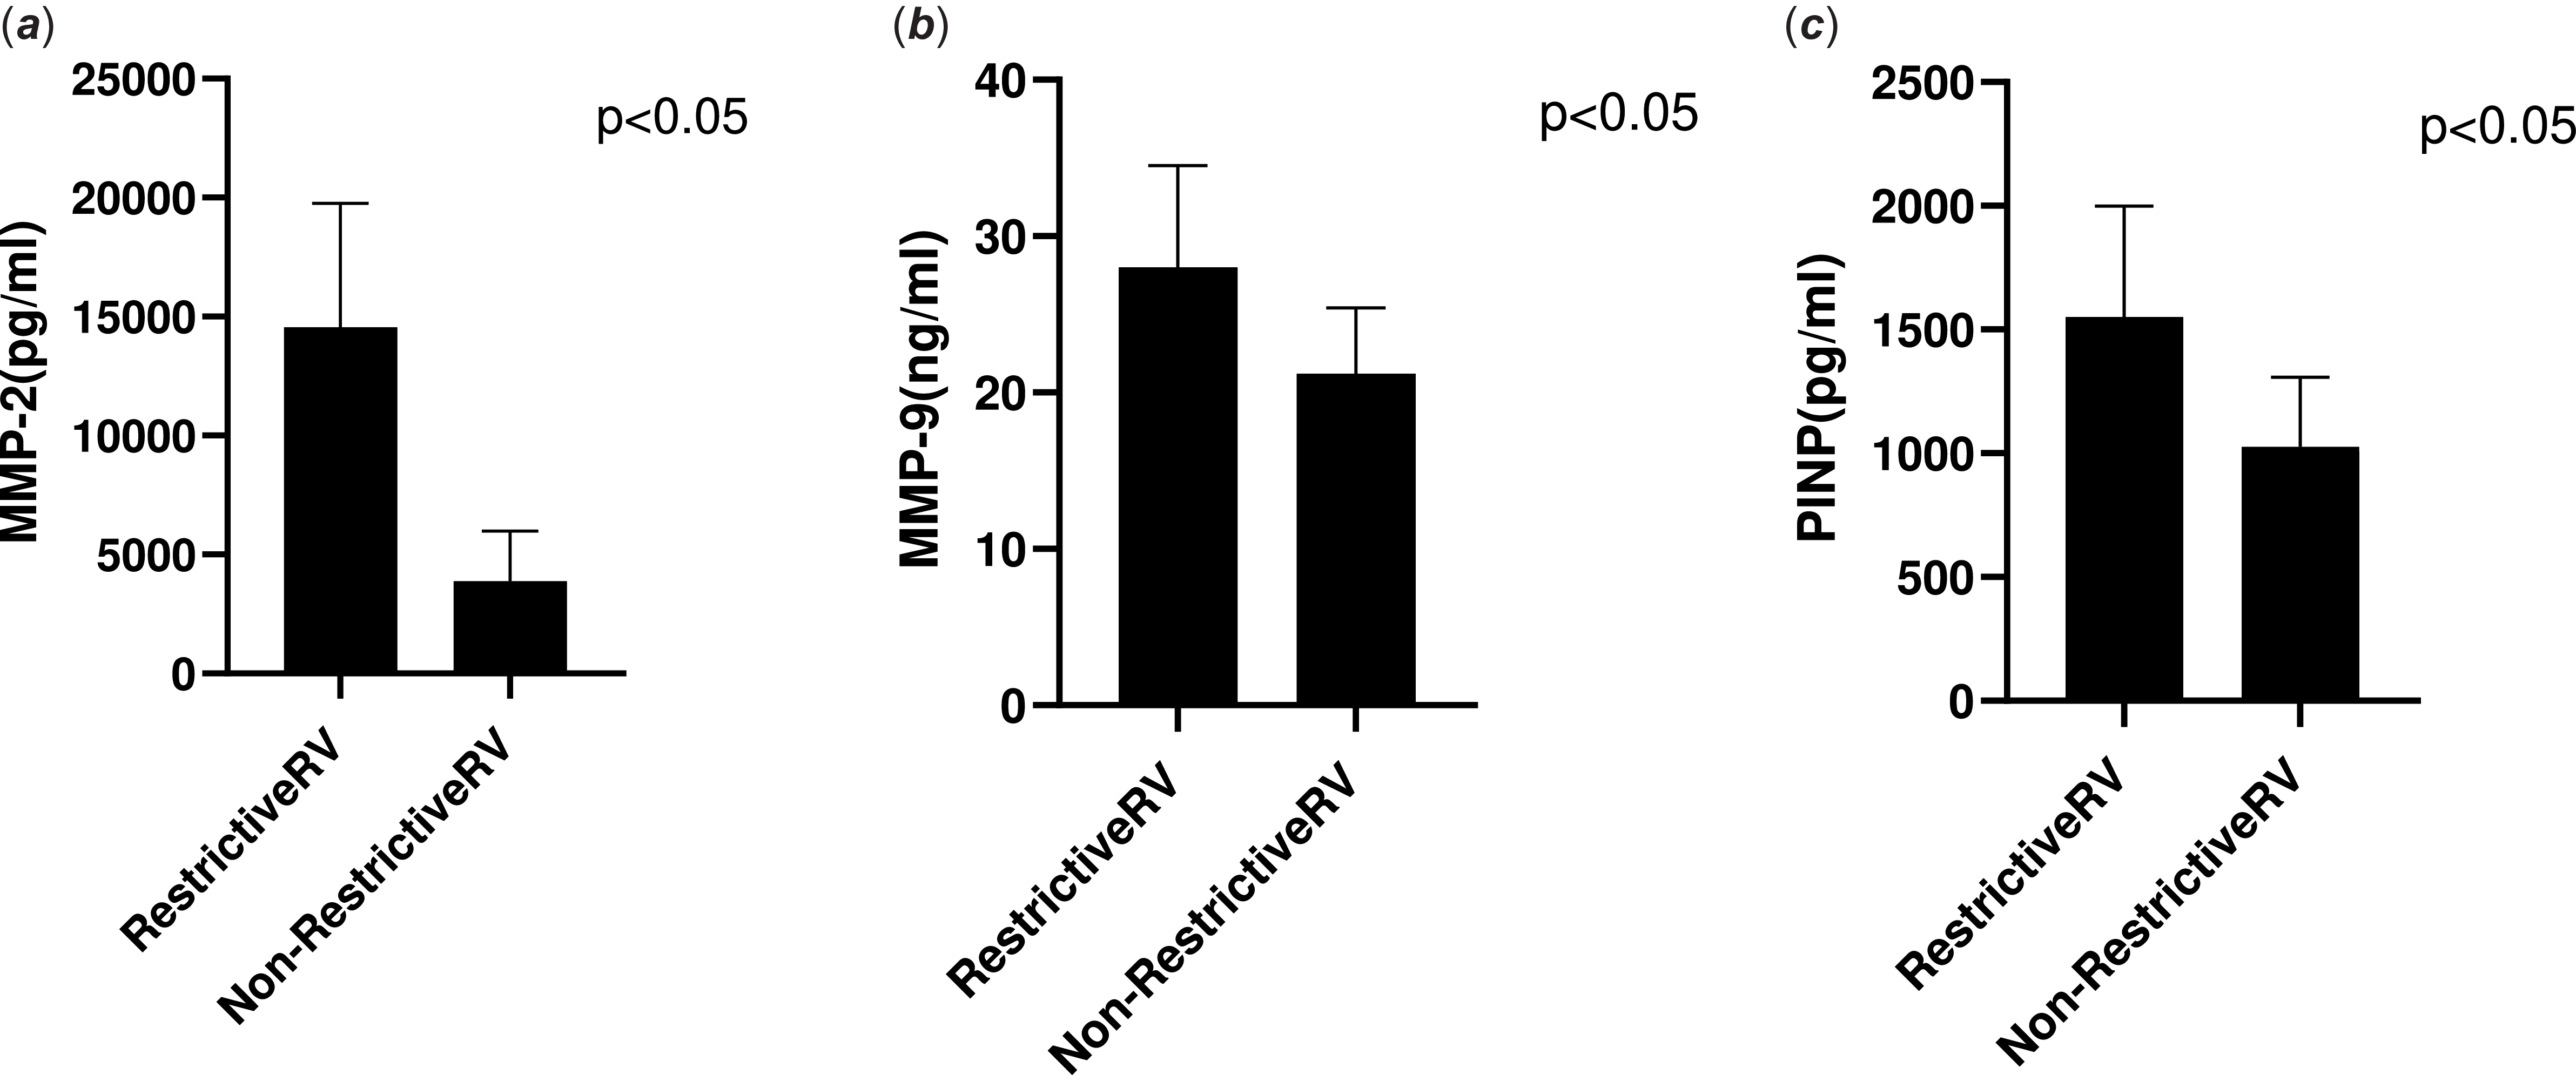
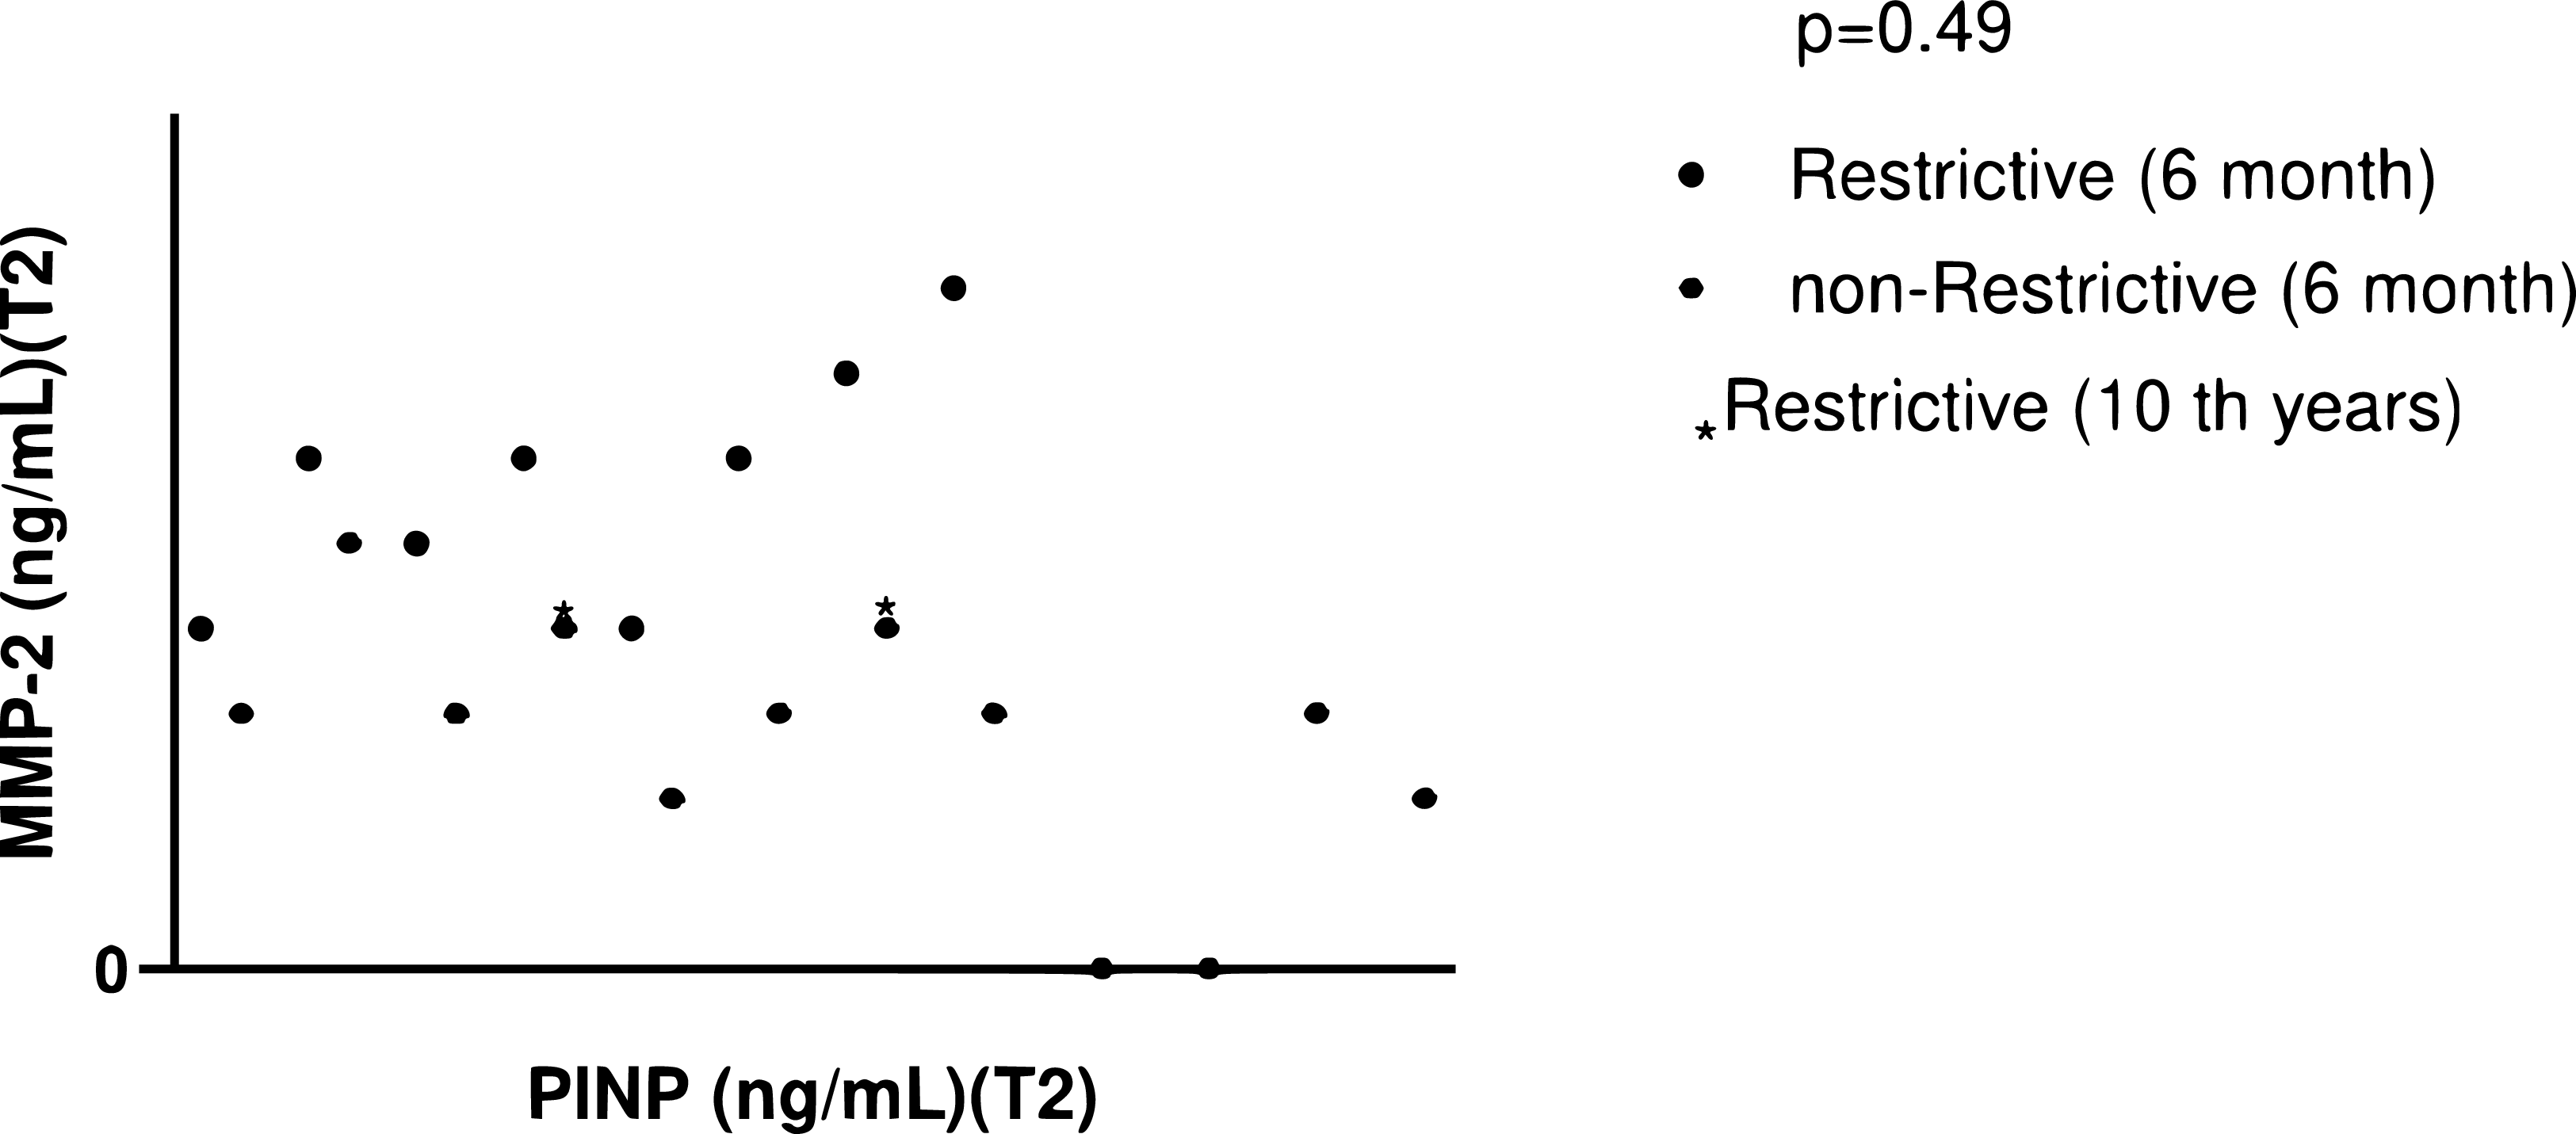
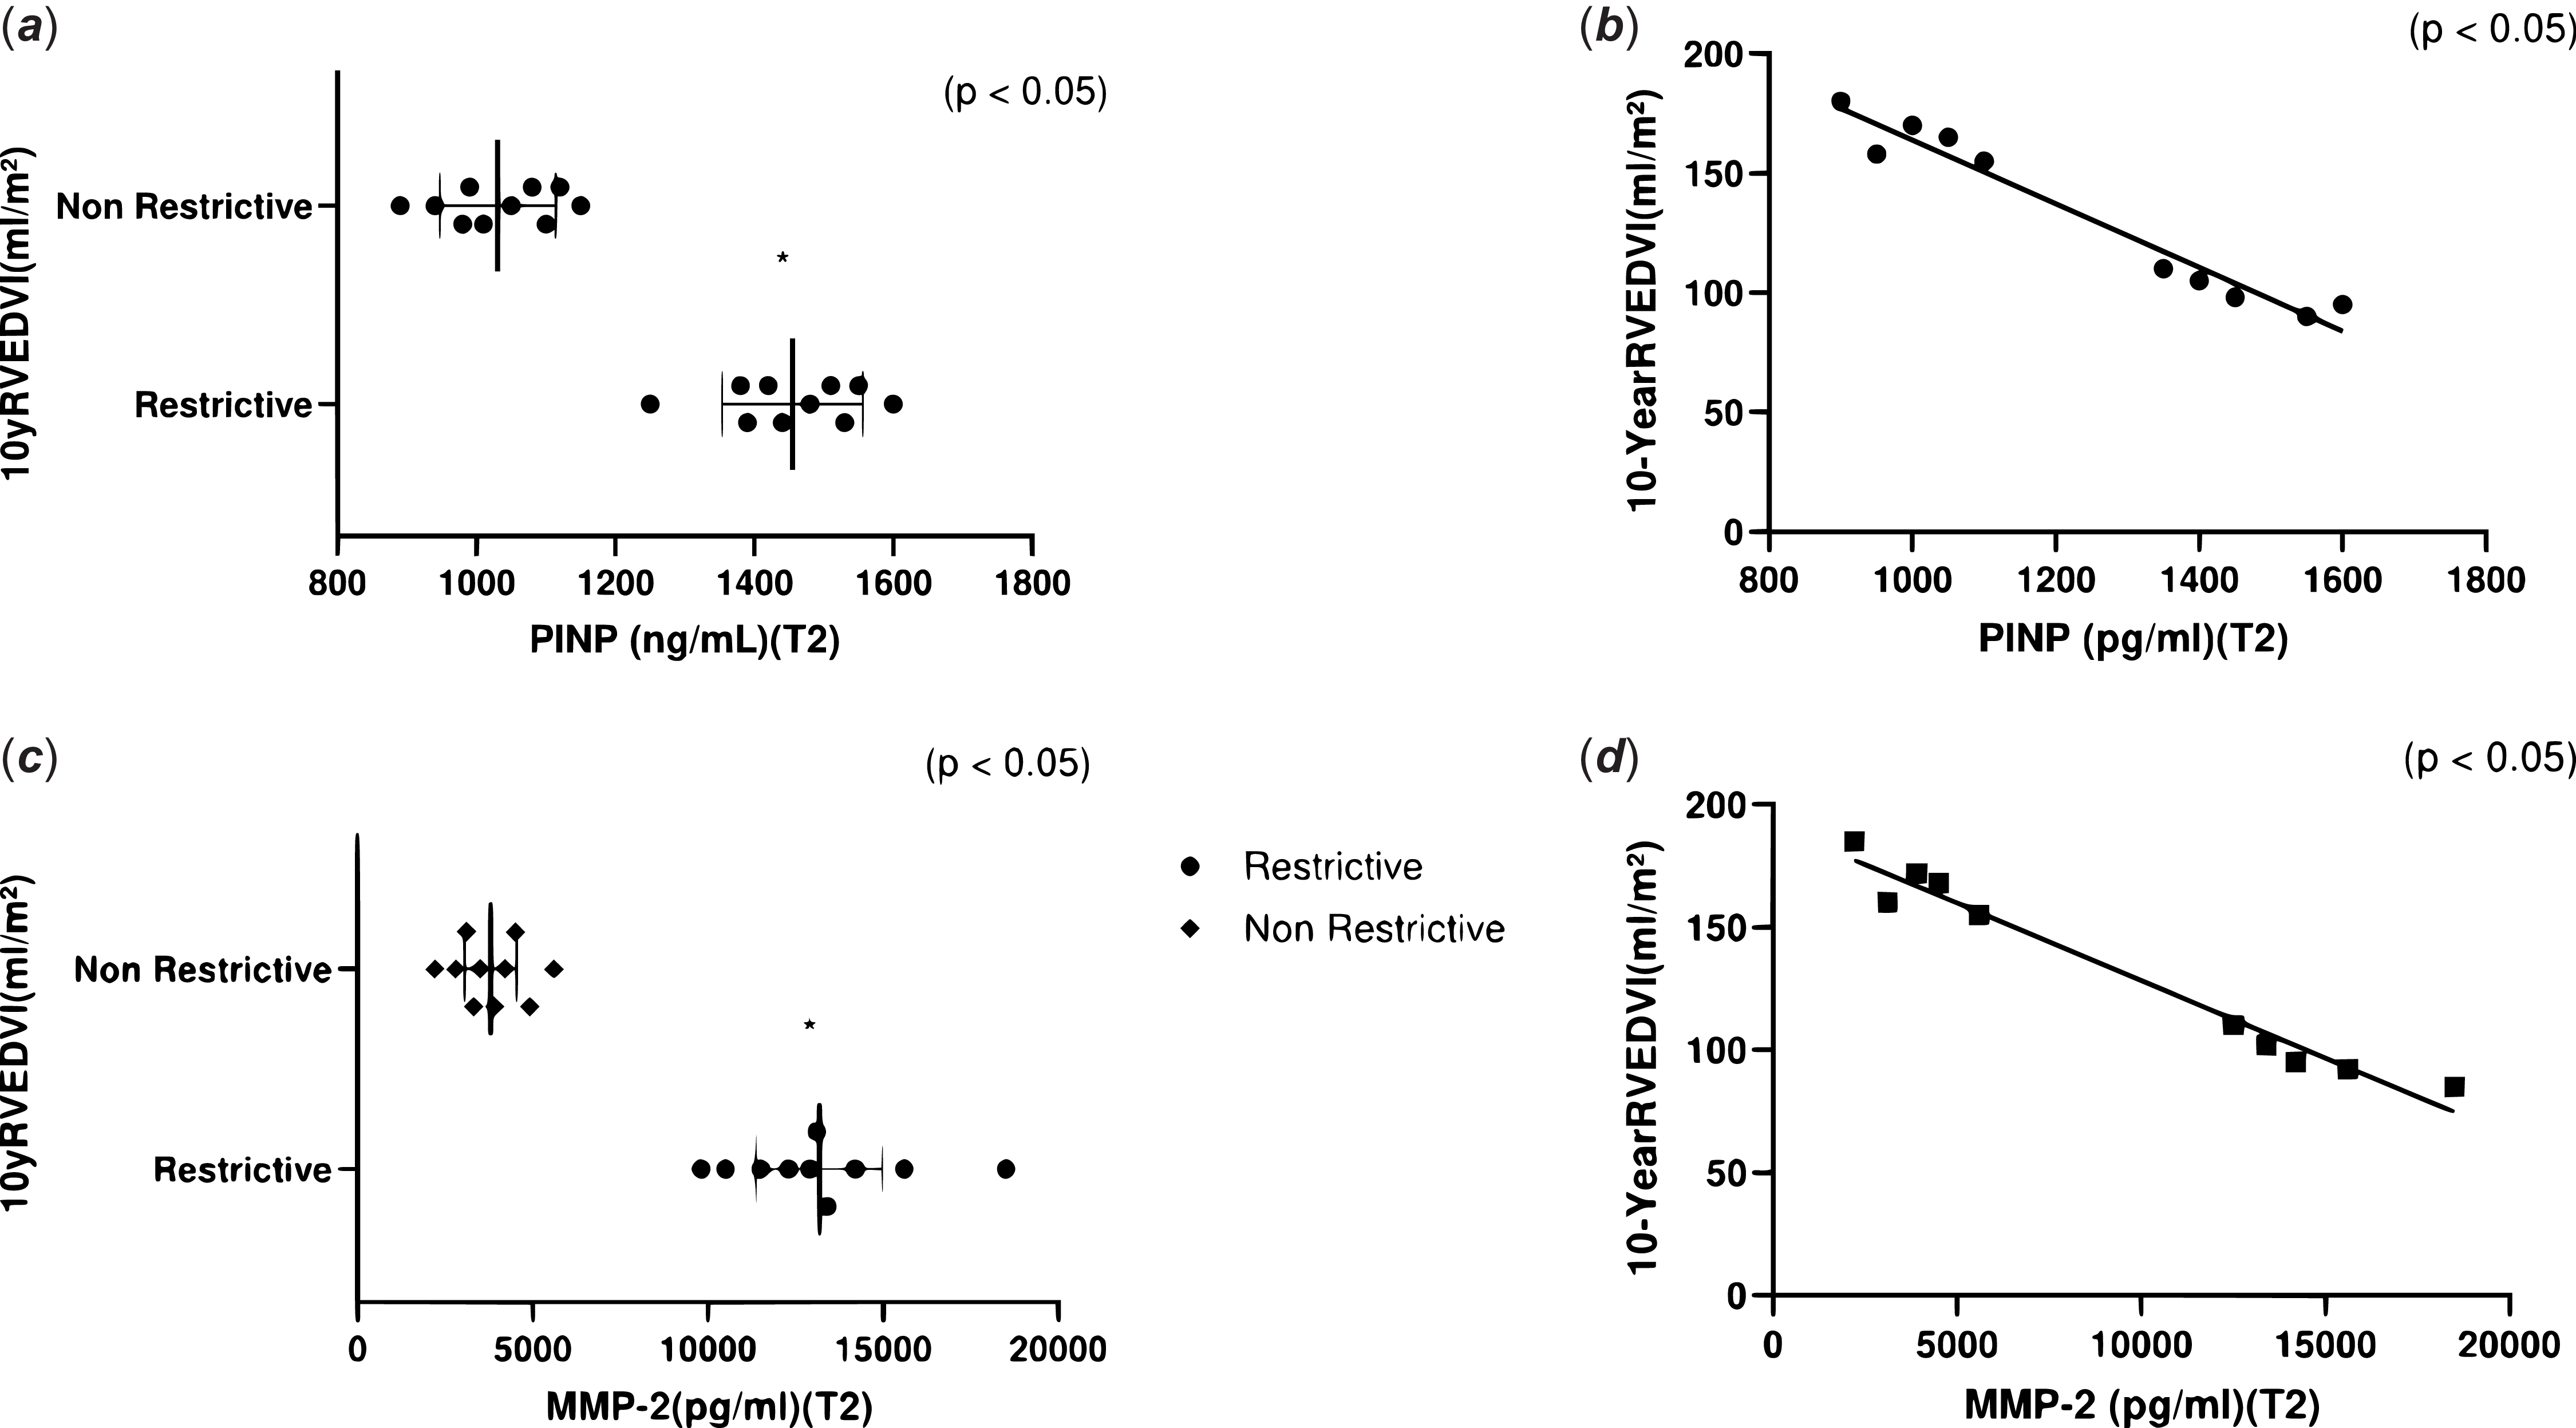
“Temporal Evolution of Restrictive Physiology: A 10-year longitudinal evaluation revealed a significant temporal evolution in the restrictive pattern. While 8 patients (40%) were identified as restrictive at 6 months of follow-up, 2 more patients developed restrictive physiology at 10-year follow-up. The number of patients with restrictive physiology reached 10 (50%). All 8 patients who initially exhibited restrictive flow at 6 months maintained this pattern for ten years; this suggests that once established, the “biological banding” effect is a stable and potentially maturing phenomenon rather than a temporary surgical outcome.” In the restrictive group (n = 10), right ventricular geometry was preserved in 70% (n = 7) of patients (right ventricular end-diastolic volume index < 100 ml/m2). In contrast, in the non-restrictive group (n = 10), the rate of pathological ventricular dilation (50%) was significantly higher (right ventricular end-diastolic volume index > 150 ml/m2) (Table 4). Pearson correlation analysis showed that higher biomarker levels at month 6 were significantly associated with long-term outcomes. We found a significant negative correlation between month 6 procollagen type-1 N-terminal propeptide levels and year 10 right ventricular end-diastolic volume index (r = −0.64, p = 0.012) and between 24-hour matrix metalloproteinase-9 levels and year 10 right ventricular end-diastolic volume index (r = −0.58, p = 0.024). These findings support the “biological banding” hypothesis, where early fibrotic signalling is associated with preventing late-stage irreversible right ventricular dilation (Figure 3).
Echocardiographic and clinical outcomes of the study group at the postoperative 6th month (n = 20)

Data Presentation: Results are presented as absolute numbers (n) and percentages (%). Definitions: RV Dilatation was defined as Right Ventricular End-Diastolic Volume Index (RVEDVI) > 150 ml/m2 or a diameter z-score > 2; Preserved Geometry was defined as RVEDV I < 100 ml/m2. Restrictive Physiology: Identified by the presence of late-diastolic antegrade pulmonary flow (A-wave) independent of respiration on pulsed-wave Doppler. Statistical Note: Categorical variables were assessed using descriptive statistics and Fisher’s exact test where applicable for subgroup comparisons.
Correlation between 6th-month biomarker activity and 10-year right ventricular (RV) remodelling. Scatter plot demonstrating the relationship between 6th-month serum PINP (pg/ml) levels and the 10-year right ventricular end-diastolic volume index (RVEDVI, ml/m2). Clinical insight: patients who developed restrictive physiology (n = 10, red circles) exhibit higher biomarker levels at 6 months, which strongly correlates with preserved RV geometry (RVEDVI < 100 ml/m2) at the 10-year follow-up. In contrast, the non-restrictive group (n = 10, blue squares) shows lower biochemical activity and a higher risk of pathological RV dilatation (>150 ml/m2). Statistical analysis: Pearson correlation coefficient (r) and p-values are indicated on the chart. The dashed line represents the threshold for RV dilatation.

Discussion
This study examined preoperative and postoperative levels of matrix metalloproteinase-2, matrix metalloproteinase-9, and procollagen type-1 N-terminal propeptide, comparing these biochemical data with 10-year echocardiographic results. The methodological strength of our study lies in the comparative analysis between the research group and the control group. This approach demonstrates that the detected fibrotic response is a specific process related to surgical ventriculotomy rather than the general systemic effects of cardiopulmonary bypass. Through this design, we showed that the biochemical burst at 6 months is a programmed mechanism that sets the stage for long-term restrictive physiology.
The most significant biochemical finding is the dramatic increase in matrix metalloproteinase-2 levels at 6 months postoperatively. The difference at 6 months (8158.5 vs. 1385.5 pg/ml; p < 0.001) suggests a “high-speed” remodelling process. Spinale et al. emphasised that in chronic volume overload, extracellular matrix degradation is primarily due to increased matrix metalloproteinase activity. Reference Spinale9 Our results demonstrate that this increase in matrix metalloproteinase-2 points to an aggressive defensive response against chronic volume overload, exceeding a simple postoperative wound healing process. Another marker indicating this process is matrix metalloproteinase-9. In our study, matrix metalloproteinase-9 levels remained elevated from the preoperative period and maintained this elevation at 6 months (p = 0.001). Our findings show that this elevation signals tissue-level remodelling much earlier than clinical findings and supports the view that circulating biomarkers are sensitive indicators of early structural changes. Reference Krum, Elsik and Schneider13 The significant increase in procollagen type-1 N-terminal propeptide levels at 6 months (p = 0.001) supports the argument that the process is not merely deterioration but active remodelling. As shown in the literature, type 1 collagen markers, in particular, show a strong correlation with tissue-level fibrosis. Reference López, González and Díez10,Reference Querejeta, Varo and López11 The clinical reflection of this fibrotic response contains a paradoxical protective effect. High procollagen type-1 N-terminal propeptide activity protects the ventricle from fatal enlargement caused by long-term pulmonary failure by forming a resilient collagen network. Reference Yamamura, Yuen and Hickey14
Our 10-year data support the structural basis of this theory. We observed that restrictive physiology progressed from 40% (n = 8) at 6 months to 50% (n = 10) at 10 years, indicating that this adaptive pattern matures over time. Formal Pearson correlation analysis further solidifies this, showing a significant negative correlation (r = −0.64, p = 0.012) between 6-month procollagen type-1 N-terminal propeptide levels and 10-year right ventricular end-diastolic volume index. This supports our (Figure 4) “Biological Banding” hypothesis. While early clinical opinions often associated restrictive physiology with acute postoperative risks, our 10-year results support the findings of Gatzoulis et al. and Norgård et al., confirming the long-term benefits suggested by these authors.Reference Norgård, Gatzoulis, Josen, Cullen and Redington12 It implies that late-phase diastolic restriction is protective against irreversible right ventricular enlargement. This demonstrates that the fibrotic response is an intrinsic mechanism triggered by surgical trauma. The resistance created by myocardial fibrosis acts as a “restrictive armor” or “internal corset,” limiting volumetric changes. This mechanism, which keeps wall stress under control according to Laplace’s Law, is the key element in preventing ventricular enlargement to pathological limits despite chronic volume overload.
Comparative analysis of RV geometry based on restrictive physiology status. Grouped scatter plot (Column scatter) comparing (a) MMP-2 and (b) RVEDVI values between patients with and without restrictive physiology. Observation: The presence of late-diastolic antegrade pulmonary flow (Restrictive physiology) acts as a “mechanical constraint,” preventing progressive RV expansion. This protective effect is biochemically mirrored by significantly higher MMP-2 and PINP levels at the 6th month (p < 0.05). Data presentation: each point represents an individual patient. Horizontal lines indicate the median and interquartile range (IQR). Statistical analysis: Inter-group comparisons were performed using Fisher’s exact test for categorical geometry data and Mann–Whitney U-test for continuous biomarker data.

Conclusion
This study reveals that sustained elevation of matrix metalloproteinase-2 and procollagen type-1 N-terminal propeptide is an active “reparative remodeling” process that determines long-term right ventricular geometry. Restrictive physiology exhibited paradoxical protection even in the late phase in our study. Patients who developed restrictive physiology through high early fibrotic activity were protected from irreversible ventricular dilation (right ventricular end-diastolic volume index > 150 ml/m2) despite chronic volume overload. This vital adaptive mechanism surrounds the right ventricle like a “biological band” mechanically preventing it from exceeding its irreversible expansion limit.
Limitations of the study
There are several methodological limitations to consider when evaluating the findings of this study:
Sample Size and Exploratory Nature: The study was conducted at a single centre with a relatively small sample size. Therefore, our findings aim to provide a baseline for future larger-scale multicentre studies.
Long-Term Follow-up and Socio-economic Constraints: Due to the low socio-economic status of a significant portion of our patient population and limited access to regular high-tech imaging in their regions, continuous annual follow-up was not possible. Consequently, our 10-year data represent a “cross-sectional snapshot” rather than a continuous longitudinal series.
Imaging Methods: Although cardiac MRI and strain imaging are gold standards for assessing right ventricular volume and function, they were not consistently available for all patients throughout the ten-year follow-up period. To minimise observer bias in our echocardiographic assessments, all 10-year measurements were performed by a single senior cardiologist unaware of the patients’ biochemical and 6-month data.
Lack of Histopathological Confirmation: Due to the invasive nature and ethical concerns of endomyocardial biopsy, the presence of myocardial fibrosis could not be histologically proven. Matrix metalloproteinase and procollagen type-1 N-terminal propeptide levels were used as confirmed surrogate markers of extracellular matrix turnover and collagen synthesis.
Procollagen type-1 N-Terminal Propeptide Specificity and Surgical Trauma: Procollagen type-1 N-terminal propeptide is not solely myocardial tissue-specific and may increase during bone healing after median sternotomy. However, the inclusion of a control group undergoing a similar surgical incision (transatrial repair) allowed us to isolate the specific biochemical response associated with right ventricular outflow tract reconstruction.
Relational and Causal Mechanisms: Given the observational nature of the study design, we emphasise that the identified relationships between early biomarker dynamics and long-term restrictive remodelling are relational. While our data support the “biological banding” hypothesis, these relationships do not definitively prove causality.
Potential Confounders: Despite the use of a standardised surgical technique (transannular patch without monocusps), individual differences in right ventricular reserve and microscopic variations in patch geometry remain natural confounders that could influence long-term remodelling.
Acknowledgements
The authors would like to thank the clinical staff of the Department of Cardiovascular Surgery at Cukurova University for their support during the data collection process.
Financial support
This research received no specific grant from any funding agency, commercial or not-for-profit sectors.
Competing interests
The authors declare no conflict of interest.