Are recessions cleansing, with the least productive businesses driven out during busts? This question has received much attention going all the way back to Joseph A. Schumpeter (Reference Schumpeter1942). However, providing quantitative evidence has proven difficult due to a lack of detailed micro-level data at a business cycle frequency. In an important work, Bresnahan and Raff (Reference Bresnahan and Raff1991) showed that, for the automobile industry during the Great Depression, it was the least productive plants, in particular those slowest to adopt mass production technologies, that were driven out of the market. However, recent work by Changkeun Lee (Reference Lee2014) has challenged their analysis. He finds, after gathering more information on the capital stock of the plants, that the best predictor of survival is not productivity but sheer size.
We reconsider the question of selection over the Great Depression for the radio equipment sector. Radio stands alongside automobiles as the archetypal “new era” technologies of the 1920s. Although radio equipment was a markedly smaller sector than automobiles, the explosive diffusion of this new medium nevertheless had far-reaching economic, social, and technological impacts. Entertainment radio is credited with unifying an ethnically and culturally diverse nation, ending the isolation of rural and small-town America, and reducing linguistic diversity—establishing “broadcast English” as the new national popular norm. It also had major impacts on a broad range of cultural and creative industries, particularly advertising and popular music (Mander Reference Mander1984; Fox Reference Fox1984, p. 150; Hilmes Reference Michele1997, pp. 5–20).
The emergence of mass production technologies during the early decades of the twentieth century is rightly viewed as having played a central role in the development of cheap, standardised consumer durables and the growth of the modern industrial corporation. Much research on mass production technology in this era has focused on the example of motor vehicles and stressed the development of “L” shaped cost curves and the considerable scale economies yielded by the new production technologies (Chandler Reference Chandler1990, pp. 21–28). However, the technology of automobile production was not typical of the new assembly consumer durables industries. Automobile manufacture involved the production of machines with very large numbers of moving parts, which had to be lubricated, powered, and cooled by various liquids without leakage. This necessitated production and fitting of inter-connected components to very close tolerances, which made the substitution of highly-skilled labour by dedicated machine tools attractive. Oddly, in contrast to the auto industry, there has been relatively little research on production systems for domestic appliances.
In common with most powered domestic appliances, radios had far fewer moving parts and did not require complex hydraulic systems. This had important implications for production systems and product innovation. Radio represented a new type of assembly manufacturing, where small firms could compete with industry leaders owing to three interrelated factors: simple assembly operations; modular components; and a technological standard that could accommodate innovations in individual components, or in their combinations, without simultaneous modifications to other elements. Production technology mainly involved mounting components on to “boards” or “chassis”—by hand or using simple, generic, tools. Components were “modular” (compatible with a wide range of alternative components), giving assemblers the option of cheaply buying in standardised components, or directly producing customised ones. These characteristics were to become recurrent features of the electronics industry—most famously in the early microcomputer sector, where a wealth of small and medium assemblers competed through extensive use of bought-in standard components, while also often engaging in some degree of product differentiation (Langlois Reference Langlois1992; Angel and Engstrom Reference Angel1995).
We first provide quantitative evidence for the limited scale economies in the inter-war radio industry. Published industry-level Census data suggest that this industry was characterised by much weaker scale economies than were evident for motor vehicles and markedly less concentration of production among the largest plants. However, drawing conclusions for the plant-level from industry-level aggregates is fraught. Instead our analysis employs the original returns to the 1929, 1931, 1933, and 1935 Census of Manufactures. We confirm the lack of scale economies with establishment-level data; large plants being no more productive than smaller ones in terms of revenue, or value added, per worker.
This does not necessarily rule out scale economies if there are price differentials between firms. Productivity in terms of revenue or value added is not the same as productivity in terms of actual output. Price differences for identical or slightly differentiated products will obscure true differences in physical productivity, particularly if prices are inversely related to physical productivity. Recently, Thomas J. Holmes and John J. Stevens (Reference Holmes and Stevens2013) have argued that the observed modern within-industry variation in revenue productivity is driven, at least in part, by this problem—with sectors such as furniture including both mass production plants and small-scale craftsmen, producing very different products. Similar considerations are relevant for the radio industry at a time when, plausibly, a group of mass production plants might have served a market for standardised goods with low unit prices alongside plants producing niche or high-end products—selling at higher prices. This possible negative correlation between the price that a firm charges and its physical productivity would obscure any scale effects. However, we find exactly the opposite, with small establishments producing radios of lower average unit price and more simplified design than the market leaders. This strengthens our claim that the radio industry did not exhibit scale economies.
We then analyse the determinants of plant exit. To reiterate, Bresnahan and Raff (Reference Bresnahan and Raff1991, 1998) found that within-industry heterogeneity in technology (owing to the incomplete diffusion of mass production methods and the continuing viability of craft methods for niche producers) was reflected in substantial cost heterogeneity, with the largest plants adopting this technology early. Maybe unsurprisingly then, during the Depression, size—through its relationship with technology, productivity, and sunk costs—was an important determinant of plant survival (Bresnahan and Raff Reference Bresnahan and Raff1991, pp. 317–31). Now for the radio industry, the absence of evidence for scale effects does not necessarily imply that productivity or size were unimportant for selection. In fact, we find empirically that larger plants had markedly higher survival rates, though this was not driven by higher productivity. So what is driving selection on size in the radio industry?
We focus on one non-productivity related factor, brand ownership. An examination of exit rates for plants owned by firms with recognised proprietary receiver brands and those which lacked such brands indicates a clear relationship between brand ownership and survival rates, even after allowing for the larger average size of firms producing under their own brands. Still plant size continues to play a role in reducing exit rates. We speculate that the persistence of the effect of size reflects nontechnical scale economies in areas such as finance and product diversification, together with more intensive investment in branding by the leading firms.
These results shed important insights into the interaction between the Great Depression and productivity and the general evolution of industries. Alexander J. Field (Reference Field2012) has argued that the Depression was a time of very fast productivity growth. Field does not much emphasize the role of industry evolution in aggregate productivity dynamics, instead focusing on major process and product innovations and public investments. This stands in contrast to much of the recent work summarized by Chad Syverson (Reference Syverson2012) on the importance of selection for productivity. Our study suggests a more complex role of business cycles in shaping an industry than that identified in Bresnahan and Raff for automobiles. The point we make echoes that of Lucia Foster, John Haltiwanger, and Syverson (2008), who note that selection is based on profitability. Yet profitability is directly related to physical productivity only in industries with perfect competition. In markets with less than perfect competition, firms can attempt to profit and survive through many other strategies than simply increasing productivity.
THE DATA SOURCE
We use plant-level data from the Census of Manufactures for 1929, 1931, 1933, and 1935 (Ziebarth 2013 provides detailed discussion of these sources). The schedules provide rich information on output and revenue by various types of products, as well as labour and other inputs. There is also identifying information that allows us to link plants over time and to their parent companies. Bresnahan and Raff (Reference Bresnahan and Raff1991) used the Census schedules for the automobile industry. We should note one difficulty with this source; the Census industry classification includes not only radio products. The “radio” series also encompasses the phonograph industry, together with a variety of radio-related goods for business users—such as broadcasting, public address, intercom, and microphone equipment. We classify establishments into receivers, tubes, components, and “others” (accessories, phonograph production, or radio equipment for business uses), if at least 50 percent of output by value is in the specified category. A final miscellaneous category captures both plants with insufficient product data for classification and those where no one class of output accounted for one-half or more of the total. Radio producers were not separately classified in the 1929 Census. For this year, data are assembled from individual Census returns in the “Electrical machinery and apparatus” classification, with product descriptions that match the subsequent “Radio and phonograph industry” classification. This inevitably adds an element of uncertainty to comparisons between 1929 and subsequent Census years.
These establishments' multi-product nature makes calculating and comparing productivity challenging. Unfortunately it was pervasive. For example, in 1933 there were some 105 plants, which reported some radio set manufacturing (excluding plants categorised primarily in other sectors, or those for which product-level data are not available). Radio sets accounted for 90 percent or more of final output for only 49.5 percent of these plants. Some 11.4 percent had between 75 and 90 percent of final output in receivers and a further 13.3 percent had between 50 and 75 percent of marketed output in this class. However, some 25.7 percent of plants had less than one-half their output in this class and 17.1 percent had less than one-quarter. The exceptions to this diversified plant-level output pattern were tube plants, most of which were highly specialised. The automobile series suffers from a similar problem in testing for returns to scale—the Census classification lumped together producers of commercial and passenger vehicles—though its heteregoneity was not nearly as great as for radio equipment.
Even putting aside the problems related to multi-product plants, other difficulties remain in attempting to identify scale effects. One key issue is the long-recognised association between mass production and low unit prices—W.E.G. Salter's (Reference Salter1960, pp. 151–52) “index-number problem.” If an industry is segmented between a mass production section and a batch production section serving niche or high-end markets, value-added per worker comparisons will be biased in favor of the non-mass production section, as this typically has much higher unit prices. This point has been made anew by Holmes and Stevens (Reference Holmes and Stevens2013), in attempting to understand the distribution of “productivity” within an industry. It is particularly problematic for the interwar Census data, where there is no information on physical output for plants over different size ranges.
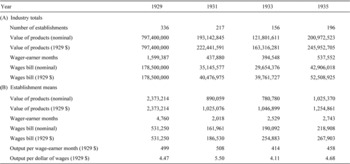
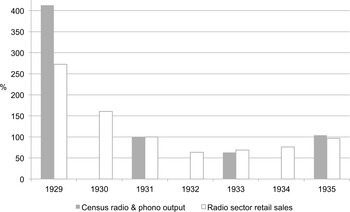
We provide summary statistics on this industry over these four years in Table 1. The trends shown can be checked using industry estimates of radio equipment retail sales. These industry records are recorded at retail rather than factory values, and exclude phonograph industry output. So the comparison is not perfect, though they provide a reasonable benchmark. As Figure 1 shows, the 1929 data in Table 1 appear to over-estimate the size of the radio and phonograph sector, presumably owing to the inclusion of some plants that would have been assigned to other sectors. However, retail sales data also show a sharp decline in output, the nominal value of sales falling to only 25.2 percent of its 1929 value by 1933. This substantially exceeds the decline in the nominal value of all manufacturing output over 1929–1933 (to 44.9 percent of its 1929 value) and is also greater than the fall in motor vehicle industry output over this period (to 29.6 percent of 1929 nominal output) (Bresnahan and Raff Reference Raff1991, pp. 317–22).
RADIO AND PHONOGRAPH INDUSTRY STATISTICS FOR CENSUS YEARS

Sources:
1931–1935, U.S. Department of Commerce, Bureau of the Census (Reference Raff1938), p. 1009. 1929—establishment level returns for the “Electrical machinery and apparatus” Census category, with product descriptions matching those subsequently categorised as “Radio and phonograph industry.”
COMPARISON OF THE VALUE OF RADIO AND PHONOGRAPH OUTPUT RECORDED IN Table 1 AND INDUSTRY ESTIMATES OF RETAIL SALES OF RADIO EQUIPMENT, 1929–1935 (NOMINAL VALUES, 1931=100)

PRODUCTIVITY IN THE RADIO AND AUTO INDUSTRIES COMPARED
As Table 1 shows, labour productivity, as proxied by real output per wage-earner month, fell sharply from 1929 through 1933, as did real output per dollar of wages. This decline in labour productivity was common to many industries and the economy as a whole (Ohanian Reference Ohanian2001). To what extent this aggregate fact was due to “Keynesian” reasons such as labour or capital hoarding, or some other reasons, is a matter of debate (Field Reference Field2010; Ziebarth Reference Ziebarth2013).
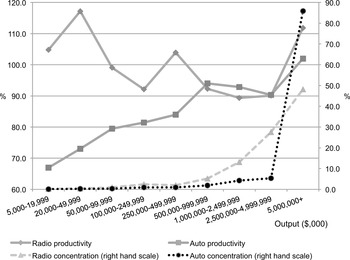
For the radio industry, the answer to declining productivity does not appear to be a story of scale economies. A comparison of published Census data for the two industries provides prima facie evidence that the radio industry has limited scale economies, particularly relative to automobiles. The Sixteenth Census of the United States includes an analysis of productivity by size of plant in the radio and phonograph sector and in the motor vehicles, parts, and accessories sector for 1939 (the earliest year for which such data are available). As Figure 2 shows, the contrasts between the two industries are striking. Scale economies are strongly evident for autos, though no clear positive relationship between plant size and value added per worker is evident for radios and phonographs. Complementary evidence comes from the distribution of output across size groups. If there were strong scale economies, one would expect most production to take place in the largest plants. Instead relative to autos, where firms in the highest tabulated annual output class, with a threshold of $5 million, accounted for 85.9 percent of value-added in the sector, only 48.1 percent of aggregate value added in the radio and phonograph sector was produced by plants above this threshold (unfortunately such comparisons cannot be normalised for the size of each industry, given the nature of the published data).
PRODUCTIVITY BY SIZE OF PLANT (VALUE ADDED PER WAGE EARNER, AS A PROPORTION OF THE AVERAGE FOR EACH SECTOR) AND INDUSTRIAL CONCENTRATION (PROPORTION OF TOTAL VALUE ADDED) FOR RADIO, RADIO TUBE, AND PHONOGRAPH, AND FOR MOTOR VEHICLES, PARTS, AND ACCESSORIES, PLANTS IN 1939

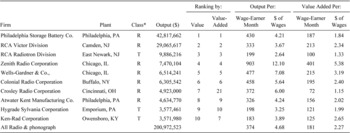
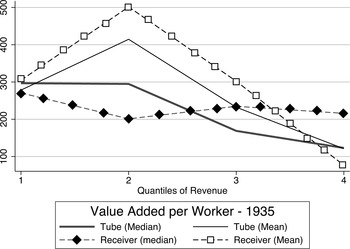
We focus on the ten largest plants in the sector, by output, together with figures for all radio and phonograph plants, from the Census, in Table 2. Even here we find no evidence for scale economies. Several of the largest plants have outputs per wage-earner month, and/or per dollar of wages bill, below the industry mean. This includes some of the very largest plants—such as Radio Corporation of America's (RCA) receiver and tube plants. Several of these largest plants also fall below the means for value-added per wage-earner month, or per dollar of wages. The lack of clear scale economies is also evident in the industry overall, not just in the largest plants. Figure 3 shows mean and median values of value added per worker for receiver and tube plants in 1935 by quartiles of revenue. There is no discernible upward trend.
A COMPARISON OF LABOUR PRODUCTIVITY IN THE LARGEST TEN PLANTS, TOGETHER WITH AGGREGATE RADIO AND GRAMOPHONE SECTOR PLANT PRODUCTIVITY, FOR 1935

Notes:
∗ R = Radio receiver manufacturer, T = Tube manufacturer (based on at least 50 percent of revenue being in that class).
Source:
All Radio & phonograph, as for Table 1. Individual plants, 1935 Census returns.
VALUE ADDED PER WORKER IN 1935 (DOLLARS) FOR RECEIVER AND TUBE PLANTS BY QUARTILES OF REVENUE — MEAN AND MEDIAN VALUES

Moreover, considerable productivity differences are evident between firms of similar size. For example, value-added per worker for the radio receiver plants in Table 2 varies between $401 for Zenith (a strong positive outlier for any of the labour productivity measures) and only $72 for Crosley Radio Corp. Given this dispersion in productivity and the lack of a clear positive relationship with size, one potential explanation is price dispersion. To reiterate, productivity is here measured in terms of revenue or value added rather than physical output. So if mass production was reflected in low unit prices, then productivity measured by value as opposed to output would appear low. Such a pattern was evident in automobiles, where firms outside the “Big 3” producers typically focused on niche or luxury markets, where customers would pay a premium for scarcity, variegation, and craft production.
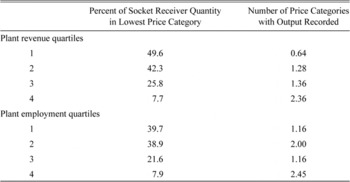
Unlike the automobile industry, the radio sector displayed the opposite pattern, with the smaller plants focusing on the lower-priced markets. This is illustrated in Table 3, which shows the proportion of all 1933 socket-powered home receiver unit output in the lowest price category (under $11 at factory values) for plants grouped by revenue and employment quartiles. Firms in the lowest revenue quartile are shown to have been more concentrated in the $11.00 or under value range than other receiver plants and to be active in a smaller number of price categories. Conversely, RCA (which vied for overall receiver market leadership with Philco during the 1930s) was strongly focused on the high-end market, taking 42.0 percent of 1935 industry unit sales in the more than $175 retail price bracket and 30.6 percent in the $126–175 bracket, but only 16.2 percent in the $71–125, 7.3 percent in the $31–70, and 4.14 percent in the $30 and under price ranges.Footnote 1
ANALYSIS OF SOCKET-POWERED HOME RADIO SET PRODUCTION BY RECEIVER PLANTS IN 1933

Notes:
For this year, the Census used four price categories for socket-powered sets, with f.o.b. factory prices of: $11.00 or less, $11.01–$30.00, $30.01–$65.00, and more than $65.00.
Source:
1933 Census returns for radio receiver plants.
QUALITATIVE EVIDENCE ON PRODUCTION SYSTEMS IN THE RADIO SECTOR
We now provide some complementary qualitative evidence regarding why radio manufacture displayed no significant technical economies of scale. To start, the nature of the production process provided much weaker incentives for the type of mass production used in motor vehicles. Auto assembly involved a choice between employing skilled manual labour or substituting such labour with dedicated machine tools, which incurred extremely high fixed costs and thus required very long production runs (Raff Reference Raff1991). By contrast, most processes in radio set production, such as mounting components on to boards/chassis, or soldering wire connections between them, were suitable for unskilled and semi-skilled labour. Thus while radio firms often embraced those elements of mass production associated with work-pacing—the moving assembly line and the linear organisation of production across the factory floor—most processes were done using either manual assembly or simple, general purpose, tools.Footnote 2 In the parlance of directed technical change theory, labour was more substitutable with capital in autos relative to radios, with important consequences for differences in the sources of innovation between the two industries.
This was illustrated by a 1926 house journal article for one of the largest radio manufacturers, Crosley, outlining the tasks of each of the 36 women and six men involved in assembling a radio. Work was carefully sub-divided by task, though most functions involved either hand assembly or simple generic tools (such as soldering) rather than single-purpose machine tools. Such pre-Fordist conveyor assembly systems were viable for even relatively small radio establishments (Crosley Broadcaster 1926, p. 9; Raff Reference Raff1991, pp. 725–31). The fact that radio cabinets were typically made of wood, using the techniques of the furniture industry (a sector characterised by labour-intensive methods) further limited the potential for scale economies. However, by the late 1920s two of the four largest radio manufacturers, Atwater Kent and Crosley, had switched to metal cabinets, while the 1930s saw the rapid diffusion of Bakelite cabinets, especially for midget radios (Douglas 1Reference Douglas989a, pp. 69–70, 114).
We argue that the lack of scale effects was not due simply to technical limitations; there were other “demand” driven factors. In particular, the crucial difference between the auto and radio industry was the stochastic and non-stochastic variability in demand. Weak scale economies are to be expected, given the annual cycle of new product launches, the unpredictable demand for new models at the start of the cycle, and the highly seasonal demand for existing models over the cycle. Fordism was generally associated with steady operation and planned capacity, providing a 100 percent load factor on expensive machine tools, while highly variable output shifted comparative advantage towards more labour-intensive, scale-flexible, production techniques, reducing both the optimal scale of plant output and the cost penalties associated with operating below that optimum (Bain Reference Bain1956, p. 63).
Entertainment radio was unique among major early twentieth century consumer durables in that it reached a mass market within a few years of its launch. Yet, despite huge aggregate sales, high seasonality made production stabilisation extremely difficult. While the Census did not publish employment totals by month for manufacturing as a whole, we can construct these totals for the “Machinery, not including transportation equipment” group including radios. In 1931, for all other industries in this group besides radio manufactures, the difference between the largest and smallest monthly total employment counts is about .17 log points, while for radio manufactures, this difference is .43 log points. As a result, the receiver industry focused on production systems that were flexible with regard to the scale of output, a strategy that negated many of the cost savings of mass production (Eoyang Reference Eoyang1936, pp. 93–94). Even in the late 1930s, most firms were said to be still producing only for orders; hiring large numbers of workers during seasonal peaks and laying them off during the slack season (Palmer and Stoflet Reference Palmer and Stoflet1938, pp. 4–5).
The comparison with automobile manufacturers is again informative. Auto production was also characterised by strong seasonal demand fluctuations. Almost 50 percent of annual sales during the 1920s occurred during the months of March–June. A strategy of building up massive inventories in winter was underpinned by requiring dealers to carry the inventory, their costs in turn being covered by finance companies, that provided dealers with inventory loans and purchased their retail installment sales contracts (Olney Reference Olney1991, pp. 119–30). Auto manufacturers took advantage of a relatively predictable pattern of seasonal demand to institute an annual shut-down for retooling, while in 1935, under the National Industrial Recovery Act, they collaborated to move new model introductions and automobile shows to the Autumn, to smooth seasonal demand variations outside the shutdown period (Cooper and Haltiwanger Reference Cooper and Haltiwanger1993).
However, this strategy proved impracticable in the radio sector due to a different source of demand variability. In addition to a predictable seasonal pattern of demand (also evident in autos), radio suffered from less incremental annual model changes, together with rapid and unpredictable technological obsolescence (and technical problems associated with the introduction of new product technologies). Both sources of variation could play havoc with production runs in an era when most radio companies planned production six months or more in advance (Douglas 1Reference Douglas989a, p. 194).
For example, despite being able to draw on the technical expertise of General Electric and Westinghouse, RCA ran into continual technical problems and product launch delays during the 1920s; subsequent problems of factory quality control and engineering design; and consequent build-ups of obsolescent stock (Douglas 1991, pp. 29–43). Many other companies faced similar problems, resulting in production hold-ups, sales of defective sets, or even corporate failures (Douglas 1989b, pp. 23, 36). Such uncertainties collectively prevented dealers from carrying substantial stocks over the slack season. It was simply too risky for finance companies to help smooth production over the year. As Manning (1931, p. 32) noted, overnight, “a warehouse supply of stored radios [could be converted] into stock out of date and worthless in the eyes of the buying public, that will be satisfied with nothing but the latest model.”
In addition, the nature of patenting in this industry eliminated any product technology based intellectual property advantages across plants. Patents were packaged into a single unit managed by RCA, which also provided a license bureau to assist with technical performance. This created an even playing field in new product technologies; with the exception of some initial advantage for RCA regarding innovations it could incorporate into the new season's models before its licensees (Sobel Reference Sobel1986, pp. 84–108; Maclaurin Reference Maclaurin1949, pp. 132–36). In the process, it eliminated differential incentives to engage in research and development (R&D).
Even in the radio tube sector, where firms produced to common design specifications and demand was more predictable (partly due to short tube lifespans, which generated a steady stream of replacement demand), the cost advantages of highly-mechanised systems were not clear-cut. Such technologies left manufacturers extremely vulnerable to sudden downturns in demand.Footnote 3 De Forest, which had invested heavily in highly-mechanised tube plants for mass, standardised, production, for example, was forced to abandon this strategy during the Depression, as there was insufficient demand for its narrow product range.Footnote 4 In 1929 their two factories had annual outputs of $6.18 and $2.33 million, with production per wage-earner month of $757 and $589, respectively. However, the 1931 Census records only the smaller of two factories remaining in operation, with output slashed to $792,779 and an output per wage-earner month of only $229. Thus, as in receivers, smaller firms continued to compete with larger ones, even in the manufacture of the same standard tubes.
Industry observers noted the ability of smaller firms, and plants, to out-compete the largest players on price. During the early years of entertainment radio, or example, some small firms, which had obtained “amateur set” licenses from Edwin Armstrong before he sold his patents to Westinghouse were able to undercut RCA's prices for receivers with similar characteristics (Maclaurin Reference Maclaurin1949, pp. 107–18). In the tube market, RCA's main rival, Sylvania, flourished during the 1930s (despite royalty payments to RCA) through a policy of operating smaller plants in small towns—to reap lower labour costs and scale flexibility (Chandler Reference Chandler2001, p. 24; Maclaurin Reference Maclaurin1949, pp. 149–50). The literature also notes a tendency for the rapidly growing firms of the late 1920s and early 1930s to have greater external sourcing of components than established major players such as RCA. External sourcing may have enabled newer firms to reduce risks associated with highly variable demand, via “just-in-time” purchasing strategies (for the use of such strategies in autos, see Langlois and Robertson Reference Langlois and Robertson1989, p. 370).
DETERMINANTS OF PLANT SURVIVAL
We now turn to a study of exit rates during the Depression. Table 1 indicates that some 54 percent of radio and phonograph plants closed over 1929–1933, a much higher figure than the one-third of all U.S. manufacturing establishments that closed over this period, and on a par with the one-half of motor vehicle industry plants that exited (Bresnahan and Raff Reference Bresnahan and Raff1991, pp. 317–18). In radios (unlike autos) plant survival is a close proxy for corporate survival, as most firms operated from one, or few, establishments. Of the 133 firms for which we have plant-level returns in 1935, 126 operated from a single plant (at least for output within the sector); five (RCA, Crosley, Automatic Radio Manufacturing Co., General Household Utilities Co., and Pacific Radio Co.) operated from two plants; and two (Hygrade Sylvania and Western Electric) operated from three. Moreover, both firm and plant mortality estimates corroborate the unusually precarious nature of the radio industry, during both the Depression and in the 1920s (Maclaurin Reference Maclaurin1949, p. 134; Langley Reference Langley1936, p. 378).
These high rates of exit seem unlikely to be due to random chance, even though we did not find evidence for scale effects. There is a long-established literature studying the determinants of competitive advantage and barriers to entry, stretching back to Joe S. Bain's seminal 1956 work. He argued that product differentiation advantages as opposed to physical productivity differences acted as a major entry barrier in some consumergoods industries and also determined exit from these industries. Such advantages reflected cumulative investments in building up brand recognition, reputation, and goodwill among both dealers and final customers.
For radio manufactures, the key lay in exploiting complementarities between control over distribution networks, differentiation through design, and advertising expenditure. Firms can accentuate product differentiation in a number of ways: (1) introducing variations in design and quality of their products; (2) through branding; (3) auxiliary services to customers; and (4) advertising and sales promotion. Such actions enable producers to set prices above those for firms lacking well-developed product differentiation advantages—and thus provide some protection against new entrants with lower unit costs. Bain (Reference Bain1956, pp. 114–125) emphasized these, rather than productivity-based, factors, reflecting his finding that scale economies were relatively unimportant in nine of the 20 U.S. manufacturing sectors he investigated.
There is substantial contemporary evidence that radio firms used brands, and control over distribution networks through contractual arrangements, as key competitive weapons. Manufacturers distributed sets mainly through wholesalers; as late as 1939 some 71.3 percent of the radio equipment industry's domestic sales (excluding those to final business users or exporters) passed through wholesalers and only 19.1 percent were directly supplied to retailers. A further 8.9 percent were supplied via manufacturer-owned wholesalers or retailers and 0.7 percent directly to final domestic users (U.S. Department of Commerce 1942, p. 166). Nevertheless, major manufacturers made great efforts to develop strong relationships with retailers, partly in co-operation with local wholesalers. Carefully selected authorised retailers were offered a variety of incentives to promote the firm's products, including co-operative and coordinated advertising (Scott and Walker forthcoming). Meanwhile, given the “experience good” nature of radios, strong brands acted as an important signal of quality and a means of product differentiation, thereby reducing the relative importance of price competition (Nelson Reference Nelson1970). This is in line with the theoretical literature, such as Avner Shaked and John Sutton (Reference Shaked and Sutton1982), that emphasizes the role of vertical differentiation—quality—in softening price competition.
Differentiation was further accentuated through a horizontal component—substantial advertising and promotional expenditures. Information on advertising expenditures for the radio industry is scarce for this period, though a 1931 survey estimated manufacturers' advertising for radio equipment and supplies at 5.3 percent of net sales (cited in Borden 1942, p. 67). Scattered data suggest that the strongest brands invested more intensively. RCA's advertising expenditure averaged 8.0 percent of sales over 1923–1929, while Atwater Kent (the largest set manufacturer over 1926–1929), was famous for its lavish advertising, including sponsoring America's most popular radio programme, “the Atwater Kent Hour.”Footnote 5 This alone cost $7,000 per week, for the 1926–1927 season, while they were also spending $3–4 million annually on print advertising (Douglas 1Reference Douglas989a, p. 67).
In addition, the external appearance of radios steadily increased in importance, as differences in performance between brands diminished. Firms began to employ artists and industrial designers to develop radio cabinets, which were both attractive and distinctive. As leading industrial designer Ruth Gerth (Reference Gerth1937, p. 27) noted, this served to emphasise branding and differentiation, “with so many factors being equal in manufacturing, competition is levelled … [Given] products of similar character, performance, and price … the main basis of differentiation is in the appearance.” This added to the horizontal differentiation of products between firms and was crucial, given the identical technology employed by all.
Most large own-brand firms went further by not just differentiating their single product through design modifications but by offering a whole array of differentiated products. Radio Retailing's annual analysis of new model specifications for each firm that marketed radios under its own brand shows that, of the largest firms identified in Table 2 for 1935, Philco were marketing no fewer than 47 models of radio and radio-phonograph combinations; RCA-Victor were offering 29, and Zenith 23, compared to an average of 14 for the 61 firms listed (Radio Retailing 1935, pp. 29–46). According to consulting engineer Ralph H. Langley (Reference Langley1935, p. 433; Reference Langley1936, p. 378), during 1935 some 1,126 radio models were on offer in the United States, produced by around 100 separate manufacturers. However, the ten largest firms accounted for around three-quarters of aggregate turnover. This is in line with the product diversification literature, which finds product line diversification to be closely bound up with capitalising on established brand strength and economies of scale and scope in marketing and brand development (Reddy, Holak, and Bhat Reference Reddy, Holak and Bhat1994; Nijssen Reference Nijssen1999). The positive relationship between output and product diversification is corroborated by the 1933 plant-level data in Table 3. We find that the average number of output categories for socket-powered radios per plant increases by quartile of plant revenue.
Unfortunately, we only observe this variable for 1933 so we cannot examine its effects on exit. However, Alan Douglas's three volume history of 1920s radio manufacturers (covering around 70 of the largest firms) indicates that firms narrowly concentrated in high value console sets were particularly prone to failure during the depression (Douglas 1989b, pp. 27, 51, 68; 1991, pp. 83, 135). Even the leading manufacturer Grigsby-Grunow, which had adopted a “mass production” strategy (based on producing only two models, at prices below direct competitors, but in a high price-bracket), was brought down by a collapse in demand for this market segment (Douglas 1989b, pp. 143–51).
Brand ownership was contested between manufacturers and major retailers, reflecting a tension highlighted in the value-chain literature between “producer-driven” and “buyer-driven” value chains (Kaplinsky and Morris Reference Kaplinsky and Morris2002, p. 33). Large general or auto retailers, such as Montgomery Ward, Sears Roebuck, Firestone, Western Auto, Gamble's, and Goodyear, acted as “manufacturers without factories,” selling under their own brands, but sub-contracting all production to independent contractors (Maclaurin Reference Maclaurin1949, pp. 148–49; Gereffi Reference Gereffi1999, pp. 1–2). Retailers with own brand radios developed a reputation for switching between suppliers on the basis of short-term cost considerations—or temporarily focusing sales on stocks of proprietary branded sets acquired at distress prices (Douglas 1Reference Douglas989a, p. 205; 1989b, pp. 2, 100). They had no downstream supply chain investments to protect, while upstream suppliers were plentiful and their brand position in radios rested primarily on their retail brand reputation.
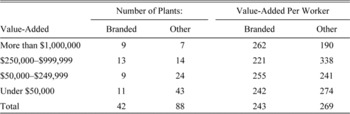
Brands and dealer networks have been recognised as important factors promoting sales in products that are highly differentiated in the eyes of the consumer (Lee Reference Lee2014, p. 7). “Brand loyalty” provided a significant measure of protection against price competition. Moreover, manufacturers with proprietary brands faced much higher exit costs. These included the sunk costs of high cumulative investments in both direct advertising and in support activities for downstream distributors. Good local retailers had distinctive capabilities (including prime shopping pitches and strong sales teams) and—in a market with only medium firm concentration— could switch to rival brands without great difficulty (Gereffi, Humphrey, and Sturgeon Reference Gereffi, Humphrey and Sturgeon2005). While such manufacturers often halted production temporarily when faced with excessive inventories, any disruption in their ability to supply retailers would risk the loss of these investments. Thus their likelihood of exit was reduced, relative to firms that acted as contractors for retailers, both by control over their own brand assets and the need for continuity of supply to protect unrecoverable investments in branding, advertising, and distribution networks. As Table 4 shows, significant numbers of both own-branded set manufacturers and others are active at all output levels and there are no systematic differences in productivity (as proxied by value added per worker) between the two categories of plant.
VALUE ADDED PER WORKER FOR PLANTS PRODUCING OWN-BRAND RADIOS, AND OTHER RADIO SECTOR PLANTS, IN 1935

Notes:
Excludes a few plants with missing or unreliable data (e.g., where the total value of output is lower than that of an individual product class).
Source:
Dataset.
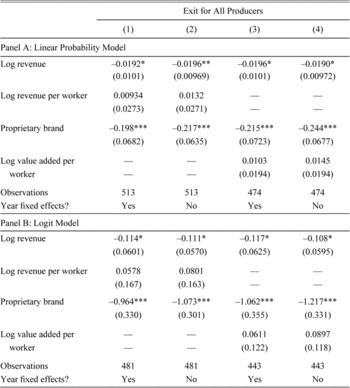
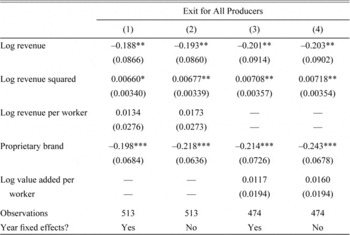
Our plant-level data enable us to test the relative importance of branding and economies of scale for exit rates. More concretely, for each Census, we start from the whole population of plants and then search for each of those plants in the subsequent Census, classifying those that cannot be found as an exit. We use the predetermined values of productivity and size from the initial Census year to predict exit between the initial Census year and the next Census two years hence. We then estimate a linear probability model (in Table 5, panel A) and a logit model (in Table 5, panel B) for exit. (Results are basically unaffected if we use a probit model.) We call this a “pooled cross-sectional” design since, even though it relies on linking across years to define exit, we do not include establishment fixed effects. Following the approach of Peter Scott and James Walker (Reference Field2010, p. 1120), year effects are used to account for both changes in market demand and in prices (given that we have no annual sector-specific deflators for this period). We also test for the presence of non-linear effects in size via the inclusion of the log revenue squared, in Table 6. We choose this specification rather than a binary indicator for “large” plants due to the vagaries in defining what size is large enough to achieve scale economies.
DETERMINANTS OF RADIO PLANT EXIT

Notes:
Determinants of radio plant exits. Dependent variable is whether a plant exits between two adjacent censuses (1929–1931, 1931–1933, 1933–1935). Independent variables are lagged values (1929, 1931, 1933). Value added is total revenue net of cost of materials and electricity. All producers (tube, receiver, and others) have been pooled. Whether a particular plant has a proprietary brand is drawn from trade publications.
Source:
Dataset.
DETERMINANTS OF RADIO PLANT EXIT: LINEAR PROBABILITY MODEL, INCORPORATING NONLINEAR EFFECTS OF PLANT SIZE

Standard errors in parentheses.
∗ p < 0.10, ∗∗ p < 0.05, ∗∗∗ p < 0.01.
Notes:
As for Table 5.
Source:
Dataset.
While our specification is consistent with the spirit of Bresnahan and Raff's exercise that examines the characteristics of exiting plants Census by Census, it is not the only sensible choice. For example, Lee (Reference Lee2014) uses 1929 values to predict exit in any subsequent Census, a true cross-sectional regression. Our specification has the feature that because we do not include plant fixed effects, we implicitly impose that a plant that has survived from say 1929 to 1931 has the same probability of exit from 1931 to 1933 as some other plant that has just entered in 1931 (conditional on other observables). Although this has drawbacks, the “pooled cross-sectional” approach allows us to exploit the full sample of plants, not just those present in 1929. The results are qualitatively unaffected if we restrict attention to only plants in 1929.
In all three models we include the value of output and two measures of labour productivity—revenue, and value-added, per worker. The contemporary literature suggests that value added per worker may be a more accurate productivity measure, as firms varied considerably in the extent to which they produced their own components or sourced them externally (Eoyang Reference Eoyang1936, pp. 117–18). We decided against including a quantity-based measure of productivity, as used in Foster, Haltiwanger, and Syverson (Reference Foster, Haltiwanger and Syverson2008), as these authors found that the most important measure of productivity determining selection is the revenue based one that incorporates price differences. It did not matter much for them if they used revenue or value added and it does not much matter for us. Furthermore, they focused on a set of industries with very homogeneous products, such as cement or cardboard boxes, where comparisons of physical productivity are much more valid than for sectors such as radios, characterised by a broad mix of products and a high degree of product differentiation.
We also include a “proprietary brand” variable, based on annual lists of radio receivers and radio-phonographs published in Radio Retailing at the start of each new model season (Radio Retailing 1929, pp. 64–71 (excluding reproducers); 1931, pp. 53–61 (excluding television scanners and tuners); 1933, pp. 19–28; 1935, pp. 29–46). This is a binary variable due to data limitations. It would have been useful to include a continuous measure of the relative importance of a proprietary brand, such as the fraction of total revenue from proprietary brands. However, own-brand and contract production is not separated in the Census returns, or other known data sources.
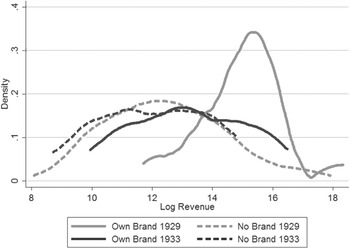
The proprietary variable does not cover tube brands, as tube manufacturers could be expected to have much weaker brand effects. Radio Retailing produced annual lists of tube characteristics, rather than brands, owing to tube design being highly standardised (following the precedent of light bulbs), the most popular standard tubes being produced by most of the manufacturers. Moreover, a large proportion of output (45.0 percent for tubes produced over 1929–1934) was sold to set manufacturers for installation in new sets—a market where cosmetic branding of functionally identical products would be less likely to sway demand than factors such as price and quality control (Eoyang Reference Eoyang1936, p. 79). Note also that producing radios as a contractor, rather than for sale under the firm's brand, was not simply a proxy for plant size, as shown in Figure 4 and Table 4; indeed even the largest radio manufacturers of the 1930s, RCA and Philco, also undertook significant production for retail brands.Footnote 6 Furthermore, unlike Luís M.B. Cabral and José Mata (2003), the distributions show no right skew. Interestingly, the relationship between size and owning a brand is less pronounced in 1933 than in 1929. This will not be surprising after we discuss the results regarding who is being selected to exit.
SIZE DISTRIBUTION OF FIRMS WITH, AND WITHOUT, PROPRIETARY RECEIVER BRANDS IN 1929 AND 1933

Our results strongly support the contemporary evidence that branding was a key determinant of plant survival. “Proprietary brand”Footnote 7 is highly significant, at the 1 percent level for all specifications. It is also economically quite important. If we focus on the estimates from the linear probability model in Panel A, recall that the average exit rate is around 50 percent, so this effect is 20 percentage points off that mean. This is not driven by the correlation (only 0.30) between size (as measured by revenue) and whether a particular plant owns a proprietary brand. Even for plants with their own brands, exit rates are high, but no higher than was typical for businesses in the Depression. The year fixed effects track the shape of the Depression, with particularly high average exit rates between 1929 and 1931 (partly due to issues of how the Census classified radio producers). The logit model in Panel B of Table 5 shows little change from the linear probability model. Meanwhile Table 6 suggests that non-linear effects are also evident, with a moderating of the effects of size for larger plants. The total effect of size is always negative, given our sample of plant sizes, even though the positive effect of the quadratic effect implies that eventually increases in size increase the probability of exit.
What is striking is that productivity per worker, measured in either revenue or value-added terms, has basically no impact on exit rates. This contrasts with Bresnahan and Raff's (Reference Raff1991) analysis of the automobile sector where productivity, which was closely related to size—as reflected in mass production technologies—was crucial for survival. Size of plant, as measured by revenue, nevertheless appears to play some role in survival. However, relative to owning a national brand, the economic significance of revenue is rather limited. Even a whole log point increase in revenue decreases the exit rate by a little less than 2 percentage points off the very large mean exit rate. These results echo the re-analysis of the automobile industry for this period by Lee (Reference Lee2014). He too finds that absolute size is a strong predictor or survival with productivity measures not having much power. He suggests that size is proxying for access to credit, and this is why the smallest plants exit. Without more direct evidence on the availability of credit, it is hard to evaluate this hypothesis for the radio industry.
Here the literature also recognises that large incumbent manufacturers typically derive substantial advantages from non-technical scale economies—not only in marketing and distribution, but in areas such as finance and the employment of specialist managerial and other staff (Bain Reference Bain1956, p. 57). We hypothesize that finance was particularly important during this time of unprecedented distress in the banking sector. Given that even the strongest firms, such as Zenith, RCA, and Crosley, faced losses over the early 1930s, access to financial support clearly played a significant role in survival (Maclaurin 1949, pp. 144–52; Douglas 1Reference Douglas989a, p. 114).
Finally, while branding was significant in lowering the probability of exit, it did not provide overwhelming protection from the Depression. This was evident during the early 1930s, when a new, cheaper and much more compact, radio format—the “midget”—was introduced, generally by firms who were not established players in the industry (Eoyang Reference Eoyang1936, p. 88). By cutting the retail price to around one-half that of a conventional radio and offering a product with the new characteristic of portability, new entrants (or previously insignificant players) in the sector were able to create a substantial, and growing, market segment, which eventually came to dominate receiver unit sales by the end of the decade (Ramirez Reference Ramirez1993, pp. 21–22; Emerson Radio and Phonograph Co. 1943, pp. 28–30). Unfortunately, we cannot examine the evolution of the industry during this later period, given that our sample stops in 1935.
We should be careful to note that these findings are not inconsistent with a suitably reinterpreted version of Bresnahan and Raff's explanation. They emphasised that automobile manufacturers who invested in mass production technologies “needed” to continue producing to protect their sunk costs. On the other hand, small producers could more easily recover fixed costs through exit. Costs of promoting and supporting proprietary brands were similarly “sunk” in the radio industry, thus raising the costs of exit compared to firms that had not made such dedicated investments. The broader point is that survival strategies for businesses may be varied in less than perfect competitively industries. Investments are made to raise profitability, not productivity.
GENERALISABILITY TO OTHER “NEW ECONOMY” SECTORS
How typical was radio of the era's “new economy” industries? While a full analysis must await detailed research on a number of other industries, available evidence for three classic new labour-saving durables— vacuum cleaners, washing machines, and refrigerators—shows a mixed picture. Branding appears to be a key factor in success for vacuums and washing machines, while refrigerators conform more to the autos model of both strong technical and marketing economies.
Like radio the vacuum cleaner's early development was influenced by a fundamental patent, the “narrow nozzle” principle (creating a vacuum by sucking air through a narrow section of a broader tube). Manufacturers formed the Vacuum Cleaner Manufacturers Association (VCMA) to negotiate with the patent holder—achieving a license agreement, which restricted access to the patent (and, therefore, operation in the sector) to the original licensees. Strong patent barriers to entry and the leading role of the VCMA also fostered a competitive structure based around marketing, high, relatively stable, prices, and substantial cooperation between member firms. A U.S. Federal Trade Commission report (1925, p. 305) found that the sector was characterised by high profits, remarkable price stability, and heavy promotional expenditures. Furthermore, the intensity of promotional spend was strongly related to firm size. In 1921 the three largest firms, with average net sales of $3.6 million, had an average ratio of selling expense to total costs of 29.4 percent, compared to 16.2 percent for four medium-sized firms, and only 6.6 percent for the three smallest manufacturers.
Following the expiration of the key patent in 1924 competition in the sector continued to be based on quality, brands, and promotion. Despite charging the highest prices of any manufacturer, Hoover retained market leadership through product innovation and intensive promotion—including a formidable direct sales organisation (Gantz Reference Gantz2012, p. 98). Leading manufacturers continued to market vacuums mainly via door-to-door sales throughout the interwar years, a costly form of distribution reflected in rising real unit prices. Between 1921 and 1927 (when general retail prices fell by about 3 percent) the average factory gate price of a vacuum had risen from $26.7 to $32.1 (U.S. Department of Commerce 1930, p. 1061). Retail prices of floor vacuum cleaners then rose 18 percent in nominal terms between 1929 and 1938, equivalent to a real price rise of 44.6 percent.Footnote 8
Washing machine manufacturers appear to have had broad similarities with vacuum cleaner producers in terms of a strong correlation between firm size and the ratio of selling to total expenses. The U.S. Federal Trade Commission (1925, p. 312) found that in 1921 the five largest firms of the 35 they surveyed (with average net sales of $11.5 million) had an average ratio of selling to total costs of 17.8 percent, compared to 13.1 percent for firms averaging $4.2 million sales; 9.9 percent for those averaging $2.5 million; and 8.7 percent for the smallest, averaging $930,000. The industry remained relatively fragmented throughout the interwar period; in 1939 only 49.0 percent of industry value added was accounted for by firms with an output of over $5 million, broadly similar to the figure for radio (48.1 percent) and well behind those for autos (85.9 percent) or refrigerators and air-conditioning units (68.5 percent) (U.S. Department of Commerce 1942, pp. 211–15).
Conversely, refrigerators had strong similarities to the auto sector. The industry was both research-intensive and suitable for mass production using dedicated machine tools—given the precision engineering required to produce a refrigerator which would run silently, reliably, and without significant risk of leaking potentially fatal gases, or oil. These requirements imposed formidable entry barriers and placed a premium on competence in mass production; the sector's two leading firms, Frigidaire and Kelvinator, were both developed by entrepreneurs with backgrounds in the auto industry (Rees Reference Rees2013, pp. 143–52; Anderson Reference Anderson1953, pp. 195–97). Heavy capital resources were also required to aggressively promote this new product. Rapid diffusion was accompanied by dramatic falls in retail prices; mass production reduced the cost of an average refrigerator from around $600 in 1920 to $275 in 1930 and $154 in 1940 (Anderson Reference Anderson1953, pp. 213–14). Smaller companies increasingly struggled to both match the price of the industry leaders and compete with their promotional budgets; by 1937 the four largest household refrigerator companies controlled some 70 percent of this market (Rees Reference Rees2013, pp. 148–49).
CONCLUSION
As the paradigmatic mass production consumer durable of the early twentieth century, the automobile has dominated historical analyses of the dynamics of firm growth, survival, and barriers to entry in new consumer goods industries. By no means downplaying the significance of the automobile in the history of American manufacturing, it was not typical of rapidly-growing consumer durables. Bain (Reference Bain1956, p. 81) found automobiles to be at one extreme of 20 manufacturing industries he studied, being characterised by both very strong technical and non-technical scale economies. This translated into strong selection by size of plant during the Great Depression, as shown by Bresnahan and Raff (Reference Raff1991).
We find radios to have much weaker scale economies, owing to the nature of the production process. Whereas car manufacture involved formidable technical challenges—the production and fitting of very large numbers of components, at tolerances sufficient to prevent poor mechanical performance, or leakage of oil, water, or petrol—in radios simple assembly processes could be efficiently conducted over a broad range of output levels and competitive advantage was therefore dominated by nontechnical scale economies. Preliminary analysis of the vacuum cleaner and washing machine sectors suggests that competitive advantage was also largely gained through marketing, rather than technical, economies. Conversely, refrigerator manufacture shared the auto industry's complex technical problems and reliance on mass production to bring prices down to levels that would sustain mass markets. Final assessment of the overall importance of technical and marketing scale economies to the “new economy” industries of the 1920s will have to await the digitisation of the Census returns for these sectors.
Where does that leave us then with the question that started this work regarding the cleansing effect of recessions? Clearly, selection is occurring and, as in autos, appears to be based primarily on different shutdown thresholds operating for firms with heavy sunk costs and those where fixed costs are more easily recoverable (Bresnahan and Raff 1998). However, while in the automobile industry high sunk costs were synonymous with mass production systems using dedicated machine tools; in radios they mainly represented cumulative investments in branding, advertising, and downstream distribution networks. To use a distinction from evolution, selection may not always be on “fitness” as reflected in whether or not an animal can run away from its predator or, for industries, whether or not a plant can out-produce its competitors. Rather selection may be “sexual.” Just as a peacock's feathers serve no other purpose but to attract a mate and, hence, “outcompete” the other peacocks, the plants that survive during recessions may simply be the ones that can attract “mates.” Call them customers.