I
The ‘Gibson Paradox’ is one of the most completely established empirical facts within the whole field of quantitative economics.
J. M. Keynes ([1930] Reference Keynes1971)It is true that, in various countries and often for long periods of time, the movements of interest rates and commodity prices have been such as to suggest that they might be rationally related to one another in some direct and simple manner the exceptions to this appearance of relationship are so numerous and so glaring that they cannot be overlooked.
F. R. Macaulay (Reference Macaulay1938)The relationship between interest rates and prices, inter alia, lies at the heart of monetary theory. It is therefore no surprise to discover that a debate on what came to be known as the ‘Gibson Paradox’ played an important role in the development of theories of interest rate determination. A number of important works in the early part of the twentieth century, most notably Wicksell (Reference Wicksell1907), Fisher (Reference Fisher1930) and Keynes (Reference Keynes[1930] 1971), noted and offered explanations for the positive association between the level of interest rates and of prices. However, as Macaulay (Reference Macaulay1938) says, there has also been a healthy strain of opinion denying the very existence of the paradox. More recently another generation of researchers has rediscovered the paradox and offered another set of explanations: Sargent (Reference Sargent1973); Shiller and Siegel (Reference Shiller and Siegel1977); Benjamin and Kochin (Reference Benjamin, Kochin, Bordo and Schwartz1984); Friedman and Schwartz (Reference Friedman and Schwartz1982); and Barsky and Summers (Reference Barsky and Summers1988). The long swings in prices were, of course, noted by non-monetary theorists such as Lewis (Reference Lewis1954), who suggested that the long-run elasticity of labour supply meant that commodity prices returned to a long-run trend. In this article, though, we will assess the evidence for this paradox and recast an ‘old’ explanation: that of Wicksell, who suggested that the paradox resulted from persistent deviations of the ‘market’ rate of interest from its ‘natural’ level.
Just what is the Gibson Paradox? When Keynes was naming the Gibson Paradox he was still working within the classical paradigm. Within a classical framework the natural interest rate is determined by saving and investment and the price level by the quantity of money. Why then should there be any relationship between the two? If one considers equilibrium states, the variables determining saving and investment and those determining the price level are not connected. The classical dichotomy rules the roost. In other words, why should interest rates and prices be associated in any way? Furthermore, under a classical quantity theory we might even expect monetary expansions and price rises to be associated with falls in the level of the nominal interest rate whereupon the paradox arises from the Gibson's observation that interest rates and prices are actually positively associated.
In many ways the most attractive and simple explanation for the paradox is Irving Fisher's (Reference Fisher1930). He suggested that interest rates would rise to compensate bondholders for the expected devaluation of money over the holding period of the bond. We would therefore expect to find a positive relationship between expected inflation and interest rates, and to the extent that prices are positively correlated with expected inflation we will find a Gibson Paradox.Footnote 1 This explanation is consistent with the classical dichotomy by allowing the real interest rate to be independent of inflation. To a great extent, intuition suggests that the Fisher explanation is likely to be a powerful reason for the continuing observation of the Gibson Paradox in the period when inflation rates became persistent i.e. at some point in the period following the final suspension of the gold standard.
But, along with Sargent (Reference Sargent1973), we suspect that the existence of the paradox is unlikely to result from a Fisher-style story in the years prior to suspension of the gold standard in 1914. This is because the pattern of the association (see Figure 1) is essentially very long run. Sargent (Reference Sargent1973) sums this point up well: it is difficult to accept both Fisher's explanation of the Gibson Paradox and to maintain that the extraordinary long lags in expectation are rational. In fact, Shiller and Siegel (Reference Shiller and Siegel1977) argue that as it is always possible to sum up long-period changes in the price level to something that is essentially the price level, and therefore that the Fisher hypothesis is particularly prone to Type II errors. These points lead us to explore the relationship solely in the period of zero average inflation (prior to 1914) and to explore as the most likely set of explanations that interest rates and prices are mutually determined within the context of a simple Wicksellian model in which the interplay between commercial banks' desired reserve ratios and deviations between the market and natural rate of interest set up interest rate and price dynamics corresponding to a Gibson Paradox.Footnote 2
The UK price level and long-term interest rates, 1700–1913

The article is structured as follows. Section II outlines the facts relating to the so-called Gibson Paradox. Section III argues that a theory of fluctuations is required to explain the paradox and finds that the early theories of Wicksell (Reference Wicksell1907 and also Reference Wicksell1898a and Reference Wicksell1898b) and Keynes (Reference Keynes[1930] 1971) incorporated compelling (and testable) explanations for the paradox. Section IV constructs a new series of the reserve ratio and tests the Wicksellian theory in the frequency domain. Section V concludes and offers some pointers to future work.
II
The international evidence
This section outlines the characteristics of the relationship between the level of prices and the level of interest rates for seven countries.Footnote 3 We examine the association in the commodity standard period leading up to the end of the classical gold standard in 1914. During the course of the twentieth century the price level starts to incorporate a permanent inflation rate and hence the nominal interest rate rises to compensate bondholders for this permanent devaluation in the value of money: a Fisher effect dominates all other possible explanations for the relationship in levels (see Barsky Reference Barsky1987 on this point).
The time series plots, Figures 1 and 2, suggest, reasonably clearly, that there appears to be some positive association between interest rates and the log-level of prices.Footnote 4 The relationship appears to hold most consistently throughout the respective samples for the UK, Germany and Sweden: countries that had almost uninterrupted adherence to commodity standards for the samples shown.Footnote 5 Of course, this does not imply necessarily that the Gibson phenomenon is one peculiar to commodity standards but it seems clearer why previous researchers may have thought so.
Industrialising country price levels and interest rates
For the US, the association appears strongest for the period following the peak in the prices in 1864 to the end of our sample. In France, the association breaks down most clearly during the first decade of the nineteenth century and the first commodity standard suspensions of 1848–50 rather than the later one of 1870–8. In Italy, we find that the association is clearest from 1872 through to some time in the mid 1890s. The Italian authorities had suspended metallic convertibility in 1866, adopted the gold standard in 1884 and suspended again in 1894. The association would then seem to correspond most closely to the period leading up and involving gold standard convertibility. Finally, with the Spanish data we observe the pattern of (money) interest rates and prices that Tooke (Reference Tooke1844) had argued would support the Thornton–Ricardo view of a classic monetary shock: higher money, lower interest rates and higher prices. It turns out that the Spanish authorities had ended gold and silver convertibility in 1883 (the year our sample starts) and followed loose monetary and fiscal policies until at least 1905. This simple plot of the long-run annual data would seem to suggest that there is a Gibson's Paradox in the commodity standard period in need of explanation. For the rest of the article we will confine our analysis to the Keynes–Wicksell position on this data set.
The UK experience
We explore in some more detail the relationship in the UK. There are simple data driven reasons for this, in terms of span and availability of a wide range of UK macroeconomic data.Footnote 6Figures 1 and 3 suggest not only a long-run pattern to the positive association between the interest rate on consols (and other instruments) and the price level, note for example the number of short-run price cycles without corresponding movements in consol rates, but also that there were long periods of falling (I), rising (II) and then falling (III) prices.Footnote 7 We note the periods of falling prices correspond approximately to peace-time and the rising prices to wartime: the significance of which is the implication for temporary government expenditures, which can be expected to raise both prices and interest rates (see Barro Reference Barro1987).Footnote 8
Short- and long-term interest rates: 1700–1913
Figure 3 depicts the fall in interest rates after the end of the War of Spanish Succession (1702–13). The long-term interest rate is the yield of new government long-term issues from 1702–28, old 3 per cent Annuities from 1729–52 and 3 per cent consol rate from 1753. Note that the other interest rates shown are all short-term bills. Short-term government obligations called Exchequer bills were issued from 1696, bore fixed interest, were assignable and matured after one year.Footnote 9 Neither consol rates nor Exchequer bills, as government obligations, were subject to the Usury Laws and are considered a good indicator of the whole family of rates in the period up to 1833 (Ashton Reference Ashton1959, p. 87). Clapham (Reference Clapham1944) states that the last remnants of the Usury Laws were removed in 1854, though they had not interfered with anyone since 1838 nor perceptibly with the Bank since 1833 (vol. II, p. 4). The Bank of England Bank Rate and the discount rate on prime bills become increasingly the short-term reference interest rates as the nineteenth century wears on. As such we find that their longer-run movements are closely related to the long-term interest rate.Footnote 10
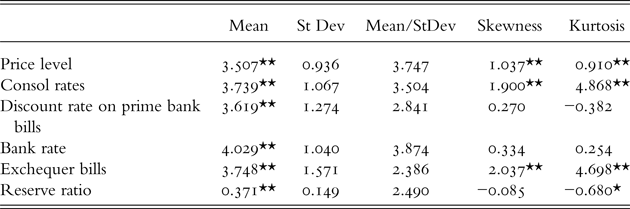
Table 1 shows the summary statistics for the UK. We find that the price level and both short- and long-term interest rates show very similar time series properties. The third column, the inverse of the coefficient of variation, is indicative of the (inverse) probability of a turning point in the data and suggests that there is relatively little important cycling away in the very lower frequencies of the data.Footnote 11 We find significant evidence of right-skewness in prices, the consol rate and the Exchequer bill rate. Finally, consistent with column 3, the data also suggest significant leptokurtic behaviour, which implies a heightened likelihood of (business cycle) changes around the mean.
Summary statistics of UK prices and interest rates, 1702–1913
Notes: (a) we use log-level for prices and levels for interest rates; (b) * and ** indicate significant difference from zero at 5% and 1% respectively; (c) discount on prime bank bill series is from 1800, the Bank rate from 1797 and the Exchequer bill series until 1856.
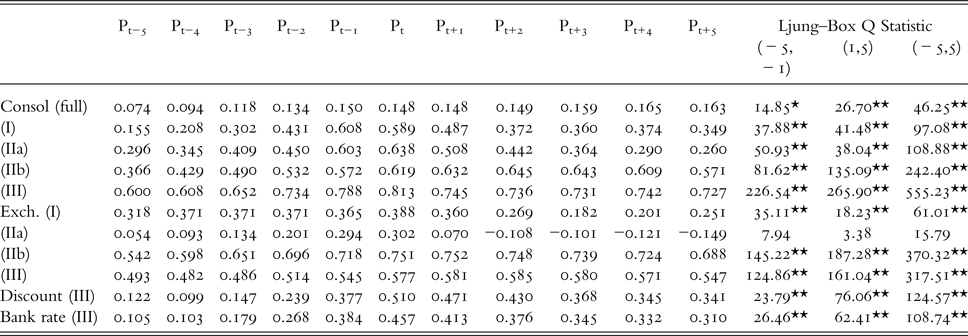
Table 2 suggests important correlations contemporaneously and at leads and lags of up to five years for prices and each class of interest rates.Footnote 12 The significance of the tie-up across interest rates and through all subperiods provides some evidence in favour of some common determinant of the price and interest rate process in the UK data set.
Interest rate lead and lag correllogram with prices
Notes: The full sample corresponds to 1702–1913; period I is 1702–50; period II is 1751–97 (a) and 1751–1815 (b) and period III is 1821–1913; the Ljung–Box statistic is approximately χ2.
In conclusion, we find evidence to suggest that there is a positive relationship between the level of interest rates and the log-level of prices. The association is positive and seems closely related to the long-run, or trend, movements in prices and interest rates. In the UK, this means that the association results from the downswing in prices and interest rates in the first half of the eighteenth century, from the long upswing in interest rates and prices of the latter-half of the eighteenth century and the long downswing that characterised the (long) nineteenth century. Finally, the association is found to be essentially persistent throughout the business cycle. The next section examines some of the reasons suggested for this association.
III
A discussion of Wicksell and Keynes
As stated in the introduction, the Gibson Paradox was so named by Keynes (Reference Keynes[1930] 1971): Gibson had observed a close correlation between the interest rate and the price level over a period of over a hundred years and Coates (cited in Keynes Reference Keynes[1930] 1971, pp. 200–1) confirmed these results for the period 1825–1924 and 1908–24. The relationship was noted and rationalised by Wicksell (Reference Wicksell1907) and by Hawtrey (Reference Hawtrey1927). We shall consider Wicksell's and Keynes' explanations for the paradox in some detail. This is not only because of their historical interest. In contrast to many of the more recent explanations, both explained the relationship in terms of a general macroeconomic model.
In our discussion of the paradox and to facilitate comparisons with previous explanation it will be useful to reintroduce into the discussion the Wicksellian distinction, also used by Keynes, between the natural rate of interest, the real rate of interest and the market (or, equivalently, loan) rate of interest. According to both Keynes and Wicksell the natural rate of interest is that rate at which saving equals investment, or alternatively that rate at which aggregate demand is equal to aggregate supply. The only modification we wish to make to this definition, to be able to incorporate more recent versions of macro models which distinguish between a short-run upward sloping supply curve and a long-run inelastic supply curve, is to add to the definition that it is that interest rate at which saving is equal to investment in long-run equilibrium. The interest rate at which saving is equal to investment, but not necessarily in long-run equilibrium, is the real rate. And the market rate is the real rate plus anticipated inflation – the Fisherian distinction.
Why did Wicksell and Keynes consider Gibson's observation to be a paradox? Wicksell was concerned with the question of how prices could be controlled by the banking system. In his analysis he considers a situation in which banks set the interest rate and supply the amount of money that is demanded, a situation in which demand and supply of money have become about the same thing, the demand to a large extent creating its own supply (1907, p. 215). If the interest rate is set below (above) the existing rate of profit, or as Wicksell called it the natural rate of interest, prices rise (fall) because of the ensuing excess demand (supply) in the commodity market. Wicksell tells us that the proposition that a low rate of interest will raise prices and a high rate will lower prices has been stated more than once, but a formidable objection was always triumphantly brought against it in the shape of statistical facts: high prices do not correspond with a low rate of interest, and, vice versa; it rather comes the opposite way, interest and prices often rising and falling together (1907, p. 216). So Wicksell had to reconcile his theory that a low (high) rate of interest leads to rising (falling) prices and the observation that prices and interest rates move together.
He did so by arguing that the rate of interest is never high or low in itself but only in relation to the profit which people can make, and this of course varies. In good times, when trade is brisk, the rate of profit is high, and, what is of great consequence, is generally expected to remain high; in periods of depression it is low, and expected to be low. The rate of interest on money follows, no doubt, the same course, but not at once, not of itself; it is, as it were, dragged after the rate of profit by the movement of prices and the consequent changes in the state of bank reserves, caused by the difference between the two rates (Wicksell 1907, p. 217). Bank reserves change because as prices rise (fall) the demand for money rises (falls), the supply of money follows, changing the reserve ratio of the banking establishment.
The solution to the Gibson Paradox given by Keynes was to consider the transition from one equilibrium state to another. There are various elements to Keynes' explanation of the Gibson Paradox. The first element is the effect of increases in the capital stock on the natural rate. He argues that the movements in the natural rate are long period movements ‘extending over decades’ because ‘he annual increment in any year to the aggregate of capital is small relative to this aggregate...’ (Reference Keynes[1930] 1971, p. 182). The change in the capital stock affects the marginal efficiency of capital or the profit rate, resulting in a shift of the investment function. This is Keynes before The General Theory, where changes in investment depend more on animal spirits than on the stock of capital. These changes in investment imply changes to the natural rate of interest. To re-equilibrate the commodity market, the real rate of interest has to change so as to be equal to the new natural rate. However, the real rate, as measured by the yield on consols, is sticky. There is thus an excess supply or demand in the commodity market and prices change. As prices change the real rate starts catching up with the natural rate until we reach equilibrium. The explanation for the stickiness in the real rate given by Keynes is that ‘in London bank lending is not conducted wholly on the principles of a free market’ (Reference Keynes[1930] 1971, p. 182). Presumably because of this market any excess demand or supply of loans does not affect the interest rate in the short run and we observe quantity adjustments in bank lending rather than price adjustments.
Keynes considers a possible objection to his explanation, namely, ‘that over longish periods the price level is governed by the supply of money... and this is governed by causes quite independent of the rate of interest’ (Reference Keynes[1930] 1971, p. 183). It is clear from the context that what Keynes has in mind is the increases in the supply of gold and silver that have occurred over the period he was considering. His response is that
the degree of ‘management’ which has existed during the past hundred years, aimed at adjusting the supply of money to the status quo, is commonly under-estimated. In fact, central banks have shown themselves much more adaptable to changes in the supply of gold, relative to the demand for it, than is sometimes supposed. They are natural gold hoarders, and are always keen to increase their stocks of it whenever they find themselves in a position to do so without inconveniencing the business world; so the abundant supplies of gold can often be absorbed without producing as much effect on prices as might have been expected. On the other hand when gold is in short supply, they are reluctant to put strong pressure on the business world ... they will find some way, e.g. by slowly modifying their reserve practices or the use of gold in circulation, of making a smaller quantity of gold ‘do’ as well as a larger would have with their old habits and practices. (Reference Keynes[1930] 1971, p. 184)
Besides the long-period effects of the increase in the capital stock on the natural rate, Keynes also considers short-period disruptions: ‘During the Napoleonic Wars, during the Boer War and during the great expansion of foreign investment which followed it (1901–1914), and during the Great War, the rate of interest did not rise fast enough to keep saving level with investment’ (Reference Keynes[1930] 1971, p. 185). Similarly, Wicksell writes ‘the long wars unquestionably entailed a tremendous sacrifice of liquid capital just at the time when this was being made use of by production to an ever larger extent. The natural rate of interest on capital must therefore have been very high throughout this period’ (Reference Wicksell1898b, p. 86).
This long-term explanation implies that as the capital stock increases over time the aggregate supply curve shifts to the right, requiring a lower natural rate to equilibrate the commodity market. The excess supply of commodities results in a fall in prices. We can follow Keynes (Reference Keynes[1930] 1971) and assume that the market rate of interest adjusts slowly to the natural rate. However, we would also observe the same relationship between prices and the interest rate if, following Keynes (Reference Keynes[1936] 1974), the interest rate equilibrates the money market and the quantity of nominal money is fixed. The fall in prices results in an increase in the real quantity of money and a fall in the interest rate. The ‘war’ effect merely introduces autonomous expenditure and a higher natural rate. Prices rise because of the excess demand for commodities, and the market rate of interest adjusts slowly to the natural rate.
Keynes' explanation for the long-term movements of prices and the interest rate is reasonably consistent with the data he considered, from about 1795 to 1928. However, it is more problematic when considering the eighteenth century. Between about 1750 and 1800 prices and the interest rate were both rising. Though the capital stock and output may not have been rising by as much as during the nineteenth century, they were surely not falling, which is what would be required for a symmetrical explanation of the long-term trend. One may be able to reconcile the data from this period by combining Keynes' long-term and his ‘war’ explanation. These work in opposite directions.
Though there are major similarities between Wicksell's and Keynes' explanation for the Gibson Paradox, there are two substantial differences. According to Wicksell, the crucial link between prices and interest rates operates via bank reserves. Changes in these above (below) the desired level induce the changes in the market interest rate. Consider the situation after a rise in the natural rate due to a change in the profit rate. Prices start rising because of the excess demand for commodities, the demand for nominal money starts rising and so bank reserves start falling and the banks start raising the market rate. When the market rate reaches the new natural rate, prices stop rising. At this point bank reserves are still lower than they were at the beginning of the process. They are no longer falling but their level is lower than before. If banks do have a desired reserve ratio they will now raise the market rate above the natural rate. Prices will start falling and now reserves will start rising back towards the original level. When they reach that level banks may reduce the interest rate towards the natural rate. There is overshooting of the market rate relative to the natural rate. This would not occur in Keynes' story. According to him, banks can live happily with a wide range of reserves and can easily adjust to changes in reserves.
The second major difference between Keynes and Wicksell concerns the effects of an increase in gold, for example, because of a new discovery. The implication of Wicksell's theory is that such increases result in a decline in the market rate of interest because bank reserves would rise above their desired level. With the natural rate unchanged, prices would start rising, the reserve ratio would start falling and the market rate would start adjusting back to the natural rate. In Keynes' theory this would not happen as the new gold would be swallowed by the natural gold hoarders and would not result in a fall in the market rate of interest.Footnote 13
Wicksell's theory
Wicksell developed his theory of the relationship between the natural and the money rate of interest in response to the criticisms levied against the quantity theory by people like Tooke and Mill (Reference Wicksell1898b, pp. 68–71). Many of these criticisms were based on the observation that most transactions were carried out with bank credit and other kinds of credit rather than money. These various credit theories of prices rejected the notion that the quantity of money was of any importance. Wicksell developed his model to cope with both a monetary system in which actual money was used, ‘a pure cash economy’, and one in which actual money had been displaced by book entries in banks, ‘a pure credit economy’ (Reference Wicksell1898b, p. 75). The similarity between the two is in the transmission mechanism.
According to Wicksell, changes in the quantity of money affect prices by first reducing the money interest rate and introducing a discrepancy between it and the real rate, or natural rate. It is this discrepancy that introduces disequilibrium in the commodities market between aggregate demand and supply and results in a change in prices. Similarly, in a pure credit economy a change in the natural rate of interest, which according to Wicksell was highly variable, introduces a discrepancy between it and the bank interest rate and prices start changing. Prices will continue changing as long as banks maintain their interest rate below (above) the natural interest rate.
In Wicksell's ‘pure credit economy’ there seems to be no economic reason for the banks to change their interest rate in response to the rising (falling) prices generated by the discrepancy between the money and the natural rate. In this system banks do not hold cash reserves of any sort. However, Wicksell's system and analysis can be easily formalised in a system in which banks hold some reserves in the form of cash. In such a system, as we shall see, the relationship between prices and interest rates – the Gibson Paradox – becomes more apparent.
A more formal treatment
In this section, we present a formal exposition of the model presented in the previous section. Here a (mono)bank targets an optimal reserve ratio and any differences between the natural rate of interest and the rate charged by banks for loans produces disequilibrium in the market for loans. This disequilibrium results in changes in the aggregate price level and a deviation in the reserve ratio from its optimum. The bank tends to move its loan rate to equal that of the (unobservable) ‘natural’ rate through a process of inspection and iteration and until the nominal quantity of loans is backed by a quantity of commodity money such that the optimal reserve ratio is obtained.
We first model the banking sector. Banks set interest rates so as to maximise profits, π, subject to the risk of non-convertibility, σ, or strictly speaking the risk of losing (gold) convertibility. Banks have the following mean-variance utility function:
 $$U = U\lpar \pi \comma \; \sigma\rpar.$$
Banks face a demand for loans expressed in real terms that depends on the interest rate for loanable funds (market interest rate), say, L(r) with. L ′(·) ≺ 0 The demand for loans is specified in real terms because loans are used to purchase units of investment (or consumption). Banks have costs that we shall assume are some varying percentage of loans, as so:
 $$\pi = rL\lpar r\rpar - cL\lpar r\rpar.$$
The risk of non-convertibility is measured by an inverse function of the reserve ratio, say:
 $$\sigma = \beta \left(\displaystyle{{PL\lpar r\rpar } \over G} \right)\comma \; \quad \beta^{\prime} \lpar{\cdot}\rpar \succ 0$$
The reserve ratio, R, is the inverse of the term in parentheses on the r.h.s. of (3), and we define it as the ratio of the value of gold in reserves, G, to the nominal quantity of loans outstanding, PL(r).. We shall maintain this formulation throughout the rest of this article. From (1), (2) and (3),
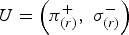 $$U = \left({\pi ^{+}_{\lpar r\rpar} \comma \; {\sigma ^{-}_{\lpar r\rpar}}} \right)$$
 $$\displaystyle{{dU} \over {dr}} = {u_1}\pi^{\prime} \lpar r\rpar - {u_2}\sigma ^{\prime}\lpar r\rpar = 0\comma \; \quad {\rm and}\, {\rm so}$$
 $$\displaystyle{{{u_1}} \over {{u_2}}} = \displaystyle{{\sigma^{\prime}\lpar r\rpar } \over {\pi^{\prime}\lpar r\rpar }}.$$
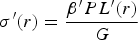 $$\sigma^{\prime}\lpar r\rpar = \displaystyle{{\beta^{\prime}PL^{\prime}\lpar r\rpar } \over G}$$
 $$\pi^{\prime}\lpar r\rpar = \lpar r - c\rpar L^{\prime}\lpar r\rpar + L\lpar r\rpar.$$
 $$\displaystyle{{{u_1}} \over {{u_2}}} = \left(\displaystyle{{\beta^{\prime}PL^{\prime}\lpar r\rpar } \over {G\lsqb \lpar r - c\rpar L^{\prime}\lpar r\rpar + L\lpar r\rpar \rsqb }} \right).$$
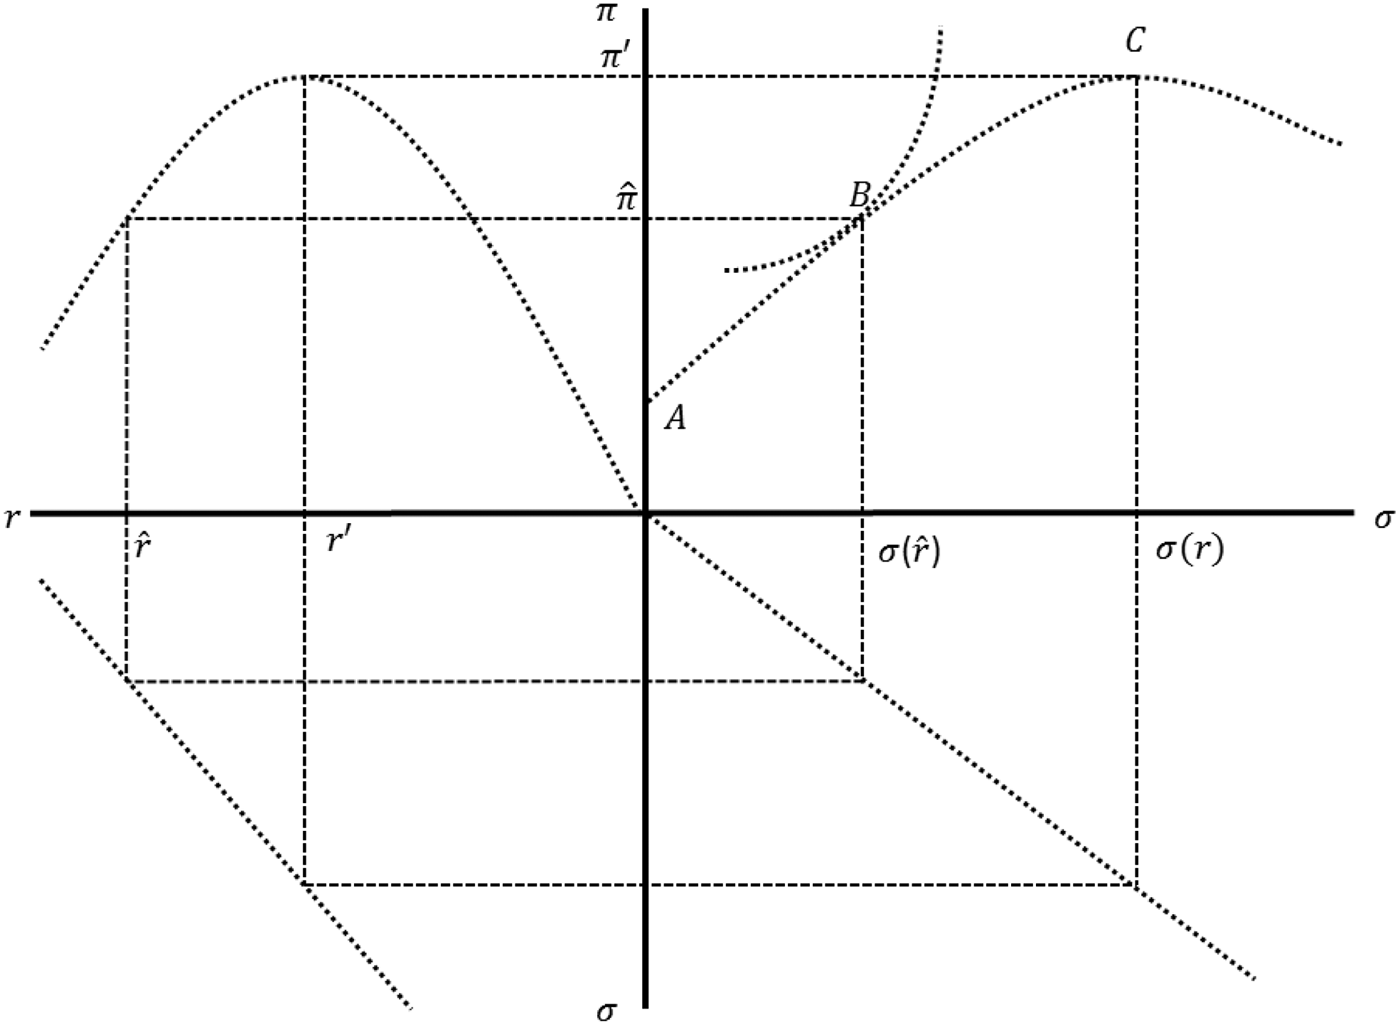
This condition states that the bank will set its market interest rate so that the marginal risk of non-convertibility (the numerator of the r.h.s. of (9)) equals the marginal profits from the loan book (the denominator). We can illustrate the equilibrium in Figure 4. In the north-east quadrant we show a profit curve in π–σ space which is maximised at C. At that point risk of non-convertibility is relatively high, as σ is high and the market interest rate, r′ is low relative to the natural rate of interest,  $\hat r$. In the same quadrant we show the indifference curve representing utility function (1). Note that at A: σ = 0; and implies a 100% reserve ratio where G/PL(r) = 1 and π = (r − c)G. The south-west quadrant shows the trade-off between risk and return (9) faced by the bank and the north-west quadrant represents equation (2). The profit level obtained at B represents the preferred point of trade-off between risk and return. If banks choose an interest that is below (above) the optimal point,
 $\hat r$, prices will start to rise (fall), the reserve ratio fall (rise) - and eventually equilibrium obtains under
 $\hat r$. Note two points about the ‘natural’ rate: (i) it is unobservable and banks will arrive at it only thorough a gradual process of iteration by observing important movements in their reserve ratios and (ii) it is exogenous and movements in its level will produce qualitatively similar effects.
Bank reserves, risk and the natural rate
We move on to analyse the macroeconomic implications of the adjustment process for prices and interest rates. Let:
 $$t = \displaystyle{{eP} \over {{P^{\ast}}}}$$
represent the equilibrium relative prices of home and foreign prices (asterisk). Under convertibility, e is fixed and so we normalise to 1. So that when P ≠ tP* domestic bank reserves will change. Thus:
 $$\displaystyle{{dR} \over {dt}} = \lambda \lpar tP^{\ast} - P\rpar \comma \; \quad \lambda \succ 0 \comma \;$$
 $$\displaystyle{{dP} \over {dt}} = \delta \lpar t{r_t} - {\hat r}\rpar \comma \; \quad \delta \prec 0 \comma \;$$
 $$\displaystyle{{dr} \over {dt}} = \gamma \left(\displaystyle{{dR} \over {dt}} \right)= \gamma \lambda \lpar tP^{\ast} - P\rpar \comma \; \quad \gamma \prec 0.$$
From (12)
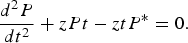
 $$\displaystyle{{{d^2}P} \over {d{t^2}}} = \delta \displaystyle{{dr} \over {dt}} = \delta \gamma \lambda \lpar tP^{\ast} - P\rpar.$$
Now let z = δγλ and so we have
 $$\displaystyle{{{d^2}P} \over {d{t^2}}} + zPt - ztP^{\ast} = 0.$$
Hence the price level will adjust (cycle) to that level implied by (10) and in the process of adjustment interest rates will converge on the ‘natural’ interest rate and the reserve ratio will tend to its optimal level. Note that because the price level must return to its original level, tP*, and so interest rates will have to not only to move to the ‘natural’ rate for a period overshoot their equilibrium in order to bring the price level back to its initial level. The comparative statics are:
Case: Natural rate shifts
The market rates moves gradually up (down) to the ‘natural’ rate. During which time loan disequilibrium leads to excess investment (saving) and increases (decreases) in the aggregate price level. Prices cease to move when the loan rate equals the ‘natural’ rate but because the reserve ratio is below (above) its optimal level, loan rates will temporarily overshoot the equilibrium so that prices fall (increase) to their original level. Here prices and market rates will be positively associated at the lower end of the frequency spectrum.
Case: Gold shock
A positive (negative) gold shock will reduce (increase) the reserve ratio and lead to an expansion (contraction) of the nominal loan portfolio. This implies that market interest rates will temporarily fall (rise) and the price level will rise (fall) permanently to a new level. Here prices and market rates will be positively associated in the final part of the adjustment of interest rates back to the natural rate: that is at higher frequencies.
Case: Change in equilibrium relative price
Lower (higher) domestic prices than equilibrium imply excess domestic demand and domestic prices must adjust to the higher (lower) foreign price level. As there can be no change in the reserve ratio the quantity of loans must fall (rise) and this is instituted by a temporary increase in the market rate. Here prices and market rates will be positively associated in the first part of the adjustment of interest rates away from the natural rate: that is at higher frequencies.
IV
The model developed in Section III allows us to consider a test of the relationships between interest rates, prices and the reserve ratio. We use spectral analysis so we can decompose the variance in each time series into cycles corresponding to different frequencies running from the lowest frequency – the time span of the data – to the highest – in this case annual. Once we obtain the spectral density of each series we can calculate the co-spectra.
A spectral test
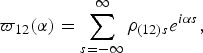
We can define the cross-spectrum between two series as:
 $${\varpi _{12}}\lpar \alpha \rpar = \sum\limits_{s = - \infty }^\infty {{\rho _{\lpar 12\rpar s}}{e^{i\alpha s}}}\comma \;$$
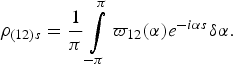
with the corresponding integrated spectral function W(a) defined over the range 0 to π. Solving for the cross correlation we find that
 $${\rho _{\lpar 12 \rpar s}} = \displaystyle{1 \over \pi }\vint\limits_{ - \pi }^\pi {{\varpi _{12}}\lpar \alpha \rpar {e^{ - i\alpha s}}\delta \alpha }.$$
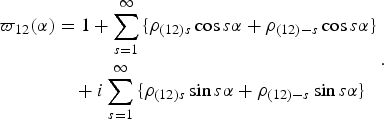
In a univariate setting the sin terms cancel as ρk = ρ−k and the spectral density is real. But now we have:
 $$\eqalign{{\varpi _{12}}\lpar \alpha \rpar &= 1 + \sum\limits_{s = 1}^\infty {\lcub {\rho _{\lpar 12 \rpar s}}\cos s\alpha + {\rho _{\lpar 12 \rpar - s}}} \cos s\alpha \rcub \cr &\quad + i\sum\limits_{s = 1}^\infty {\lcub {\rho _{\lpar 12 \rpar s}}\sin s\alpha + {\rho _{\lpar 12 \rpar - s}}\sin s\alpha \rcub }}.$$
From (18) we can see that the cross-spectra has an imaginary and real component. The first two terms on the right hand side, c(α), are the co-spectra and the final term, q(α), is the spectral density. The sum of the squares of these two terms is the amplitude, which when standardised by the spectral densities of each separate series, ϖi(α), is called the coherence:
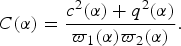 $$C\lpar \alpha \rpar = \displaystyle{{{c^2}\lpar \alpha \rpar + {q^2}\lpar \alpha \rpar } \over {{\varpi _1}\lpar \alpha \rpar {\varpi _2}\lpar \alpha \rpar }}.$$
The coherence measures the degree to which the series vary together and can be thought of as the squared correlation coefficient. The gain diagram plots ordinate R 122(α) against α as abscissa, where
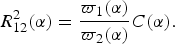 $$R_{12}^2 \lpar \alpha \rpar = \displaystyle{{{\varpi _1}\lpar \alpha \rpar } \over {{\varpi _2}\lpar \alpha \rpar }}C\lpar \alpha\rpar.$$
The gain is analogous to a regression coefficient. Finally, the phase diagram plots ψ(α) as against α as abscissa, with the phase measuring the lead or lag in the relationship at each frequency:
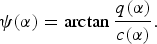 $$\psi \lpar \alpha \rpar = \arctan \displaystyle{{q\lpar \alpha \rpar } \over {c\lpar \alpha \rpar }}.$$
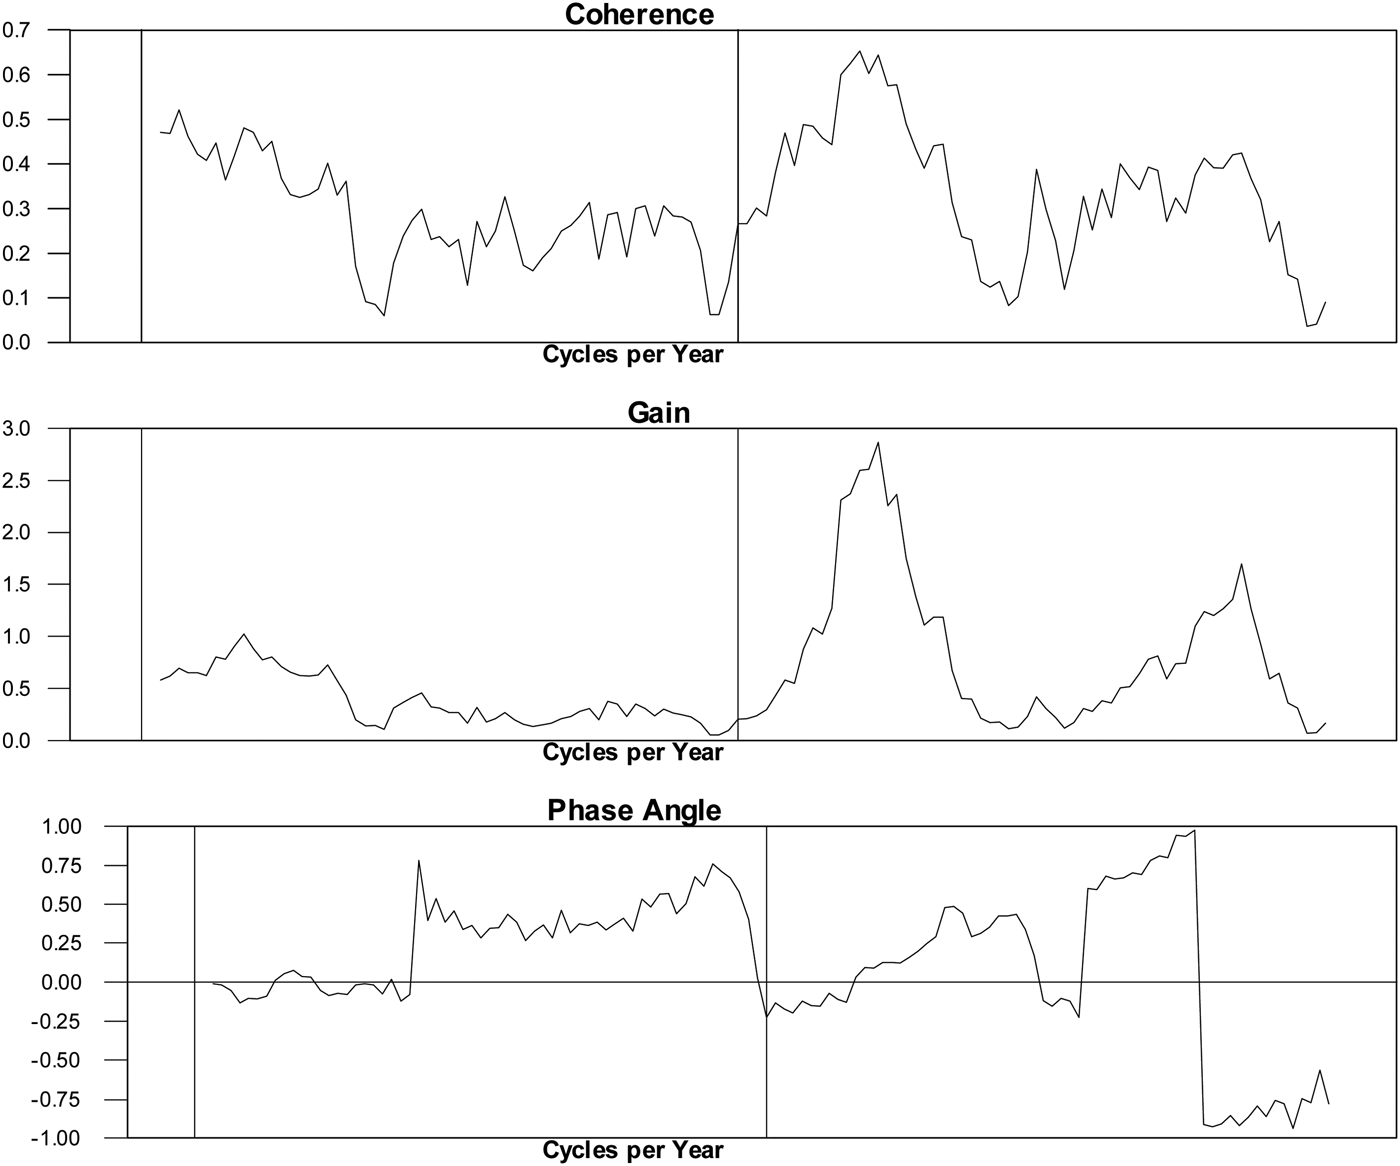
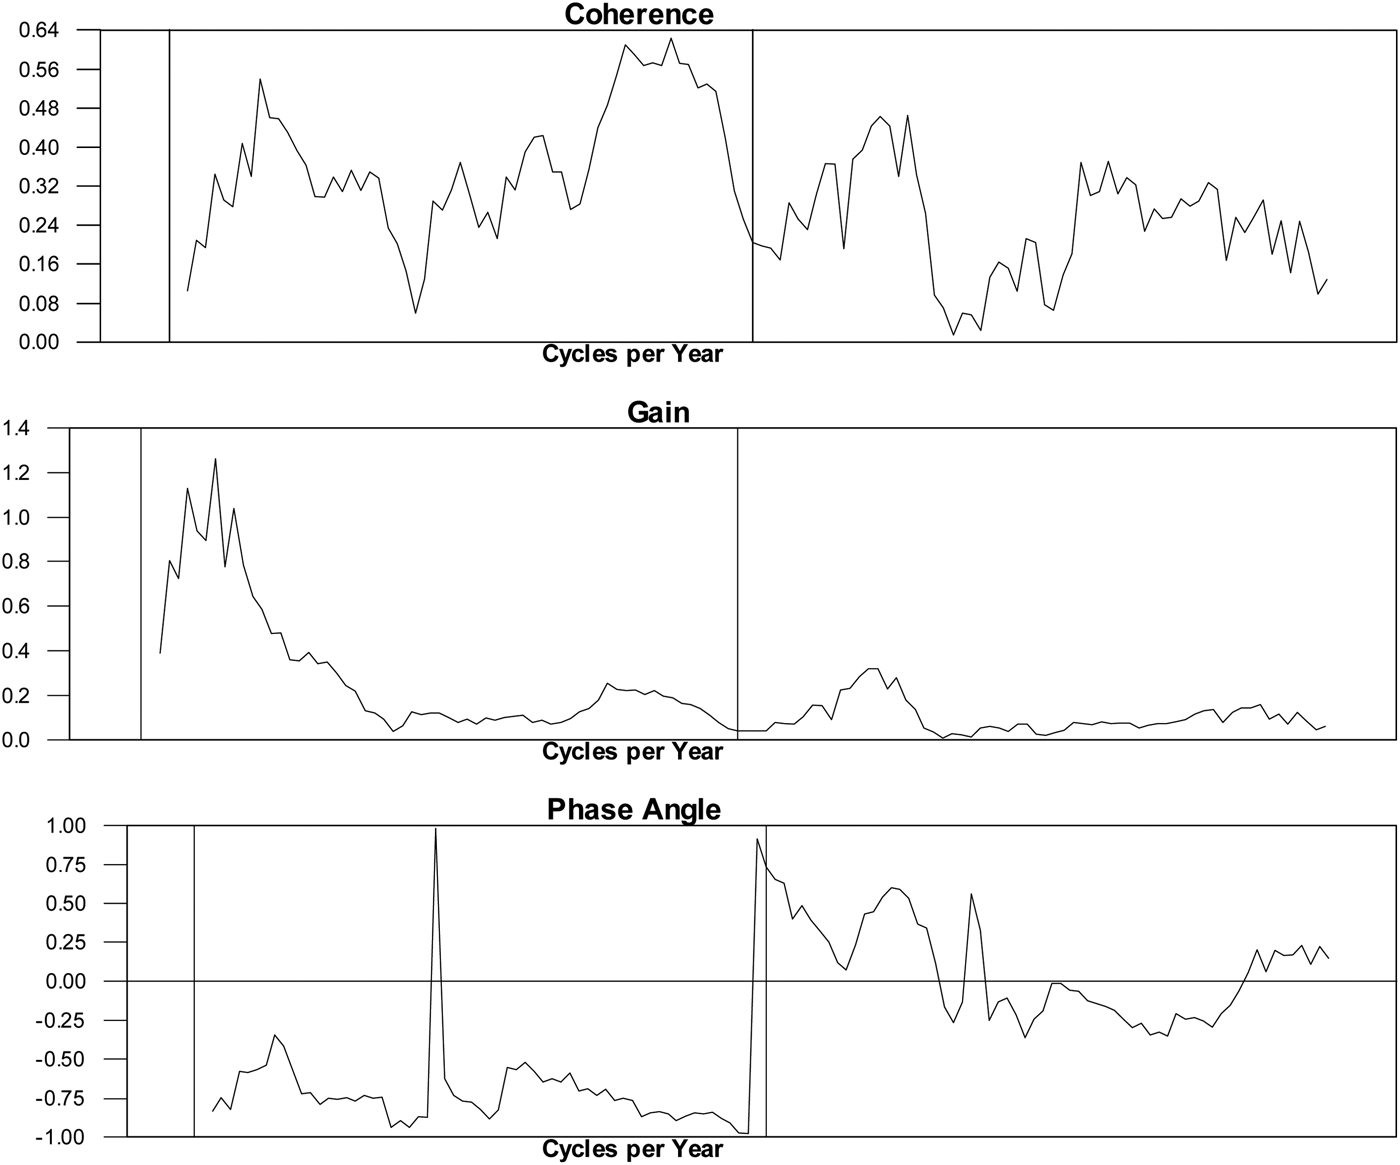
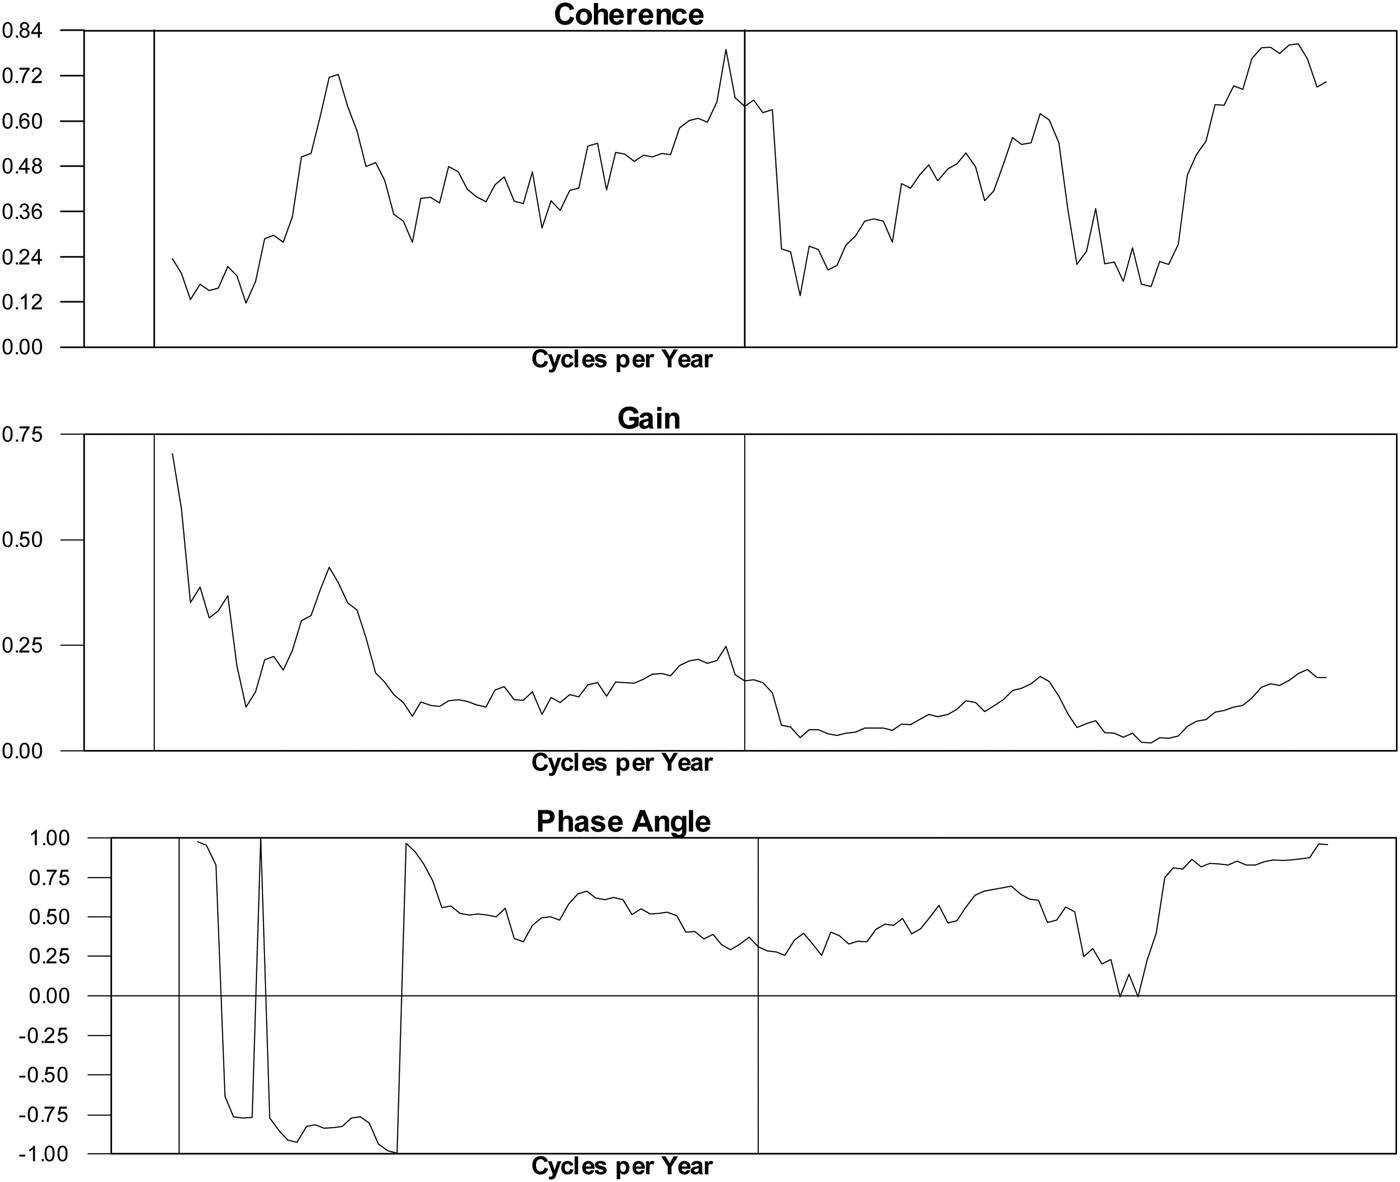
Figures 5–7 show (i) the coherence is the squared correlation coefficient at each frequency, (ii) the gain and (iii) the phase as a fraction of the cycle by which one series leads (lags) the other for prices and interest rates and then each against the ‘target’ variable in a partial-reserve commodity standard: the ‘optimal’ reserve ratio.Footnote 14Figure 5 suggests clear coherence at the trend frequency between interest rates and prices and at the higher frequency end of the business cycle: about 18 months. The gain statistic is most powerful at the high business cycle frequency and suggests the existence of a short cycle relationship between interest rates and prices. But note that at these significant horizons the relationship is essentially unlagged and therefore likely to be related to some common shock – ‘natural’ rate shocks for the low frequency coherence and gold and foreign price shocks for the higher frequency coherence.
The price level and the consol rate, 1702–1913
The price level and the reserve ratio, 1702–1913
The consol rate and the reserve ratio, 1702–1913
What is the connection between interest rates and prices and our measured reserve ratio?Footnote 15Figure 6 finds important coherences at the trend and longer business cycle frequencies (two to three years) and notes that the gain is highest at the trend. We also find that prices lag the reserve ratio quite prominently. Figure 7 paints a very similar picture in terms of coherences and gain between interest rates and the reserve ratio, with peaks at five years, two years and one year, but finds at the lower frequency peak that interest rates lag the reserve ratio and at higher frequency peaks leads the reserve ratio. We interpret these results as providing corroboration of the importance of longer-run movements in the interest rates and prices as resulting from deviations of the reserve ratio from its desired level. But that the important switch at shorter horizons provides some evidence for the role also played by shorter-run adjustment to gold shocks and foreign price level disturbances in explaining the paradox.
A time series test
We investigate the issue a little further with the help of an identified vector autoregression (VAR). Following Koop et al. (Reference Koop, Pesaran and Potter1996), we estimate generalised impulse response functions within the context of a multivariate time series model. We use a generalised rather than orthogonal identification because over the course of a year, our frequency of measurement, we do not think that it makes sense to think about which variable leads which other. The generalised function allows us to think about the response of a variable to a generalised residual in the any of the VAR's equations.
 $${{\bf z}_t} = {{\bf a}_0} + \sum\limits_{i = 1}^p {{{\bf \Phi} _i}{{\bf z}_{t - i}} + {\bf \Psi} {{\bf w}_t} + {{\bf u}_t}\comma \; \quad t = 1 \comma \; 2 \comma \; \ldots \comma \; n.}$$
where zt is an m × 1 vector of jointly determined dependent variables, wt is a q × 1 vector of exogenous variables and the m × 1 vector of disturbances satisfy standard criteria. Given that the VAR is stable, all the roots of the determinantal equation will lie outside the unit circle, the moving average representation of (23) can be employed:
 $${{\bf z}_t} = \sum\limits_{\,j = 0}^\infty {{{\bf A}_j}{{\bf u}_{t - j}} + \sum\limits_{\,j = 0}^\infty {{{\bf B}_j}{{\bf w}_{t - j}}}}\comma \;$$
where matrices, Aj and Bj, are computed recursively. The generalised impulse response function for a system-wide shock, ut0, is defined by:
 $$G{I_{\bf z}}\lpar N\comma \; {\bf u}_t^0 \comma \; \Omega _{t - 1}^0 \rpar = E\lpar {{\bf z}_{t + N}}\vert {{\bf u}_t}\rpar - E\lpar {{\bf z}_{t + N}}\vert \Omega _{t - 1}^0 \rpar$$
where E(·|·) is the mathematical conditional expectation with respect to the VAR model and Ωt−10 is the realisation of the process at time t − 1. And when the VAR has a moving average representation we have:
 $$G{I_{\bf z}}\lpar N\comma \; {\bf u}_t^0 \comma \; \Omega _{t - 1}^0 \rpar = {{\bf A}_N}{\bf u}_t^0 \quad \sim N\lpar 0 \comma \; {{\bf A}_N}\sum {{{\bf A}^{\prime}}_N}\rpar$$
For a given set of exogenous variables, if the VAR model is perturbed by a shock,  ${\delta _i} = \root 2 \of {{\sigma _{ii}}}$, to the ith equation at time t. The definition of the generalised impulse response allows us to write:
 $$G{I_{ij\comma N}} = \displaystyle{{{\bf e}_j^{\prime} {{\bf A}_N}\sum {{{\bf e}_j}} } \over {\root 2 \of {{\sigma _{ii}}} }}\comma \; \quad i\comma \; j = 1 \comma \; 2 \comma \; \ldots \comma \; m\comma \;$$
where e is the m × 1 selection vector and the generalised impulse response function of a unit shock to the ith equation in the VAR on the jth variable at horizon N is given by the jth element.
Figure 8 plots the response of the reserve ratio, consol rate and the price level to unit shock to the equation for the reserve ratio. The pattern of impulse response functions broadly corroborates the results in the previous section – the consol rate and price level move in an opposite direction to the reserve ratio and equilibration is measured in decades. When the reserve ratio is temporarily shocked into surplus the market rate slowly falls as does the price level over a period of four years. The consol rate then starts to return slowly to the long-run level, equivalent to the unobserved ‘natural’ rate, the half-life of which is a further eleven years. The price level shows evidence of cycling slowly back to its long-run level.Footnote 16 One final point, the reserve ratio shows considerably less persistence than the other two variables but seems closely (and inversely) related to the long-run pattern of fluctuations in the consol rate and the price level.Footnote 17 Given that there are several regime changes and temporary, yet persistent shocks, induced by war – the most prominent example being the suspension of convertibility in 1797 – we may consider it necessary to model these events as well, but the overall statistical properties of the VAR do not suggest the need for sub-sampling and so, tentatively, we do think these results are at least consistent with the Wicksellian version of events.Footnote 18
Impulse responses (years) to a unit shock in the reserve ratio
V
Over the two hundred years for which we have data, the British economy has been subjected to a whole variety of shocks: wars and famines, gold and silver discoveries, changes in monetary regimes, the industrial revolution and many others (see Crafts Reference Crafts1985). Yet over this whole period the relationship between interest rates and prices, the Gibson Paradox, seems to have persisted. As Keynes put it, ‘It is very unlikely indeed that it can be fortuitous, and it ought, therefore, to be susceptible of some explanation of a general character’ (Reference Keynes[1930] 1971, p. 179). Explanations offered include causality running from prices to interest rates via wealth effects (Shiller and Siegel Reference Shiller and Siegel1977), or from interest rate to prices via excess supply of money (Barsky and Summers Reference Barsky and Summers1988).
Over this period wealth was changing for all sorts of reasons: there was growth of capital, population changes and the discovery of new technologies. It seems likely that the wealth effects arising from an unanticipated rise in prices might be swamped by the real changes occurring over this period. Similarly, the excess supply of money over this period would be affected on the supply side by gold and silver discoveries and changes in monetary regimes and on the demand side by changes in real income. Any interest rate effect on gold hoards and on the demand for money would be second order and its effects would be unlikely to dominate everything else. If our stylised fact is right then, as conceded by Friedman and Schwartz, all that is required is that real disturbances that tend to raise nominal rates should also tend to raise prices; and real disturbances that tend to raise prices should also tend to raise interest rates (1982, p. 565).
What we find likely, prompted by Wicksell and Keynes, is that the need to maintain commodity convertibility lay at the heart of the Gibson Paradox. The banking sector needed to maintain a given reserve ratio but, in the face of both persistent and temporary shocks to the economy's ‘natural’ rate, would only gradually move the ‘market’ interest rates to levels where neither prices nor the reserve ratio would then move. The insight of Wicksell, and to an extent Keynes, was to realise that in a monetary economy, real disturbances were more than likely to have significant monetary consequences – it is an insight that has arguably not yet been fully appreciated.
APPENDIX: DATA SOURCES
Price indices
The main source publications for the Wholesale Prices Index series are:
Mitchell, B. R. (1988). British Historical Statistics. Cambridge: Cambridge University Press.
Mitchell, B. R. (1998). International Historical Statistics: Europe 1750–1993. London: Macmillan Reference.
US Bureau of Census (1960). Historical Statistics of the United States (Colonial Times to 1957). Washington, DC: US Government Printing Office.
The Statistical Abstract of the United States: The National Data Book. Washington, DC: US Government Printing Office, various years.
Estadísticas históricas de España: siglos XIX y XX. Madrid: Fundación Banco Exterior, 1989.
France [period 1798–1993]; Germany [period 1792–1993]; Italy [period 1861–1993]; Sweden [period 1860–1993] all from Mitchell (1998).
Spain WPI [period 1812–1954] from Estadísticas históricas (1989), pp. 518 and 521–2.
UK [period 1727–1980] from Mitchell (1988).
US [period 1749–1951] from Historical Statistics of the United States, pp. 210–11 and [period 1926–88] from The Statistical Abstract of United States, various years.
Interest rates
The main source publications for the Interest Rate series are:
Bordo, M. D. and Rockoff, H. (1996). The gold standard as a ‘Good Housekeeping seal of approval’. Journal of Economic History, 56(2), pp. 389–428.
Homer, S. (1963). A History of Interest Rates. New Brunswick, NJ: Rutgers University Press.
France: long-term interest rates (annual average) from Homer (1963, pp. 222–3) with 5% Rents [Government Securities]. Period 1800–52 and 3% Rents [Government Securities]. Period 1853–1961. Short-term interest rates (annual average) (Homer 1963, pp. 230–1 and 435–6) and Discount Rate of Bank of France. Period 1800–1961.
Germany: long-term interest rates (annual average) from Homer (1963, pp. 259–60 and 461–2) and Prussian State 4s Yields. Period 1815–83, Imperial German 4s Yields. Period 1884–1908, High-Grade Bond Yields. Period 1900–62 and short-term interest rates (annual average) from Homer (1963, pp. 264–6 and 467–8). Minimum Rate of Discount of Reichsbank. Period 1817–1900 and Official Discount Rate. Period 1900–62.
Italy: long-term interest rates (annual average) from Bordo and Rockoff (1996). Period 1870–1920.
Spain: long-term interest rates (annual average) from Bordo and Rockoff (1996). Period 1883–1914.
Sweden: long-term interest rates (annual average) from Homer (1963, pp. 272 and 476–7) and Long-term Effective Rate of State Bonds. Period 1855–1954. Short-term interest rates (annual average) from Homer (1963, pp. 272 and 476–7) and Discount Rates of Bank of Sweden. Period 1854–1962.
UK: Long-term interest rates (annual average) from Homer (1963, pp. 161–2), Old 3% Annuities [Government Securities]. Period 1729–52, 3% Consols [Government Securities]. Period 1753–1899 from Homer (1963, pp. 409–10), 2.5% Consols [Government Securities]. Period 1900–61.
US: Long-term interest rates (annual average) from Homer (1963, pp. 286–7), High-Grade Railway Bond Yields. Period 1857–1937, New England Municipal Bonds Yields. Period 1798–1900, Federal Government Bond Yields. Period 1790–1832 and short-term interest rates (annual average) from Bordo and Rockoff (1996). Period 1870–1914 and short-term interest rates (annual average) from Mitchell (1998, chapter 16) and 3 month bank bill. Period 1824–1991.