1. Introduction
Convection-driven flows are ubiquitous in both natural environments and industrial applications (Marshall & Schott Reference Marshall and Schott1999; Niemela et al. Reference Niemela, Skrbek, Sreenivasan and Donnelly2000; Hartmann, Moy & Fu Reference Hartmann, Moy and Fu2001; King, Wilson & Owen Reference King, Wilson and Owen2007; Bairi, Zarco-Pernia & Garcia de Maria Reference Bairi, Zarco-Pernia and Garcia de Maria2014; Owen Reference Owen2015). Rayleigh–Bénard convection (RBC) serves as the classical paradigm of thermal convection, with a cooled upper plate and heated lower plate. The canonical planar RBC system has been extensively studied through experiments and simulations in recent decades (Grossmann & Lohse Reference Grossmann and Lohse2000, Reference Grossmann and Lohse2004; Ahlers, Grossmann & Lohse Reference Ahlers, Grossmann and Lohse2009; Lohse & Xia Reference Lohse and Xia2010; Chillà & Schumacher Reference Chillà and Schumacher2012; Lohse & Shishkina Reference Lohse and Shishkina2024). The investigation of RBC’s ultimate regime at ultra-high Rayleigh numbers has been significantly advanced by centrifugal convection (CC), in which the exceptionally strong centrifugal forces enable unique experimental access to this challenging regime (Jiang et al. Reference Jiang, Zhu, Wang, Huisman and Sun2020, Reference Jiang, Wang, Liu and Sun2022; Rouhi et al. Reference Rouhi, Lohse, Marusic, Sun and Chung2021; Wang et al. Reference Wang, Jiang, Liu, Zhu and Sun2022a
; Zhong, Wang & Sun Reference Zhong, Wang and Sun2023). The experimental results (Jiang et al. Reference Jiang, Wang, Liu and Sun2022) from CC systems confirm the predicted heat transfer scaling in the ultimate regime (Kraichnan Reference Kraichnan1962; Grossmann & Lohse Reference Grossmann and Lohse2000; Lohse & Shishkina Reference Lohse and Shishkina2024), with validation spanning more than an order of magnitude in Rayleigh number. Most remarkably, CC reaches the ultimate regime at a critical Rayleigh number (
 ${\textit{Ra}}_t \approx 10^{11}$
) that is two to three orders of magnitude lower than planar RBC. This fundamental shift in the transition Rayleigh number requires thorough investigation of its physical origins.
In contrast to classical RBC, CC imposes centrifugal acceleration to enhance buoyant driving while introducing two additional fundamental factors: rotational effects and the gravity perpendicular to the temperature gradient. In practical experimental configurations, both factors may influence flow structures and heat transfer characteristics. However, previous direct numerical simulations (DNS) of CC systems have conventionally employed periodic boundary conditions on the top/bottom surfaces, preventing the formation of rotation-dependent flow structures such as Ekman layers, Ekman pumping and Stewartson layers. This geometric confinement, when combined with gravitational exclusion, restricts flow development to the plane orthogonal to the rotation axis, manifesting quasi-two-dimensional characteristics that may exhibit fundamental deviations from the practical experimental situation. Recent DNS investigations by Yao et al. (Reference Yao, Emran, Teimurazov and Shishkina2025) on the gravitational effect in CC systems have demonstrated a clear flow regime transition: from centrifugal buoyancy-dominated horizontal flow organisation to gravitational buoyancy-dominated vertical convection with increasing gravity.
In CC experiments with strong rotation, the large Froude number (centrifugal force versus gravity) indicates a centrifugal-buoyancy-dominated system (Yao et al. Reference Yao, Emran, Teimurazov and Shishkina2025). However, the flow often maintains three-dimensional characteristics rather than becoming purely two-dimensional. Numerous studies of rotating RBC (RRBC) demonstrate that rotating systems develop distinct boundary layers at no-slip walls (Chandrasekhar Reference Chandrasekhar1953; Lucas, Pfotenhauer & Donnelly Reference Lucas, Pfotenhauer and Donnelly1983; Julien et al. Reference Julien, Legg, McWilliams and Werne1996; Vorobieff & Ecke Reference Vorobieff and Ecke2002; Kunnen Reference Kunnen2021; Ecke & Shishkina Reference Ecke and Shishkina2023): Ekman layers (perpendicular to the rotation axis) and Stewartson layers (parallel to the rotation axis) both play essential roles in heat transfer and flow structures. In RRBC, rotation increases the critical Rayleigh number for convection onset, and typically suppresses heat transport. However, when the Ekman layer (
 $\delta _E\sim {\textit{Ek}}^{1/2}$
) overlaps with the thermal boundary layer, Ekman pumping can enhance heat transfer in certain parameter ranges (Zhong et al. Reference Zhong, Stevens, Clercx, Verzicco, Lohse and Ahlers2009; Chong et al. Reference Chong, Wagner, Kaczorowski, Shishkina and Xia2018; Anas & Joshi Reference Anas and Joshi2024). Strong zonal flows are observed at vertical sidewalls, along with Stewartson layers of thickness
 $\delta _{\,\!\textit{st}}\sim {\textit{Ek}}^{1/3}$
(Kunnen et al. Reference Kunnen, Stevens, Overkamp, Sun, van Heijst and Clercx2011, Reference Kunnen, Clercx and van Heijst2013; Zhang et al. Reference Zhang, van Gils, Horn, Wedi, Zwirner, Ahlers, Ecke, Weiss, Bodenschatz and Shishkina2020, Reference Zhang, Ecke and Shishkina2021). The vertical flow in the Stewartson layer is considered as a balance to the flow into Ekman boundary layers induced by the interior anticyclonic circulation, but the origins of the flows are not well addressed (Kunnen, Clercx & Heijst Reference Kunnen, Clercx and van Heijst2013; Zhang, Ecke & Shishkina Reference Zhang, Ecke and Shishkina2021).
In contrast to RRBC, the rotational axis of the CC system is perpendicular to the temperature gradient and centrifugal acceleration. Consequently, the delay of convection onset is not expected in this configuration (Pitz, Marxen & Chew Reference Pitz, Marxen and Chew2017; Zhong, Li & Sun Reference Zhong, Li and Sun2024); Ekman layers are supposed to be developed on the sidewalls, and Stewartson layers are supposed to be developed at the thermal boundaries, forming a distinct boundary layer architecture. Three fundamental questions arise. Does the Stewartson layer physically persist in CC? What determines its strength magnitude? How does it modify heat transfer efficiency and reorganise global flow patterns? Additionally, does gravity influence vertical flow dynamics within this layer? These questions form the central focus of this investigation.
This study employs three-dimensional numerical simulations of CC with imposed gravity and no-slip top/bottom boundaries to systematically investigate the Stewartson layer in CC. The rest of the paper is organised as follows. The governing equations and set-up for DNS are presented in § 2, and the results of the sidewalls, gravity and rotation effects on the Stewartson layer are discussed in § 3 with theoretical explanations. Finally, the full paper is summarised in § 4.
2. Numerical model
The system schematic is shown in figure 1 using cylindrical coordinates
 $(r, \varphi , z)$
. It consists of two coaxial cylinders rotating at the same angular velocity
 $\varOmega$
, with a cold inner cylinder (
 $T_c$
) and hot outer cylinder (
 $T_h$
). Key geometric parameters are the inner radius (
 $R_i$
), outer radius (
 $R_o$
), annular gap width
 $L=R_o-R_i$
, and axial height
 $H$
. The fluid’s thermal expansion coefficient
 $\beta$
, kinematic viscosity
 $\nu$
, and thermal diffusivity
 $\kappa$
are treated as constant throughout the system. The dimensionless governing equations following the Oberbeck–Boussinesq assumption in a rotating reference frame of angular velocity
 $\varOmega$
read (Jiang et al. Reference Jiang, Zhu, Wang, Huisman and Sun2020, Reference Jiang, Wang, Liu and Sun2022; Zhong et al. Reference Zhong, Wang and Sun2023)
 \begin{align}&\qquad\qquad\qquad\qquad\qquad\qquad\qquad \boldsymbol{\nabla} \boldsymbol{\cdot }\boldsymbol{u}=0, \end{align}
 \begin{align}&\qquad\qquad\qquad\qquad\qquad \frac {\partial T}{\partial t}+\boldsymbol{\nabla} \boldsymbol{\cdot } (\boldsymbol{u}T)=\frac {1}{\sqrt {{\textit{Ra}}_r\,\textit{Pr}}}\,{\nabla} ^2T, \end{align}
 \begin{align}& \frac {\partial \boldsymbol{u}}{\partial t}+\boldsymbol{u\boldsymbol{\cdot }\boldsymbol{\nabla }u}=- \boldsymbol{\nabla }{p}-{Ro}^{-1}\boldsymbol{\hat {e_z}}\times \boldsymbol{u} +\sqrt {\frac {\textit{Pr}}{{\textit{Ra}}_r}}\boldsymbol{\nabla} ^2\boldsymbol{u}-\frac {2(1-\eta )}{(1+\eta )}rT\boldsymbol{\hat {e_r}}+\frac {{\textit{Ra}}_g}{{\textit{Ra}}_r}T\boldsymbol{\hat {e_z}}, \end{align}
Schematic of the CC system. The cylindrical annular chamber with inner and outer radii
 $R_i,R_o$
and height
 $H$
rotates about the vertical axis with angular velocity
 $\varOmega$
. The centrifugal acceleration
 $\varOmega ^2 r$
acts radially, while gravity
 $g$
acts axially, driving convection between the cold inner surface (
 $T_c$
) and hot outer surface (
 $T_h$
). No-slip boundary conditions are applied at all walls.

where
 $\boldsymbol{u}=(u,v,w)$
,
 $T$
and
 $p$
represent the velocity, temperature and pressure fields, respectively, with
 $\boldsymbol{\hat {e_r}}$
and
 $\boldsymbol{\hat {e_z}}$
being the unit vectors in the radial and axial directions. The quantities are non-dimensionalised using the radial free-fall velocity
 $U=\sqrt {g_r\beta \Delta L}$
, the gap width
 $L$
, and the temperature difference
 $\varDelta$
, where
 $g_r=\varOmega ^2(R_i+R_o)/2$
represents the equivalent gravitational acceleration due to centrifugal rotation. The governing equations introduce four key dimensionless parameters: the centrifugal and gravitational Rayleigh numbers (
 ${\textit{Ra}}_r$
,
 ${\textit{Ra}}_g$
), the inverse Rossby number (
 $Ro^{-1}$
), and the Prandtl number (
 ${\textit{Pr}}$
), defined as
 \begin{align} &{\textit{Ra}}_r=g_r\beta \Delta L^3/(\nu \kappa ),\quad {\textit{Ra}}_g=g\beta \Delta L^3/(\nu \kappa ),\nonumber \\ &{\textit{Ro}}^{-1}=2 \varOmega L/U=2(\beta \Delta (R_o+R_i)/(2L))^{-1/2},\quad \textit{Pr}=\nu /\kappa. \end{align}
We introduce the inverse Froude number (
 ${\textit{Fr}}^{-1}$
) to characterise the relative strength of the gravitational acceleration and the centrifugal acceleration. It is defined as
 \begin{equation} {\textit{Fr}}^{-1} = g/g_r = {\textit{Ra}}_g/{\textit{Ra}}_r. \end{equation}
In this definition, gravity can be regarded as a disturbance to the centrifugal effect. When
 ${\textit{Fr}}^{-1} \ll 1$
is satisfied, the influence of gravity on the main flow structure and the heat transfer can be neglected (Liu et al. Reference Liu, Lai, Zhong and Ren2025). Additionally, in subsequent discussions, we will utilise the Ekman number (
 $Ek$
) to facilitate comparison with previous studies. It is important to clarify that the Ekman number introduced herein serves solely to support the analysis of flow behaviours, rather than substituting for the originally defined control parameters. It is defined as
 \begin{equation} Ek=\nu /(\varOmega H^2). \end{equation}
In this system with aspect ratio
 $\varGamma =H/L$
, it has the following relation with
 ${\textit{Ra}}_r$
,
 ${\textit{Pr}}$
and
 $Ro^{-1}$
:
 \begin{equation} Ek=\sqrt {\frac {\textit{Pr}}{{\textit{Ra}}_r}}\frac {2}{Ro^{-1}}\varGamma ^{-2}. \end{equation}
In our simulations, the Prandtl number is fixed at
 $Pr=4.3$
, alongside the geometry parameters, including the radius ratio
 $\eta =R_i/R_o=0.5$
and aspect ratio
 $\varGamma =H/L=1$
. In particular, with
 $L=R_o-R_i$
as the characteristic length, the dimensionless radius of the inner cylinder and the dimensionless radius of the outer cylinder are
 \begin{equation} r_i =R_i/L=\eta /(1-\eta ),\quad r_o =R_o/L=1/(1-\eta ). \end{equation}
In the present study, since
 $\eta$
is fixed at 0.5, the dimensionless inner and outer ring radii are 1 and 2, respectively. The no-slip and isothermal boundary conditions are applied for the inner and outer cylinders, whereas the no-slip and adiabatic boundary conditions are applied for the top and bottom covers. Considering the computational cost and the symmetry of convection vortices distribution, a quarter-circle is adopted as the computational domain in all the cases (Wang et al. Reference Wang, Jiang, Liu, Zhu and Sun2022a
). Details about the simulations can be found in Appendix A.
3. Results and discussion
3.1. Effect of sidewalls (top and bottom lids)
Based on previous studies, when gravity is neglected and the periodic boundary conditions are used for the top and bottom surfaces, the strong rotation tends to suppress vertical variation of the convection flow (Jiang et al. Reference Jiang, Zhu, Wang, Huisman and Sun2020; Wang et al. Reference Wang, Jiang, Liu, Zhu and Sun2022a ; Zhong et al. Reference Zhong, Wang and Sun2023). This phenomenon can be attributed to the fact that the effect of the Coriolis force on the motion of a rotating fluid follows the Taylor–Proudman theorem, which results in a flow in a rotating vessel that is approximately quasi-two-dimensional. However, if there are top and bottom plates (lids) in the system, then the presence of mechanical friction at the top and bottom walls will restrict the movement of the fluid, thus changing the pressure at the boundaries, and creating a pressure difference with the body region. This results in the formation of vortices, and will exert a significant influence on the flow structure(Wedemeyer Reference Wedemeyer1964; Zhemin & Yuan Reference Zhemin and Yuan2002; Holton Reference Holton2004).
Figure 2(a) displays the contour plot of the instantaneous radial velocity on the
 $r{-}\varphi$
plane with no-slip boundary conditions applied to the top and bottom plates. The methodology for selecting the plane is illustrated in figure 2(b), where the inner circular ring coincides with the inner cylinder, and the outer circular ring corresponds to the outer cylinder. The black curves in figure 2(a) denote the typical streamlines of the convective vortices. Four pairs of convective vortices throughout the azimuthal direction are formed by the hot and cold plumes, which are detached from the thermal boundary layer and driven by centrifugal acceleration. Despite the effects of geometric curvature and Coriolis forces, the flow structure of convection remains highly similar to the classical RBC. The effect of the geometric curvature on the zonal flow and heat transfer in the CC system has been explored in detail in Wang et al. (Reference Wang, Jiang, Liu, Zhu and Sun2022a
).
(a) The contour indicates the instantaneous radial velocity component
 $u$
for
 ${\textit{Ra}}_r = 10^8,\ {\textit{Ra}}_g=0$
and
 $Ro^{-1} = 23.9$
. The black curves denote the typical streamlines, and the arrows represent the flow direction. Note that a quarter-circle is adopted as the computational domain here, and the complete circumference is drawn to match the schematic diagram. (b) The schematic diagram of the two types of planes selected in the system. (c) The contour indicates temporal and azimuthal averages of the radial velocity component
 $u$
for
 ${\textit{Ra}}_r = 10^7,\ {\textit{Ra}}_g=0$
and
 $Ro^{-1} = 23.9$
. The black curves denote the typical streamlines, and the arrows represent the flow direction. (d) For
 ${\textit{Ra}}_g=0$
, the temporally and azimuthally averaged radial velocity r.m.s. profile in the vertical direction at
 $ r=1.5$
. Dashed lines and solid lines of the same colour represent the radial velocities under periodic boundary conditions and no-slip boundary conditions (applied to the top and bottom plates), respectively, for the same set of control parameters. The distance between the maximum radial velocity and the bottom plate is the thickness of the Ekman layer
 $\delta _{Ek}$
(grey dashed line). The inset shows the same data near the bottom plate. (e) The thickness of the Ekman layer
 $\delta _{Ek}$
varies with
 $Ek$
.

Figure 2(c) presents the time and azimuthally averaged radial velocity. The approach for plane selection is also demonstrated in figure 2(b), with the left-hand side of the panel (
 $r = 1$
) coinciding with the inner cylinder, and the right-hand side (
 $r = 2$
) corresponding to the outer cylinder. It can be seen from the figure that with no-slip boundary conditions imposed on the top and bottom plates, the flow transitions from a quasi-two-dimensional state (Jiang et al. Reference Jiang, Zhu, Wang, Huisman and Sun2020) to a three-dimensional regime due to the viscous effects of the top and bottom boundary, and the Ekman layer is observed. When the horizontal flows in the system meet the boundary, including the thermal plumes and zonal flow, the friction loss on the boundary leads to a vertical pressure gradient, and this Ekman pumping effect leads to vertical vortices (Lappa Reference Lappa2012; Davidson Reference Davidson2013). This secondary flow is also similar to the generation of the vertical vortex when a cup of tea is stirred (Holton Reference Holton2004). In our system, the streamlines in figure 2(c) show that four vortex structures are formed in the
 $r{-}z$
plane.
In figure 2(d), dashed lines and solid lines of the same colour represent the root mean square (r.m.s.) radial velocities under periodic boundary conditions and no-slip boundary conditions (applied to the top and bottom plates), respectively, for the same set of control parameters. It can be observed that near the top and bottom walls, the radial velocity under no-slip boundary conditions is smaller than that under periodic boundary conditions. This confirms the influence of the boundary friction on the bulk velocity. We define the thickness of the Ekman layer (
 $\delta _{Ek}$
) as the distance between the time and azimuthally r.m.s.-averaged radial velocity maximum and the wall near the bottom plate. Its thickness follows
 $\delta _{Ek}\sim {\textit{Ek}}^{1/2}$
, as shown in figure 2(e), agreeing with the supposed effect of rotation.
3.2. Effect of gravity
To quantify the degree of flow three-dimensionalisation under no-slip boundary conditions on the top and bottom walls, figure 3 illustrates the four contour plots of time and azimuthally averaged vertical velocity
 $\langle w\rangle _{t,\varphi }$
with increasing gravity strength at fixed
 ${\textit{Ra}}_r$
and
 $Ro^{-1}$
. Interestingly, as the imposed gravity increases, the vertical flow structure undergoes a significant transition, though its velocity magnitudes remain orders of magnitude weaker than the dominant horizontal convective motions.
Contours indicate temporal and azimuthal averages of the velocity components
 $w$
for
 ${\textit{Ra}}_r = 10^7$
and
 $Ro^{-1} = 23.9$
. The black curves are representative flow lines, and the arrows represent the flow direction. Results for (a)
 ${\textit{Ra}}_g = 0$
, (b)
 ${\textit{Ra}}_g = 10^4$
, (c)
 ${\textit{Ra}}_g = 10^5$
and (d)
 ${\textit{Ra}}_g = 10^6$
, respectively. Each panel is selected in the same manner as shown in figure 2(b).

When the cover plates exist, the secondary flow (the primary flow is the RBC rolls on the
 $r{-}\varphi$
plane) within the bulk region is approximately divided into four vortices of weak vertical velocity (
 $w\sim 10^{-4}$
), which can be shown clearly by the streamlines in figure 3(a). The reasons for the formation of this flow structure have been discussed in § 3.1: the weak secondary flow structures arise from vertical pressure gradients induced by boundary layer friction, where viscous dissipation at the confining walls modifies the momentum transport balance in near-wall regions. For systems with weak gravitational forcing (
 ${\textit{Ra}}_g\leqslant 10^4$
), the main structure of the secondary flow remains consistent with the zero-gravity case, as shown in figure 3(b). As
 ${\textit{Ra}}_g$
increases to
 $10^5$
, the flow undergoes a symmetry-breaking transition, developing two elongated vortices close to the inner and outer walls. At higher
 ${\textit{Ra}}_g$
, these vortices merge into distinct shear layers near the sidewalls, called the Stewartson layer (figure 3
d) (Kunnen et al. Reference Kunnen, Stevens, Overkamp, Sun, van Heijst and Clercx2011; Ecke & Shishkina Reference Ecke and Shishkina2023).
Interestingly, during the formation of the Stewartson layer, the system stays in CC dominance as
 ${\textit{Fr}}^{-1}\lt 1$
(Yao et al. Reference Yao, Emran, Teimurazov and Shishkina2025). Compared to the main flow of convection, the secondary flow is weak but structurally clear. The Stewartson layer is formed and grows without significant changes of the main flow across different
 ${\textit{Ra}}_g$
, which is different to the formation of the Stewartson layer in the RRBC system, where the formation is attributed to the bulk-driven circulation (Kunnen et al. Reference Kunnen, Stevens, Overkamp, Sun, van Heijst and Clercx2011, Reference Kunnen, Clercx and van Heijst2013). It can be inferred that the formation cause of the Stewartson layer in our system is more relevant to the gravity strength, and may not be identical to that observed in the RRBC system.
To further investigate the characteristics and the formation of the Stewartson layer, we explore the influence of gravity on the configuration of the Stewartson layer at a fixed
 ${\textit{Ra}}_r$
, and the results are shown in figure 4. The radial distribution of the averaged vertical velocity
 $w$
at
 $z=H/2$
is used to characterise the configuration of the Stewartson layer. The original profiles are displayed in figure 4(a), and the normalised ones are displayed in figure 4(b). The radial distribution of mean vertical velocity exhibits consistent trends across varying
 ${\textit{Ra}}_g$
, with the velocity zero-crossing points aligning closely between cases. Normalised velocity profiles further demonstrate that the shape of vertical velocity profiles is gravity-independent when the inverse Froude number is relatively small, as profiles collapse to a single curve. However, a clear divergence exists between the curves for
 ${\textit{Fr}}^{-1} \gt 2$
and
 ${\textit{Fr}}^{-1} \leqslant 2$
.
(a) The temporal and azimuthal averages of the velocity component
 $w$
in the radial direction at
 $z = H/2$
for
 ${\textit{Ra}}_r = 10^7$
and
 $Ro^{-1} = 23.9$
. When
 ${\textit{Ra}}_g$
increases from
 $10^5$
to
 $10^8$
,
 ${\textit{Fr}}^{-1}$
gradually rises from 0.01 to 10. (b) The same data of vertical velocity for
 $1 \leqslant r \lesssim 1.5$
normalised by maximum velocity, and the radial coordinates are normalised by the thickness of the Stewartson layer. (c) For
 ${\textit{Ra}}_g = 10^7,\ {\textit{Ra}}_r = 10^7$
and
 $Ro^{-1} = 23.9$
, the time and azimuthally averaged vertical velocity profile in the radial direction at
 $z = H/2$
; the amplitude
 $W_{\,\!\textit{st}}$
is defined as the first peak of the absolute velocity maximum (red dashed line), and the thickness of the Stewartson layer
 $\delta _{\,\!\textit{st}}$
is defined as the distance from the first peak to the closest boundary (yellow dashed line). The inset shows the same data near the inner cylinder.

Previous studies have explored this transition process in detail (Liu et al. Reference Liu, Lai, Zhong and Ren2025). In the CC system, the influence of the Froude number on the flow structure is mainly reflected in the evolution of the direction of large-scale circulation (LSC) and the vertical velocity. Gravity dominates at large
 ${\textit{Fr}}^{-1}$
, and a strong vertical LSC is formed, showing characteristics similar to vertical natural convection. When
 $0.2 \lt {\textit{Fr}}^{-1} \lt 5$
, the system is in a force balance region, centrifugal force weakens the vertical buoyancy driving, LSC shifts from vertical to horizontal direction, its intensity decreases accordingly, and the flow transitions to horizontal dominance. When
 ${\textit{Fr}}^{-1}$
decreases further, centrifugal force dominates, axial flow is weak, horizontal LSC becomes dominant, Taylor columns are formed, and the system shows the characteristics of classical RBC.
According to figure 4(b), we do not employ a strictly uniform interval division. Instead, the system is approximately divided into two regimes: the gravity-dominated regime (
 ${\textit{Fr}}^{-1} \gt 2$
, dashed lines) and the centrifugal-dominated regime (
 ${\textit{Fr}}^{-1} \leqslant 2$
, solid lines). These results indicate that the mechanism of the Stewartson layer’s structure remains consistent in centrifugal-dominated regimes, where increased gravity solely modulates flow magnitude. However, as gravitational forcing transitions into dominance, the dynamics governing the layer’s configuration becomes progressively modified.
Considering that the velocity zero-crossing points in figure 4(a) align closely between different cases, it appears that the thickness of the Stewartson layer does not change with
 ${\textit{Ra}}_g$
. To verify this observation, we need to quantify the thickness of the Stewartson layer. Referring to other articles about RRBC (Kunnen et al. Reference Kunnen, Clercx and van Heijst2013), as shown in figure 4(c), we define the time and azimuthally averaged vertical velocity maximum (absolute value) as the amplitude (
 $W_{\,\!\textit{st}}$
) and its distance to the wall as the thickness of the Stewartson layer (
 $\delta _{\,\!\textit{st}}$
). Here,
 $W_{\,\!\textit{st}}$
will be used to characterise the strength of the vertical velocity. Following these definitions, we further plot the velocity amplitude and the thickness of the Stewartson layer as a function of
 ${\textit{Ra}}_g$
in figure 5. The centrifugal and gravitational dominance cases are marked by the hollow and solid points, respectively. Surprisingly, we can see that the vertical velocity amplitude in the Stewartson layer follows the scaling
 $W_{\,\!\textit{st}}\sim {\textit{Ra}}_g$
extremely well within the centrifugal dominance regime, among different parameter sets of
 ${\textit{Ra}}_r$
and
 $Ro^{-1}$
from figure 5(a). Besides, as shown in figure 5(b), the thickness of the Stewartson layer remains nearly constant for
 ${\textit{Fr}}^{-1} \leqslant 2$
, consistent with our previous findings: the gravity controls the velocity amplitude and has no effect on the shape of the layer’s profile. Meanwhile, some discrepancies in velocity amplitude and layer thickness emerge under gravity-dominated conditions, likely resulting from the shift in primary flow dynamics between Rayleigh–Bénard and vertical convection regimes.
(a) The maximum velocity
 $W_{\,\!\textit{st}}$
and (b) the thickness of the Stewartson layer
 $\delta _{\,\!\textit{st}}$
vary with
 ${\textit{Ra}}_g$
. The centrifugal and gravitational dominance cases are marked by the hollow and solid points, respectively.

3.3. Effect of rotation
Having examined the impact of gravity on the system, we now turn our attention to the effects of rotation on the Stewartson layer. In the RRBC system, the Stewartson boundary layer is found to consist of a sandwich structure of two boundary layers of typical thicknesses
 ${\textit{Ek}}^{1/3}$
and
 ${\textit{Ek}}^{1/4}$
(Kunnen et al. Reference Kunnen, Clercx and van Heijst2013). According to the definition of Ekman number (see (2.7)), we maintain a constant value for
 ${\textit{Ra}}_g$
while varying
 ${\textit{Ra}}_r$
, and the effect of the inverse Rossby number
 $Ro^{-1}$
is also checked.
Figure 6(a) illustrates the radial distribution of the averaged vertical velocities, and the normalised profiles are presented in figure 6(b). From figure 6(a), the positions of the maximum velocities differ from each other, indicating that
 ${\textit{Ra}}_r$
affects both the thickness of the boundary layer and the strength of internal flow. Meanwhile, the shape of the profiles remains consistent in the centrifugal dominance regime (
 ${\textit{Fr}}^{-1} \leqslant 2$
), as shown in the normalised profiles. The dashed lines denote gravity-dominated flows (
 ${\textit{Fr}}^{-1} \gt 2$
). Their inner-layer profiles align closely with centrifugally dominant curves, whereas the outer layer exhibits marked deviation. This divergence likely arises from stronger coupling between the secondary flow and bulk flow dynamics.
(a) The temporal and azimuthal averages of the velocity components
 $w$
in the radial direction at
 $z = H/2$
for
 ${\textit{Ra}}_g = 10^7$
and
 $Ro^{-1} = 23.9$
. When
 ${\textit{Ra}}_r$
increases from
 $10^6$
to
 $10^8$
,
 $Fr$
gradually decreases from 10 to 0.1. (b) The same data of vertical velocity for
 $1 \leqslant r \lesssim 1.5$
normalised by maximum velocity, and the radial coordinates are normalised by the thickness of the Stewartson layer. (c) Profiles of vertical velocity near the sidewall at height
 $z = H/2$
, from DNS (solid lines) and theory (dashed lines). Theoretical formulae are derived from Kunnen’s ideal model (Kunnen et al. Reference Kunnen, Clercx and van Heijst2013).

In addition to this, we compared the results of the simulation with the theoretical model proposed by Kunnen et al. (Reference Kunnen, Clercx and van Heijst2013). Kunnen simplified the governing equations of the RRBC system, and derived a theoretical solution of vertical velocity by introducing three key assumptions: first, viscous effects are negligible except in regions near the walls; second, a time-independent and azimuthally uniform mean circulation pattern exists; and third, the Rossby number (
 $Ro$
) is negligibly small. With the velocity magnitude being the only fitted quantities, we apply Kunnen’s theoretical solutions to our mean vertical velocity profiles at two different parameter sets, and the results are shown in figure 6(c). Analytically derived profiles closely match simulated velocity distributions in near-wall regions. Mismatches emerge at radial positions farther from the sidewalls, possibly due to the influence of bulk flow. This finding also suggests that the dynamic velocity boundary layer of the secondary flow near the sidewall within our system is the same as the Stewartson layer observed in the RRBC system, and the local flow structure shares analogous characteristics.
We further quantitatively analysed the effect of rotation on the features of the Stewartson layer, including the flow strength and the layer thickness defined by the first vertical velocity peak near the surface, and the results of different parameter sets
 $\{{\textit{Ra}}_g, Ro^{-1}\}$
are shown in figure 7. It should be emphasised that when investigating the influence of rotation, the control parameter that we use to characterise the rotational intensity is always
 ${\textit{Ra}}_r$
. We adopt
 $Ek$
as the abscissa in figure 7 for the assistance of the rotational physics and better comparisons with the relevant studies (Kunnen et al. Reference Kunnen, Clercx and van Heijst2013). For the thickness shown in figure 7(b), all the data across varying
 $\{{\textit{Ra}}_r, {\textit{Ra}}_g, Ro^{-1}\}$
collapse onto the scaling
 $\delta _{\,\!\textit{st}}\sim {\textit{Ek}}^{1/3}$
, demonstrating that the Ekman number exclusively governs the thickness of the inner Stewartson layer in our system. This result is also consistent with previous studies on rotating flow (Herrmann & Busse Reference Herrmann and Busse1993; Kunnen et al. Reference Kunnen, Stevens, Overkamp, Sun, van Heijst and Clercx2011; Zhang et al. Reference Zhang, van Gils, Horn, Wedi, Zwirner, Ahlers, Ecke, Weiss, Bodenschatz and Shishkina2020, Reference Zhang, Ecke and Shishkina2021). In RRBC, there exists a unique wall mode with a typical two-layer structure near the sidewall, which is a concept under linear stability analysis, from which eigenfunctions of vertical velocity in the system can be derived (Zhang et al. Reference Zhang, Reiter, Shishkina and Ecke2024). Wall modes of both RRBC and the Stewartson layer are rotation-regulated boundary layers with consistent scaling laws and similar vertical velocity radial profiles. Meanwhile, there are also a lot of differences between the CC and RRBC systems in temperature boundary conditions, dominant bulk flow and gravitational influence. Though the different boundary conditions and gravity settings give rise to a wide diversity of flow phenomena, their core physical mechanisms may remain consistent. In addition, the outer layer with thickness
 ${\textit{Ek}}^{1/4}$
is not observed in our simulation yet, which may be affected by the bulk flow dynamics.
(a) The maximum velocity
 $W_{\,\!\textit{st}}$
and (b) the thickness of the Stewartson layer
 $\delta _{\,\!\textit{st}}$
varies with
 $Ek$
. Cases under centrifugal dominance and gravitational dominance are marked as hollow and solid points, respectively.

As for the flow strength, figure 7(a) shows that the velocity amplitude satisfies a scaling law
 $W_{\,\!\textit{st}}\sim {\textit{Ek}}^{5/3}$
, while it is also influenced by both
 ${\textit{Ra}}_g$
and
 $Ro^{-1}$
. A close scaling law following
 ${\textit{Ek}}^{1.8}$
is also observed in the previous study on the RRBC system (Kunnen et al. Reference Kunnen, Clercx and van Heijst2013), and we will explain the mechanism behind this in the theoretical analysis section.
In addition to the definition of boundary layer thickness adopted in this study (as shown in figure 4(c), where
 $\delta _{\,\!\textit{st}}$
is defined as the distance from the wall to the first peak of the time and azimuthally averaged vertical velocity), alternative definitions in the literature include using the distance from the wall to the local peak of the r.m.s. vertical velocity, and applying the slope method to determine the boundary layer thickness (Kunnen, Geurts & Clercx Reference Kunnen, Geurts and Clercx2010; Gastine, Wicht & Aurnou Reference Gastine, Wicht and Aurnou2015; Zhang et al. Reference Zhang, van Gils, Horn, Wedi, Zwirner, Ahlers, Ecke, Weiss, Bodenschatz and Shishkina2020). For reference, Appendix C includes the boundary layer thickness values obtained via the ‘r.m.s. averaging + slope method’ definition, as well as the variation of
 $W_{\,\!\textit{st}}$
with the Ekman number.
3.4. Theoretical explanation
Through previous analyses of the simulation results, we find that both rotational forcing (
 $Ek$
) and vertical gravity (
 ${\textit{Ra}}_g$
) exert dominant control over the Stewartson layer dynamics. The Ekman number governs the configuration with an inner layer thickness
 $\delta _{\,\!\textit{st}}\sim {\textit{Ek}}^{1/3}$
, while the combined influence of
 $Ek$
and
 ${\textit{Ra}}_g$
governs the internal flow strength
 $W_{\,\!\textit{st}}\sim {\textit{Ra}}_g\,{\textit{Ek}}^{5/3}$
. Whereas the role of
 $Ek$
aligns with well-established scaling laws in rotating flows and RRBC systems, the explicit dependence on vertical gravity seems to emerge as a newly identified mechanism. In the RRBC system, the gravity exerts a global influence on large-scale convection, with its effects inherently hardly decoupling. However, in the CC system dominated by centrifugal force, the primary flow structure holds on the horizontal
 $r{-}\varphi$
plane, which offers a great opportunity to study the effect of
 ${\textit{Ra}}_g$
.
Based on our findings, the Stewartson boundary layer is formed only when the vertical gravity exists and the flow strength is proportional to the gravitational intensity. Therefore, we have a new assumption: the internal vertical flow inside the Stewartson layer is induced by the vertical buoyancy, and the vertical velocity that we measure in the mid-plane acts as a terminal velocity (Griffiths & Campbell Reference Griffiths and Campbell1990; Cagney et al. Reference Cagney, Newsome, Lithgow-Bertelloni, Cotel, Hart and Whitehead2015). Hence there exists a force balance between viscosity and buoyancy in the vertical momentum equation insides the inner Stewartson layer, i.e.
 \begin{equation} \nu\, {\nabla} ^2w^*\sim \beta g\,\delta T^*, \end{equation}
where
 $w^*$
and
 $\delta T^*$
are dimensional vertical velocity and temperature difference. Considering the fact that in our simulations, the Stewartson layer is always inside the thermal boundary layer, we assume that
 $\delta T^*$
is of the order of the global temperature difference
 $\varDelta$
. Using the same quantity scales as the governing equation (2.3), we have
 \begin{equation} \sqrt {\frac {\textit{Pr}}{{\textit{Ra}}_r}}\,{\nabla} ^2w\sim \frac {{\textit{Ra}}_g}{{\textit{Ra}}_r}. \end{equation}
As demonstrated in figures 4 and 6, the distribution of the normalised mean vertical velocity along the radial direction in the buoyancy dominant regime exhibits a similar configuration, and
 ${\textit{Ek}}^{1/3}$
is the radial characteristic scale. Hence we take the maximum vertical velocity
 $W_{\,\!\textit{st}}$
:
 \begin{equation} {\nabla} ^2w\sim {\textit{Ek}}^{-2/3}\,W_{\,\!\textit{st}}. \end{equation}
Equations (3.2) and (3.3) can be combined to obtain
 \begin{equation} W_{\,\!\textit{st}}\sim ({\textit{Ra}}_r\,\textit{Pr})^{-1/2}\,{\textit{Ek}}^{2/3}\,{\textit{Ra}}_g. \end{equation}
Based on the relation between
 $Ek$
and
 ${\textit{Ra}}_r$
,
 $Ro^{-1}$
(shown in (2.7)),
 ${\textit{Ra}}_r$
can be cancelled, and we finally get the scaling of
 $W_{\,\!\textit{st}}$
:
 \begin{equation} W_{\,\!\textit{st}}\sim {\textit{Ek}}^{5/3}\,{\textit{Ro}}^{-1}\,{\textit{Ra}}_g\,{\textit{Pr}}^{-1}\,\varGamma ^2. \end{equation}
Surprisingly, both scaling laws
 $W_{\,\!\textit{st}}\sim {\textit{Ek}}^{5/3}$
and
 $W_{\,\!\textit{st}}\sim {\textit{Ra}}_g$
arise in the viscosity–buoyancy balance. Furthermore, following our theoretical results, we check the relation between normalised vertical velocity
 $W_{\,\!\textit{st}}/({\textit{Ra}}_g\,Ro^{-1})$
with
 $Ek$
, and the results are presented in figure 8. It is clear that all the data points collapse onto the single line with the predicted scaling, in perfect agreement with the derived equation (3.5).
The maximum velocity
 $W_{\,\!\textit{st}}$
normalised by
 ${\textit{Ra}}_g\,Ro^{-1}$
varies with
 $Ek$
. There is a clear scaling law
 $W_{\,\!\textit{st}}/({\textit{Ra}}_g\,Ro^{-1}) \sim {\textit{Ek}}^{5/3}$
. Cases under centrifugal dominance and gravitational dominance are marked as hollow and solid points, respectively.

As for the data points in the gravity-dominated regime (solid points), deviations from the theoretical curve are observed. When gravity fully dominates, the system turns to vertical convection. The thermal flow near the boundary layer is undergoing an accelerated process by buoyancy, and the vertical velocity gradually approaches the free-fall velocity:
 \begin{equation} w\sim \sqrt {\beta \Delta gH}\sim {\textit{Ra}}_g^{1/2}. \end{equation}
This result is consistent with the scaling law in laminar vertical convection (Shishkina Reference Shishkina2016), taking place when
 ${\textit{Ra}}_g\gg {\textit{Ra}}_r$
(
 ${\textit{Fr}}^{-1}\gg 1$
). Although our simulations have not touched that parameter region, it is still observed that the velocity deviates downwards from the predicted value, in agreement with the decreasing scaling exponent on
 ${\textit{Ra}}_g$
.
The theory provides a satisfactory explanation of the results found above about
 $W_{\,\!\textit{st}}$
. We recognise that the Stewartson boundary layer in CC is generated by gravitational buoyancy and shaped by the geostrophic balance of rotation.
4. Conclusion
In this paper, we study the secondary flow structure in a more realistic CC system with the bottom and top plates (lids) and gravity. With the boundary confinement, the Ekman layer is observed on the bottom and top surfaces, while the Stewartson layer is observed beyond a critical gravitational forcing. As gravity increases, the initial top–bottom symmetric quadrupolar vortex structure is broken, and two elongated vortex structures evolve near the inner and outer sidewalls, and form the Stewartson layers. Furthermore, we performed a comprehensive analysis of the characteristics of the Stewartson layers, including the typical vertical velocity profiles, the internal flow strength, and the layer thickness
 $\delta _{\,\!\textit{st}}$
. It is found that the vertical velocity profiles hold the same shape after normalisation, in line with Kunnen’s theoretical solutions. Quantitative analyses confirm that the thickness of the Stewartson layer is governed by the rotation effect with
 $\delta _{\,\!\textit{st}}\sim {\textit{Ek}}^{1/3}$
, and the flow strength is jointly modulated by both rotation and gravitational buoyancy through the composite scaling
 $W_{\,\!\textit{st}}\sim {\textit{Ra}}_g\,{\textit{Ek}}^{5/3}$
. Moreover, as the gravitational buoyancy increases to dominance, the change of primary flow structure modifies the Stewartson boundary, inducing a departure from centrifugally dominated scaling laws.
Based on our findings, we demonstrate that the vertical flow inside the Stewartson layer is induced by the gravitational buoyancy, and eventually reaches a terminal state with the balance between viscosity and buoyancy. Meanwhile, we establish that the length scale of the Stewartson layer is determined only by the Ekman number as
 ${\textit{Ek}}^{1/3}$
. From these judgements, we derived a theoretical model, which predicts that the vertical velocity amplitude satisfies
 $W_{\,\!\textit{st}}\sim {\textit{Ek}}^{5/3}\,Ro^{-1}\,{\textit{Ra}}_g\,Pr^{-1}$
. There is remarkably good agreement between the theory and the simulation results across varying
 ${\textit{Ra}}_r$
,
 ${\textit{Ra}}_g$
and
 $Ro^{-1}$
, confirming that in the CC system, the Stewartson layer is induced by the gravity and constrained by the geostrophic balance of rotation.
The present study primarily focuses on the vertical mean flow as the key indicator for characterising the Stewartson layer. However, the gravitational and rotational effects on the other two velocity components may also play significant roles: the radial velocity is closely linked to convective heat transfer mechanisms, while the azimuthal velocity influences boundary layer morphology. Their mean flow and fluctuation statistics warrant detailed investigation in future studies. Nevertheless, the impact of the Stewartson layer on heat transport remains unclear. In Appendix B, we present the variation of the Nusselt number (
 ${\textit{Nu}}$
) under different boundary conditions and gravitational Rayleigh numbers (
 ${\textit{Ra}}_g$
). No significant changes in heat transfer are observed within the current parameter range, suggesting the need for further investigation. Due to computational constraints, our simulations are limited to
 ${\textit{Ra}}_r = 10^9$
, which does not reach the ultimate regime. Future large-scale simulations at higher
 ${\textit{Ra}}_r$
values – if computationally feasible – could help to determine whether the Stewartson layer influences the viscous boundary layer transition and facilitates the onset of the ultimate regime.
Acknowledgements
We thank D. Lohse and O. Shishkina for insightful discussions.
Funding
This work was supported by the NSFC Excellence Research Group Programme for ‘Multiscale problems in nonlinear mechanics’ (no. 12588201), and the New Cornerstone Science Foundation through the New Cornerstone Investigator Program and the XPLORER prize.
Declaration of interests
The authors report no conflict of interest.
Appendix A. Numerical details
Our code is a further development of the open-source program AFiD for the classical RBC thermal convection system, where the effects of Coriolis force, gravity and centrifugal buoyancy are considered in the new system. The meshing is done using a staggered grid, while the second-order central difference treats the spatial derivative terms, and the time-derivative terms are treated by the third-order stepwise Runge–Kutta method combined with the Crank–Nicolson implicit terms. The Courant–Friedrichs–Lewy (CFL) number is set to a maximum of 0.8 to ensure the temporal stability of the explicit format terms during integration (Courant, Friedrichs & Lewy Reference Courant, Friedrichs and Lewy1928). In general, the flow state reaches statistical stability after more than 150 dimensionless times of simulation, followed by more than 350 dimensionless times of simulation for data collection for the sake of statistics.
Previous studies have shown that the flow field in a CC system is periodic in the circumferential direction, and it is possible to halve the circumferential simulation region from a full circumference or even take only a quarter circumference to reduce the computational effort. By ensuring that at least one pair of convective vortices is included in the computational domain, the Nusselt number
 ${\textit{Nu}}$
and turbulence structure obtained will be similar to those obtained by taking the full circumference, and will not affect the subsequent studies (Wang et al. Reference Wang, Jiang, Liu, Zhu and Sun2022a
).
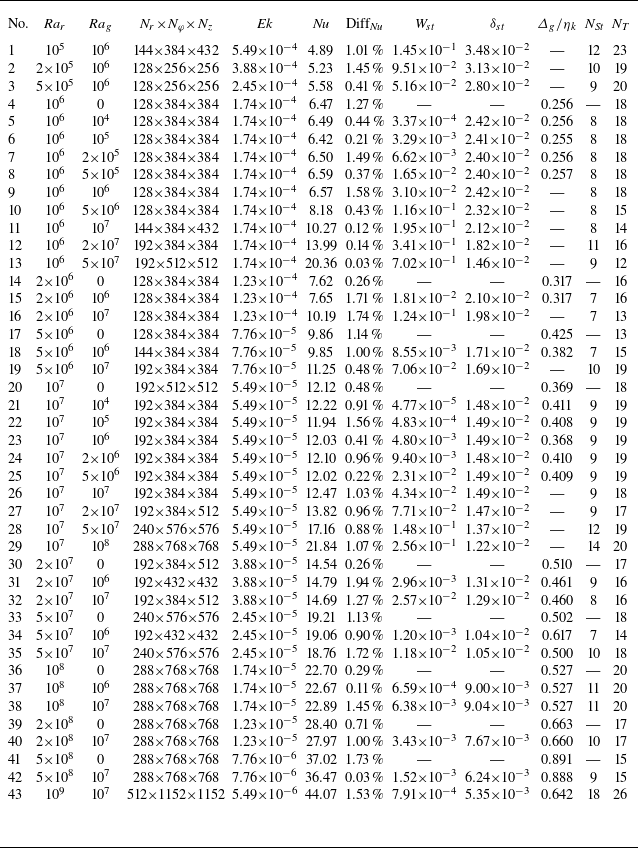
Therefore, we also compared the Nusselt numbers and the thicknesses of the Stewartson layer, as well as the magnitudes calculated for full, half and quarter circles, as shown in the first three rows of table 1. It can be seen that when changing the size of the selected circumference, the relative deviation of the results obtained for the half and quarter circles is negligible, around
 $3.5\,\%$
, if the
 ${\textit{Nu}}$
,
 $\delta _{\,\!\textit{st}}$
and
 $W_{\,\!\textit{st}}$
values calculated for the full circle are used as standard values. This is within the acceptable error range, showing that the simulation of partial circumferences along the circumference will not affect our subsequent research. What is more, we also verified the effect of radial and axial meshing on the results, displayed in table 1.
Grid resolution check.

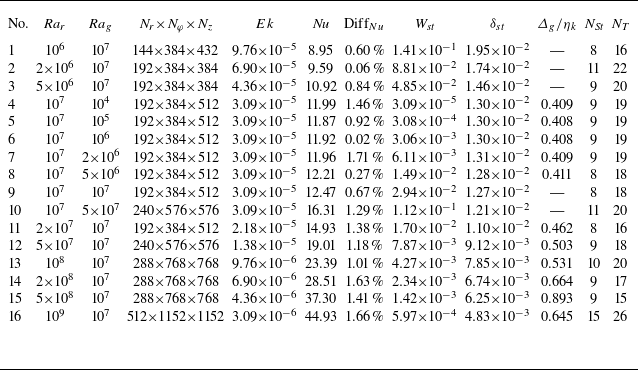
The parameters of the main simulations considered in this work are listed in tables 2 and 3, which are at
 $Ro^{-1}=23.9$
and
 $Ro^{-1}=42.5$
, respectively. The columns in tables 2 and 3 from left to right indicate the centrifugal Rayleigh number
 ${\textit{Ra}}_r$
, the gravitational Rayleigh number
 ${\textit{Ra}}_g$
, the resolution in the radial, azimuthal and vertical directions
 $N_r \!\times\! N_{\varphi } \!\times\! N_z$
, the Ekman number
 $Ek$
, the Nusselt number of heat transfer
 ${\textit{Nu}}$
and its relative difference of two halves
 $\operatorname {Diff}_{Nu}$
, the velocity amplitude
 $W_{\,\!\textit{st}}$
, the thickness of the Stewartson layer
 $\delta _{\,\!\textit{st}}$
, the posterior check on the maximum grid spacing
 $\varDelta _g$
by the global Kolmogorov length
 $\eta _K=(\nu ^3/\varepsilon )^{1/4}$
, and the numbers of grid points inside the Stewartson layer (
 $N_{\textit{St}}$
) and temperature boundary layer (
 $N_T$
). Note that the properties of the Stewartson layer in the tables denote those on the inner cylinder. Moreover, the global mean kinetic energy dissipation rate
 $\varepsilon$
is estimated in the centrifugal dominance regimes (
 ${\textit{Ra}}_r\gt {\textit{Ra}}_g$
) by the exact relations of CC:
 $\varepsilon =\nu ^{3}L^{-4}\,f(\eta )\,Pr^{-2}\,Ra\,(\textit{Nu}-1)$
(Wang et al. Reference Wang, Liu, Zhou and Sun2022b
), where the heat transfer is slightly affected by gravity, and the gravitational term in the energy balance can be ignored for the resolution check. Here,
 $f(\eta )={2(\eta -1)}/{((1+\eta )\ln(\eta ))}$
is a correction factor.
Numerical details for simulations at
 $Ro^{-1}=23.9$
.

Numerical details for simulations at
 $Ro^{-1}=42.5$
.

Appendix B. Effects on heat transfer
Figure 9 shows the variation of
 ${\textit{Nu}}$
under different boundary conditions and different
 ${\textit{Ra}}_g$
. Based on the previous discussion of the flow structure, when
 ${\textit{Ra}}_g = 0$
and periodic boundary conditions are applied to the top and bottom walls (yellow points), there is no Ekman layer or Stewartson boundary layer. Keeping
 ${\textit{Ra}}_g = 0$
, when no-slip boundary conditions are applied to the top and bottom walls (red points), the Ekman layer can be observed near the walls, while when
 ${\textit{Ra}}_g$
is large (blue points), the Stewartson layer appears. By comparing the
 ${\textit{Nu}}$
values in these three cases, we can make some inferences about the effects of the Ekman layer and the Stewartson layer on heat transfer; however, no significant changes in heat transfer have been observed in the current parameter regime. Furthermore, the energy losses caused by friction at the wall surfaces and the influence of
 ${\textit{Ra}}_g$
cannot be ruled out, which further complicates the process of drawing reliable conclusions. The influence of the velocity boundary layer, especially the Stewartson layer, on heat transfer requires further in-depth research.
The variation of
 ${\textit{Nu}}$
under different boundary conditions at
 $Ro^{-1}=23.9$
with
 ${\textit{Ra}}_r$
.

Appendix C. Calculations of
 $\boldsymbol{W}_{\!\boldsymbol{st}}$
and
$\boldsymbol{\delta} _{\!\boldsymbol{st}}$
using r.m.s. vertical velocity


(a) For
 ${\textit{Ra}}_g={\textit{Ra}}_r=10^7,\ Ro^{-1}=23.9$
, the r.m.s. vertical velocity profile in the radial direction at middle height
 $ z=H/2$
. The yellow dashed line represents a linear fit performed on the r.m.s. vertical velocity profile near the wall. A horizontal line (red dashed) is drawn through the local maximum (
 $W_{\,\!\textit{st}}$
) of the
 $w$
values. The radial distance from the intersection of these two lines to the wall is defined as the Stewartson boundary layer thickness (
 $\delta _{\,\!\textit{st}}$
). The inset shows the same data near the inner cylinder. (b) The maximum velocity
 $W_{\,\!\textit{st}}$
and (c) the thickness of the Stewartson layer
 $\delta _{\,\!\textit{st}}$
vary with
 $Ek$
. Cases under centrifugal dominance and gravitational dominance are marked as hollow and solid points, respectively.

Following another definition of boundary layer thickness by the r.m.s. profile (Kunnen et al. Reference Kunnen, Geurts and Clercx2010; Gastine et al. Reference Gastine, Wicht and Aurnou2015; Zhang et al. Reference Zhang, van Gils, Horn, Wedi, Zwirner, Ahlers, Ecke, Weiss, Bodenschatz and Shishkina2020, Reference Zhang, Reiter, Shishkina and Ecke2024), as shown in figure 10(a), we could define the thickness of the Stewartson boundary layer based on the intersection of tangents to the velocity profile. This definition draws on the ‘slope method’ concept for thermal boundary layers (Verzicco & Camussi Reference Verzicco and Camussi1999): first, a linear fit is performed on the r.m.s. vertical velocity profile near the wall, then a horizontal line is drawn through the local maximum (
 $W_{\,\!\textit{st}}$
) of the vertical velocity, and the radial distance from the intersection of these two lines to the wall is defined as the Stewartson boundary layer thickness (
 $\delta _{\,\!\textit{st}}$
).
Under this definition, the relationships between
 $W_{\,\!\textit{st}}$
,
 $\delta _{\,\!\textit{st}}$
and the Ekman number can be observed in figures 10(b) and 10(c). It is evident that
 $\delta _{\,\!\textit{st}}$
remains agreeing well with the
 $\delta _{\,\!\textit{st}}\sim {\textit{Ek}}^{1/3}$
scaling law under these circumstances, as well as the strength of the internal flow
 $W_{\,\!\textit{st}}\sim {\textit{Ek}}^{5/3}$
. These results sufficiently demonstrate that our conclusions are robust to the choices of the Stewartson boundary layer thickness definition.