Clostridium difficile has been identified as the most common cause of healthcare-associated infection in the United States,Reference Magill, Edwards and Fridkin 1 and C. difficile infection (CDI) is associated with longer hospital stay, increased readmissions, and nearly 30,000 deaths in 2011.Reference Zerey, Paton, Lincourt, Gersin, Kercher and Heniford 2 , Reference Lessa, Mu and Bamberg 3 Research indicates a number of individual risks for healthcare facility-onset (HO) CDI, including age,Reference Loo, Bourgault and Poirier 4 disease severity,Reference Kyne, Sougioultzis, McFarland and Kelly 5 and antibacterial and gastric acid suppressant (GAS) use, including proton pump inhibitors (PPIs).Reference Baxter, Ray and Fireman 6 – Reference Stevens, Dumyati, Fine, Fisher and van Wijngaarden 9 Hospital factors, including number of beds,Reference Gilca, Hubert, Fortin, Gaulin and Dionne 10 , Reference Chandler, Hedberg and Cieslak 11 proportion of elderly patients,Reference Pakyz, Jawahar, Wang and Harpe 12 geographic region,Reference Ricciardi, Harriman, Baxter, Hartman, Town and Virnig 13 room size,Reference Jou, Ebrahim, Shofer, Hamilton, Stern and Han 14 testing method, and teaching status, among others,Reference Datta, Kazerouni and Rosenberg 15 have also been associated with HO-CDI; however, many associations are not consistent.Reference Gilca, Hubert, Fortin, Gaulin and Dionne 10 , Reference Chandler, Hedberg and Cieslak 11 , Reference Ricciardi, Harriman, Baxter, Hartman, Town and Virnig 13 , Reference Ahyow, Lambert, Jenkins, Neal and Tobin 16
As of 2013, hospitals that participate in the Centers for Medicare and Medicaid Services Hospital Inpatient Quality Reporting Program report HO-CDI cases to the Centers for Diseases Control and Prevention’s National Healthcare Surveillance Network (NHSN) for inclusion in the Value-Based Purchasing Program. 17 Public reporting commenced in 2014 in the form of a standardized infection ratio (SIR), which was obtained by dividing the number of HO-CDI incident cases by the predicted number of cases based on adjustment factors (medical school status, size, CDI test type, and community-onset rate). A value <1.0 implies that hospital performance was better than expected (ie, ‘Better’ hospital), a value of >1.0 indicates worse than expected performance (ie, ‘Worse’ hospital), and a value close to 1.0 implies that performance was the same as the US national benchmark (ie, ‘No different’ hospital).
Commencement of HO-CDI reporting affords an opportunity to evaluate medications that are associated with hospitals that performed ‘Better’ versus ‘Worse’ versus ‘No different’ and can inform antimicrobial stewardship program strategies. The primary aim of this study was to compare patterns of antibacterial and GAS use among academic medical centers across different SIR categories. Because non-modifiable hospital factors also have an impact on HO-CDI, a secondary aim was to identify non-medication factors associated with different categories.
METHODS
Study Design
The study design is a hospital-level, cross-sectional analysis. Data on medication use and patient mix were obtained from the Clinical Database Research Manager (CDB/RM) of the University HealthSystem Consortium (UHC), an alliance of US academic medical centers. The CDB/RM includes procedure- and diagnosis-specific data from discharge abstract summaries and charge-based inpatient medication data. Data included adult inpatients (≥18 years) discharged in 2013.
Medication Use Data
Systemic antibacterial use data were obtained from the CDB/RM for total antimicrobial administration, the majority of antibacterials except for infrequently used agents, such as antimycobacterials, and for a subset of broad-spectrum use (ie, β-lactam/β-lactamase inhibitor combinations, carbapenems, third- and fourth-generation cephalosporins, quinolones). The GAS agents were grouped into PPIs and histamine-2 receptor antagonists (H2RAs). Usage was expressed by 3 metrics: total number of days that charges existed for each particular medication (ie, days of therapy per 1,000 patient days), average length of therapy, and proportion of patients receiving an antibacterial/GAS agent.
Hospital Characteristics
Hospital characteristics that have been previously associated with HO-CDI, or are thought to be potentially associated with HO-CDI, were obtained: geographic location (ie, Northeast, South, Midwest, West); size; and proportion of admissions that were Medicare, Medicaid; proportions of admissions of white, black, and Hispanic patients; female gender; and age ≥65 years. Patient mix variables included proportion of patients receiving care in intensive care units (ICUs); proportion admitted from another facility; case mix index (CMI); average length of stay; proportions of patients by All Patient Refined-Diagnosis Related Group (APR-DRG) severity of illness at time of admission category (ie, extreme, major, moderate, or minor); 18 chemotherapy (antineoplastic) days of therapy per 1,000 patient days; number of patient days per 1,000 patient days in 35 different UHC Clinical Service Lines (CSLs) collapsed into 4 categories: surgery; medicine; transplant; and other.
HO-CDI Performance Category
We adopted the SIR category from the Hospital Compare website for 2013; SIR is based on the number of cases of facility-wide laboratory-identified (LabID) HO-CDI events (ie, positive test for C. difficile toxin A and/or B, or toxin-producing organism detected in stool by culture, collected ≥ admission day 4) and adjusted for factors as described above according to the NHSN definition. 19 LabID data included HO-CDI cases facility wide, including pediatrics, but we collected data on adults only because the majority of admissions are adultsReference Pakyz, Gurgle, Ibrahim, Oinonen and Polk 20 and because HO-CDI occurs less frequently in children.Reference Lessa, Gould and McDonald 21
Statistical analysis
To compare medication use in hospitals among SIR categories for the 3 measures of use (ie, days of therapy, length of therapy, and proportion of use), descriptive analyses were conducted and differences in measures between categories were evaluated using one-way analysis of variance (ANOVA) and χ2 tests as appropriate. To identify hospital factors associated with the SIR, a multivariate, ordered-probit regression analysis was conducted with the SIR category as the dependent variable. First, univariate, ordered-probit analyses with hospital characteristics, including medication measures, were conducted. Univariate associations with P<.25 were added to the multivariate analysis. Variance inflation factors were calculated to assess multicollinearity (ie, >10). A forward stepwise, multivariate, ordered-probit model was fitted using variables that were judged to be capable of affecting outcome without significant multicollinearity, with P<.15 as a limit for entrance and P<.20 for exit. Models were constructed as follows: a negative coefficient was interpreted as the increasing of the unit of the independent variable being associated with a worse SIR category (eg, either ‘No different’ versus ‘Better’, or ‘Worse’ versus ‘No different’); a positive coefficient was interpreted as the increasing of the independent variable unit being associated with a better category (eg, either ‘No different’ versus ‘Worse’, or ‘Better’ versus ‘No different’). Model fit was verified by comparison with alternative models using Akaike’s Information Criterion. An α-level of 0.05 was considered significant unless otherwise specified.
RESULTS
Hospital Characteristics
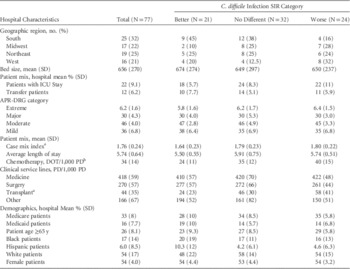
Complete medication data for 2013 were available for 77 hospitals. Average bed size was 656, average length of stay was 5.74 days, and hospitals were located throughout the United States, most in the South. The most commonly identified SIR category was ‘No different’ (42%), followed by ‘Worse’ (31%), and ‘Better’ (27%). Table 1 displays hospital characteristics according to SIR category. No significant differences were detected across the hospital categories with regard to the following demographics: gender, race, payer, proportion of patients ≥65 years old, or geographic diversity. Regarding patient mix, the ‘Worse’ and ‘No different’ hospitals had more ICU patients, but differences were not significant. However, significant differences were detected in mean CMI: ‘Worse’ hospitals (1.8), ‘No different’ (1.79), and ‘Better’ (1.64) (P<.05). Among the CSLs, significant differences were detected with a higher average number of transplant service patient days per 1,000 patient days in the ‘Worse’ hospitals (58 days) versus ‘No different’ (46 days) versus ‘Better’ (24 days) (P<.05). Significant differences were also detected in average number of chemotherapy days of therapy per 1,000 patient days: ‘Better’ hospitals (24 days), ‘No different’ (35 days), and ‘Worse’ (40 days) (P<.001).
Hospital Characteristics According to C. difficile Infection Standardized Infection Ratio (SIR) Category

NOTE. SD, standard deviation; ICU, intensive care unit; APR-DRG, All Patient Refined-Diagnosis Related Group (APR-DRG); DOT, days of therapy; PD, patient days.
a Significant difference by one-way analysis of variance between ‘Better,’ ‘No different,’ and ‘Worse’ groups (P<.05).
b Significant difference by one-way analysis of variance between ‘Better,’ ‘No different,’ and ‘Worse’ groups (P<.001).
Medication Use
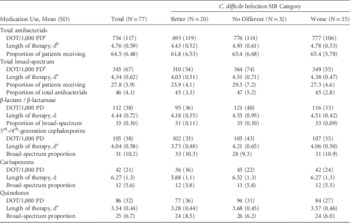
Among hospitals, more than 50% of patients (64.5%, range 47.9%–84.8%) received an antibacterial, with 27.8% receiving broad-spectrum antibacterials, which accounted for 46% of total use (Table 2). The most commonly used broad-spectrum classes, expressed as average total days of therapy per 1,000 patient days, were β-lactam/β-lactamase inhibitors (112 days) and third- and fourth-generation cephalosporins (105 days).
Characteristics of Total and Broad-Spectrum Antibacterial Use Among Hospitals According to C. difficile Standardized Infection Ratio (SIR) Category

NOTE. DOT, days of therapy; PD, patient days.
a Significant difference by one-way analysis of variance between ‘Better,’ ‘No different,’ and ‘Worse’ groups (P<.05).
b Significant difference by one-way analysis of variance between ‘Better,’ ‘No different,’ and ‘Worse’ groups (P<.01).
Table 2 also displays antibacterial data among the categories. Regarding total antibacterials administered, ‘No different’ and ‘Worse’ hospitals had higher average days of therapy per 1,000 patient days, 776 days and 777 days, respectively, versus ‘Better’ (693 days) (P<.05). A significant difference was also detected in average total length of therapy, with ‘No different’ hospitals having the longest average length of therapy (4.93 days) versus ‘Worse’ (4.78 days), and ‘Better’ (4.43 days) (P<.01).
Regarding total broad-spectrum antibacterials, a significant difference was detected in days of therapy per 1,000 patient days: ‘Better’ hospitals (310 days) versus ‘No different’ (364 days), and ‘Worse,’ (349 days) (P<.05). We also detected a significant difference across categories in average broad-spectrum length of therapy, with ‘No different’ hospitals having the longest (4.51 days) versus ‘Worse’ (4.38 days) and ‘Better’ (4.03 days) (P<.05) (Table 2).
For quinolones and third- and fourth-generation cephalosporins, the average length of therapy was significantly different across hospital categories. For quinolones, ‘Better’ hospitals had an average length of therapy (3.28 days) versus ‘No different’ (3.68 days) and Worse’ (3.57 days) (P<.05). For third- and fourth-generation cephalosporins, ‘Better’ had the lowest average length of therapy (3.73 days) versus ‘No different’ (4.21 days) versus ‘Worse’ (4.06 days) (P<.05).
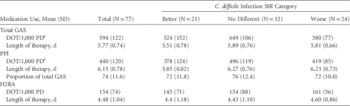
Hospitals used GAS agents for an average of 594 days of therapy per 1,000 patient days, with an average of 5.77 days per treated patient (Table 3). On average, PPIs accounted for 74% of total GAS use. Among the 3 hospital categories, we detected differences in GAS use: ‘No different’ hospitals administered 649 days of therapy per 1,000 patient days, versus ‘Better’ (524 days) and ‘Worse’ (580 days) (P<.01). ‘Better’ hospitals administered PPIs on fewer days (378 days of therapy per 1,000 patient days) versus ‘No different’ (496 days) and ‘Worse’ (419 days) (P<.01).
Total Gastric Acid Suppressant (GAS), Proton Pump Inhibitor (PPI), and H2 Receptor Antagonist (H2RA) Use According to C. difficile Standardized Infection Ratio (SIR) Category

NOTE. SD, standard deviation; DOT, days of therapy; PD, patient days.
a Significant difference by one-way analysis of variance between ‘Better,’ ‘No different,’ and ‘Worse’ groups (P<.01).
Multivariate Analysis
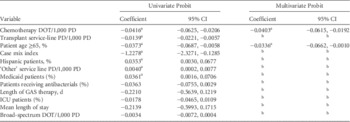
The variables chemotherapy days of therapy per 1,000 patient days and proportion of patients ages ≥65 years had a significantly negative association with the SIR category in the final regression model. An increase in chemotherapy days of therapy and an increase in the proportion of patients aged ≥65 years was associated with either an SIR category of ‘No different’ versus ‘Better’, or ‘Worse’ versus ‘No different’ (Table 4). The following variables, which had a P<.25 on univariate analysis and were not associated with multicollinearity problems, were entered into the final analysis: proportion of ICU, Medicaid, race, facility transfer patients, receiving any antibacterial, and patients aged ≥65 years; CMI; average length of stay; CSL patient days per 1,000 patient days; broad-spectrum antibacterial, chemotherapy, and PPI days of therapy per 1,000 patient days.
Estimates for Multivariate Ordered Probit Regression for Factors Associated with C. difficile Infection Standardized Infection Ratio (SIR) Category

NOTE. CI, confidence interval; DOT, days of therapy; PD, patient days; GAS, gastric acid suppressant; ICU, intensive care unit.
a Significant at P<.05.
b Removed from final regression model because it was not significant in the presence of the other factors.
DISCUSSION
In this study, we evaluated antibacterial use patterns stratified by CDI performance. Although some differences were small in nature, ‘Better’ hospitals used less antibacterials, including broad-spectrum agents, and for shorter durations than ‘No different’ and ‘Worse’ hospitals. ‘Better’ hospitals not only used PPIs and chemotherapy drugs for fewer days but also had fewer transplant patients and a lower CMI. Only chemotherapy days of therapy and proportion of elderly patients had significant associations with the SIR category, suggesting that the risk adjustment for HO-CDI is incomplete.
Our results show differences across SIR categories in quinolones and third- and fourth-generation cephalosporin length of therapy. These results corroborate the findings of Feazel et al,Reference Feazel, Malhotra, Perencevich, Kaboli, Diekema and Schweizer 22 who identified these classes as the most commonly restricted in a meta-analysis of ASP effectiveness on CDI reduction. In contrast with patient-level studies,Reference Slimings and Riley 23 hospital-level medication use was not associated with the SIR category when accounting for other factors. These results corroborate other investigations suggesting that patient-level, but not hospital-level, medication use is associated with HO-CDI.Reference Pakyz, Jawahar, Wang and Harpe 12 , Reference Jenkins, Knepper and Shihadeh 24 However, a number of studies have demonstrated declines in CDI following hospital antimicrobial stewardship efforts,Reference Davey, Brown and Charani 25 , Reference Talpaert, Gopal Rao, Cooper and Wade 26 and region-level and ward-level prescribing patterns have been associated with CDI rates.Reference Kanerva, Ollgren, Voipio, Mentula and Lyytikainen 27 , Reference Brown, Valenta, Fisman, Simor and Daneman 28 It has been suggested that antimicrobial stewardship and environmental efforts may be more effective in reducing CDI in units and hospitals with higher baseline rates.Reference Jenkins, Knepper and Shihadeh 24 , Reference Mayfield, Leet, Miller and Mundy 29 Another study reported that the level of association between hospital characteristics and rates of HO-CDI differs during epidemic and non-epidemic years.Reference Gilca, Hubert, Fortin, Gaulin and Dionne 10 The effect of CDI baseline prevalence may have confounded the relationship between usage patterns and SIR category in this study. Additionally, rates of asymptomatic colonization may influence the effect of hospital-level antibacterial usage on HO-CDI risk, as reported previously.Reference Lawrence, Puzniak, Shadel, Gillespie, Kollef and Mundy 30 The negative association between chemotherapy days of therapy and SIR category may reflect an increased risk for CDI with higher severity of illness Reference Kyne, Sougioultzis, McFarland and Kelly 5 or cancer diagnosis,Reference Schaier, Wendt, Zeier and Ritz 31 for which chemotherapy days may be a marker, or the association could be related to chemotherapy administration itself.Reference Loo, Bourgault and Poirier 4 , Reference Anand and Glatt 32 Case mix has previously been identified as a significant predictor of HO-CDI incidence in multivariate analyses while accounting for other NHSN adjustors.Reference Thompson, Edwards, Dudeck, Fridkin and Magill 33
Our study had several limitations. Data were not available concerning hospital infection prevention measures, asymptomatic C. difficile colonization, nor for cases that were caused by epidemic versus nonepidemic strains. The SIR is based on HO-CDI cases identified by a positive laboratory test; using measures that rely on clinical surveillance definitions could alter results. Finally, the study sample is comprised of academic medical centers, and results may not be generalizable to community hospitals.
In conclusion, differences in patterns of high-risk medication use were noted between ‘Better,’ ‘No different,’ and ‘Worse’ hospitals for HO-CDI incidence. ‘Better’ hospitals used fewer antibacterials and GAS agents, and for shorter durations, especially for third- and fourth-generation cephalosporins, quinolones, and PPIs. The finding that ‘Better’ hospitals administered fewer chemotherapy medications and had fewer elderly patients demonstrates the need for further research in the area of risk-adjustment for HO-CDI inter-hospital comparisons.
ACKNOWLEDGMENTS
Potential conflicts of interest: All authors report no conflicts of interest relevant to this article.
Financial support: This project was supported by the Agency for Healthcare Research and Quality (grant no. K08HS018578 to A.L.P.).