The left ventricular systolic function in patients with atrial septal defect is usually normal, and only a few cases had a reduced left ventricular ejection fraction with extreme right ventricular volume overload. Reference Wu, Akagi and Taniguchi1 The transcatheter atrial septal defect closure increases the blood flow to the left ventricle immediately and can unmask subtle changes in the systolic and diastolic function. Clinical work in cardiac mechanics is currently progressing from short- and long-axis left and right ventricular function and ejection fraction to two- and three-dimensional ventricular deformation studies (measurement of strain and strain rate). Reference Buckberg, Weisfeldt and Ballester2 These methods allow myocardial motion and deformation to be quantified in various directions (longitudinal, radial, and circumferential), while previous techniques rely primarily on radial function assessment. Several previous right ventricular strain studies have identified that the volume overload of atrial septal defect usually results in hyper-normal function which is reduced by defect closure. Reference Jategaonkar, Scholtz and Schmidt3 Strain imaging has also been used to demonstrate that patients who underwent device closure of an atrial septal defect had better longitudinal deformation of the left and right ventricles than patients who had an atrial septal defect closed surgically. Reference Di Salvo, Drago and Pacileo4 According to the old studies that documented the standard effect of pulmonary embolism and pulmonary hypertension on the right ventricular wall motions (McConels’ sign), the most sensitive segment of the right ventricular wall is the mid-free wall. Reference McConnell, Solomon and Rayan5,Reference Van De Bruaene, Buys and Vanhees6 There is a growing interest in studying the time course changes in global and regional right ventricular strain in atrial septal defect patients. Reference Eroglu, Cakal and Cakal7 The effect of atrial septal defect and its device size on the different biventricular longitudinal segmental strain is still under investigation. In the current research, we aimed to determine haemodynamic changes in the right and left ventricles using two-dimensional strain in patients with atrial septal defect before and after transcatheter closure with a special focus on evaluating the relationship between device size and biventricular systolic strain.
Materials and methods
Patient selection
A total of 100 patients with isolated ostium secundum atrial septal defect and 40 age-matched control healthy subjects without atrial septal defect were enrolled in this prospective observational study. All atrial septal defect patients were scheduled for elective transcatheter atrial septal defect closure before the start of the study based on the recommendations for the management of atrial septal defect according to the related European and American guidelines. Reference Stout, Daniels and Aboulhosn8–Reference Silvestry, Cohen and Armsby10
Patients with any of the following criteria were excluded from enrolment in the study: very large stretched secundum atrial septal defect > 38 mm according to Canadian and European CHD guidelines, Reference Baumgartner, Bonhoeffer and De Groot11,Reference Silversides, Dore and Poirier12 insufficient atrial septal defect rims (except aortic rims), irreversible pulmonary hypertension, sinus venosus or primum atrial septal defect type, other associated heart diseases, atrial fibrillation, hypertension, coronary artery disease, and echocardiographic documented left ventricular systolic or diastolic dysfunction or elevated left ventricular end-diastolic pressure after transcatheter balloon occlusion test.
The study group was subdivided into two groups based on the atrial septal defect occluder device size used, group one with smaller occluder devices (n = 74) and group two with large occluder devices (n = 26).
Transthoracic echocardiography
All transthoracic echocardiography, including standard two-dimensional, M-mode, grey scale, Doppler, and two-dimensional longitudinal strain imaging, were performed using an iE33 ultrasound system (Philips Healthcare, Best, the Netherlands) with a two-dimensional cardiac probe S5–1 (1–5 MHz). All views were Electrocardiography (ECG) gated. The sweep speed for both M-mode and Doppler was set at 150 mm/s. The Nyquist limit was set at 50–70 cm/s for all spectral Doppler recordings. All echocardiographic views and offline analyses were performed using QLAB software following the international recommended protocols. Reference Voigt, Pedrizzetti and Lysyansky13
Standard echocardiography
All standard echocardiographic windows (i.e., subcostal, apical, parasternal, and suprasternal) were used applying the sequential analysis to establish the situs, atrioventricular and ventriculoarterial connections, great vessel relation and abnormalities, ventricular dimensions and functions, state of cardiac valves, venous connections, and any intra-cardiac shunts. In the subcostal view, two-dimensional and colour flow was used to assess the atrial septal defect dimensions, anatomical features of the defect, and its relation to the superior and inferior vena cava when applicable and confirmed by transoesophageal echocardiogram.
Two-dimensional strain imaging and post-processing
Two-dimensional strain data were obtained and stored in a cine-loop format for offline analysis. In the standard apical four-, three-, and two-chamber views of three cardiac cycle cine clips (70–90 frames/second), the endocardium of the left ventricle was semiautomated in end-systole, and the endocardial borders were automatically tracked throughout the whole cardiac cycle. The right ventricle was manually drawn like left ventricular software in the apical four-chamber view and then automatically divided into seven segments (basal, mid, apical cap, and apical segments of the septum and right ventricular lateral wall). Once approved by the reading operator, the QLAB analysis package (Philips) software with automated cardiac motion quantification displayed longitudinal strain for the respective segments of the left and right ventricles (peak longitudinal systolic strain for the respective segments and the global longitudinal strain).
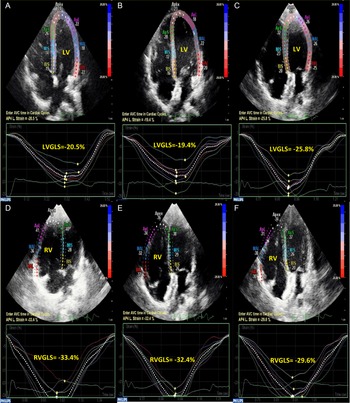
Two-dimensional strain was performed for all patients at baseline and at 24 hours and 1 month after the procedure (Fig 1). Comparisons between the results of the two-dimensional strain were performed between the study group and age-matched controls at baseline and among the study group at baseline and 1-day and 1-month post-procedure.
Two-dimensional transthoracic echocardiographic apical four-chamber view of left and right ventricular global and segmental longitudinal systolic strain changes of one case of atrial septal defect before, 24 hours, and 1 month after atrial septal defect device closure: A. Left ventricular AP4L strain before closure (−20.5%). B. Left ventricular -AP4L strains 24 hours after closure (−19.4%). C. Left ventricular AP4L strains 1 month after closure (−25.8%). D. Right ventricular AP4L strains before closure (−33.4%). E. Right ventricular AP4L strains 24 hours after closure (−32.4%). F. Right ventricular AP4L strains 1 month after closure (−29.6%). Abbreviations: ASD = atrial septal defect; LV = left ventricle; RV = right ventricle; AP4L = apical four-chamber longitudinal strain; GLS = global longitudinal strain.

Transoesophageal echocardiography
All patients underwent transoesophageal echocardiography by using the same transthoracic echocardiography machine with a two-dimensional cardiac adult probe X7-2t (2–7 MHz) and GE Vivid S5 ultrasound machine with 9T-RS paediatric probe (3.0–10.0 MHz) before and during the transcatheter closure of atrial septal defect for guidance and monitoring to facilitate proper device placement.
Transcatheter device closure and device size selection
Diagnostic coronary angiography was performed before transcatheter closure in cases > 40 years. Percutaneous closure of the atrial septal defect was performed under general anaesthesia with fluoroscopic and transoesophageal echocardiography guidance. The suitable size of the Amplatzer septal occluder (AGA Medical, Golden Valley, MN, United States of America) was set to be 2–4 mm larger than the widest diameter, measured according to transoesophageal echocardiography dimensions of the defect, or equal to the balloon waist using the stop-flow technique in patients in whom balloon sizing was used. Regarding the device size, the study group was subdivided into a small device group (waist diameter ≤2.4 cm) and large device group (waist diameter ≥2.5 cm) according to the safety cut-off point of transcatheter closure of the large atrial septal defect (diameter ≥2 cm) mentioned in previous studies. Reference Meyer, Kurz and Bernheim14,Reference Romanelli, Harper and Mottram15
Follow-up
Follow-up was performed 1 day after the procedure and 1 month later with clinical examination and two-dimensional transthoracic echocardiography with strain imaging to assess biventricular function, device position, and the presence of a residual shunt by an independent experienced echocardiography, which were blinded regarding patient classification.
A substudy involving 20 patients was assessed to determine inter- and intra-observer variability by two operators. Each operator measured the two-dimensional regional and global strain values twice for each patient and this was done during the regular two-dimensional transthoracic echocardiographic examinations before and after the intervention.
Statistical analysis
Statistical analysis was performed using IBM SPSS version 24 (IBM). The normality of the data was visually assessed (using histograms and a standard Q–Q plot) and formally tested using the Shapiro–Wilk test. Continuous and normal data are expressed as the mean ± standard error (SEM), compared before and after the intervention by using paired t-test and between different groups by using independent t-test. Delta changes (Δ) are the difference between the values after the intervention and before that of the same segment. Correlation was assessed with the Pearson correlation coefficient. The authors had full access to the data and take full responsibility for its integrity. To measure inter- and intra-observer variability, the substudy used the correlation coefficient and intra-class correlation. P ≤ 0.05 was regarded as significant, while p < 0.01 was regarded as highly significant.
Results
The demographic characteristics of the atrial septal defect subjects compared with the age-matched controls were illustrated in Table 1.
Demographic characteristics of the ASD versus control groups

Continuous data represented as mean ± SEM, categorical data in the form of n and percentage
ASD = atrial septal defect; BSA = body surface area; HR = heart rate; Mean device size index = mean device size/body surface area; N= number
Baseline comparison between biventricular dimensions of the study group versus controls
In atrial septal defect patient, there was a significant increase in right ventricular end-diastolic dimensions in comparison to the control group at the expense of left ventricular end-diastolic dimensions as shown in Table 2. Moreover, the hyperkinesia of the right ventricle was represented in the form of higher tricuspid annular plane systolic excursion values than in control with an insignificant difference in diastolic function (Table 2). The systemic/pulmonary blood flow (Qp/Qs) and right ventricular systolic pressure of atrial septal defect group showed a high significant elevation (2.83 ± 0. 16, 29.51 ± 0.89 mmHg, p < 0.001, <0.001).
Baseline transthoracic echocardiographic measures of ASD versus control groups

Reported data were presented as mean values ±SEM. Independent two-tailed t-test was used for comparison between the groups
ASD = atrial septal defect; LAD = left atrial diameter; LVEDD = left ventricular end-diastolic diameter; LVGLS = left ventricular global longitudinal strain; RVEDD = right ventricular end-diastolic diameter; RVGLS = right ventricular global longitudinal strain; RVSP = right ventricular systolic pressure; Septal e’ = early diastolic velocity of septal mitral annulus motion; TAPSE = tricuspid annular plane systolic excursion; Qp/Qs = systemic/pulmonary blood flow
P-value < 0.05 was considered significant. P-value < 0.001 was considered highly significant
The bold values of P-wave indicate significant and highly significant values
Baseline comparison between biventricular longitudinal global and regional strains of the study group versus controls
All atrial septal defect patients had significantly higher right ventricular global longitudinal strain (p = 0.033) in comparison to the control group. The left ventricular global longitudinal strain showed insignificant difference between atrial septal defect patients and control group (p = 0.114) (Tab. 2). Regarding the regional strain, there was a significant hyperkinesia involving the left ventricular lateral wall strains (left ventricular apical lateral strain p = 0.037, left ventricular mid-lateral strain p = 0.012, left ventricular basal-lateral strain p = 0.042), and right ventricular apical segment strains (p = 0.020) (Table 3).
Baseline two-dimensional transthoracic echocardiographic biventricular longitudinal regional systolic strains of ASD and control groups

Reported data were expressed as mean values ±SEM. Statistical analysis was done by independent two-tailed t-test
ASD = atrial septal defect; aps = apical-septal segment; apl = apical-lateral segment; bal = basal-anterolateral segment; bis = basal-inferoseptal segment; mal = mid-anterolateral segment; mis = mid-inferoseptal segment; LVGLS = left ventricular global longitudinal strain, LVPLSS = left ventricular peak longitudinal systolic strain; RVGLS = right ventricular global longitudinal strain, RVPLSS: right ventricular peak longitudinal systolic strain
Significant P-value < 0.05, highly significant P-value < 0.001
The bold values of P-wave indicate significant and highly significant values
Immediate and short-term biventricular dimensions, longitudinal global and regional strains change after atrial septal defect device closure
After 24 hours of atrial septal defect device closure, there was a significant reduction in the right ventricle/left ventricle ratio, which was associated with subsequent decrease in right ventricular global longitudinal strain (p < 0.001), while only left ventricular global longitudinal strain increased after 1 month compared with 24 hours after device closure (p = 0.038) (Table 4).
Baseline standard transthoracic echocardiographic measures of ASD before, 24 hours, and 1 month after device closure

Post-closure 1: 24 hours after ASD device closure, post-closure 2: 1-month after ASD device closure. Reported data were expressed as mean values ±SEM. N = 100. . Statistical analysis was done by paired two-tailed t-test
ASD = atrial septal defect; LAD = left atrial diameter; LVEDD = left ventricular end-diastolic diameter; LVGLS = left ventricular global longitudinal strain; RVEDD = right ventricular end-diastolic diameter; RVGLS = right ventricular global longitudinal strain
Significant P-value < 0.05, highly significant P-value < 0.001
The bold values of P-wave indicate significant and highly significant values
P-value1: Comparison of ASD cases variables (24-hour post-closure) versus (before closure)
P-value2: Comparison of ASD cases variables (1-month post-closure) versus (before closure)
P-value3: Comparison of ASD cases variables (1-month post-closure) versus (24hours post-closure)
The early changes within 24 hours of closure were observed in the left ventricular segmental strain, especially the basal and lateral segments before apical and septal ones. On the other hand, the right ventricular segmental strains had statistically significant changes at different levels with early decrease in apical segments and marked persistent reduction in basal inferoseptum with percent change of 3.48% and mid-anterolateral walls with percent change of 5.1% within 24 hours of closure (Table 5).
Two-dimensional transthoracic echocardiographic left and right ventricular longitudinal regional systolic strains of the ASD group at baseline, 24 hours, and 1 month after device closure

Post-closure 1: 24 hours after ASD device closure, Post-closure 2: 1-month after ASD device closure. Reported data were expressed as mean values ±SEM. Statistical analysis was done by paired two-tailed t-test
Significant P-value < 0.05, highly significant P-value < 0.001
The bold values of P-wave indicate significant and highly significant values
P-value1: Comparison of ASD cases variables (24-hour post-closure) versus (before closure)
P-value2: Comparison of ASD cases variables (1-month post-closure) versus (before closure)
P-value3: Comparison of ASD cases variables (1-month post-closure) versus (24-hour post-closure)
apl = apical-lateral segment; aps = apical-septal segment; ASD = atrial septal defect, bal = basal-anterolateral segment; bis = basal-inferoseptal segment; mal = mid-anterolateral segment; mis = mid-inferoseptal segment; LVPLSS = left ventricular peak longitudinal systolic strain, RVPLSS = right ventricular peak longitudinal systolic strain
Comparative changes in regional biventricular longitudinal strains after atrial septal defect device closure
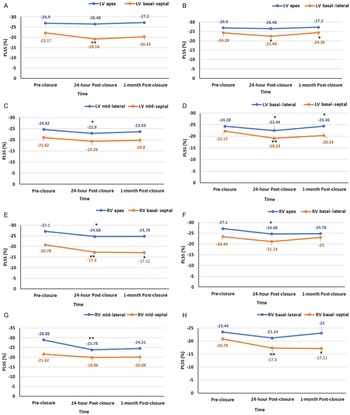
Regarding the left ventricular segmental strains; there was a significant decrease within 24 hours of closure in the basal segments compared to the apical segments, which was followed by a significant improvement in these segments compared to the apical segments at 1-month follow-up (Fig 2A, B). There was also a significant decline in the left ventricular mid-lateral strain compared to the mid-septal strain 24 hours post-closure except for basal segments of both walls had a significant reduction (Fig 2C, D).
The comparative changes in biventricular longitudinal regional strains before, 24 hours, and 1 month after atrial septal defect device closure. A. Linear chart of the changes in apical left ventricular strain versus basal-septal one. B. Linear chart of the changes in apical left ventricular strain versus basal-lateral one. C. Linear chart of the changes in mid-lateral left ventricular strain versus mid-septal one. D. Linear chart of the changes in basal-lateral left ventricular strain versus basal-septal one. E. Linear chart of the changes in apical right ventricular strain versus basal-septal one. F. Linear chart of the changes in apical right ventricular strain versus basal-lateral one. G. Linear chart of the changes in mid-lateral right ventricular strain versus mid-septal one. H. Linear chart of the changes in basal-lateral right ventricular strain versus basal-septal one. Reported data were expressed as mean values ±SEM. Significant P-value < 0.05. *Significant P-value. **Significant P-value (< 0.001). Statistical analysis of each segment was done by paired two-tailed t-test. Abbreviations: RV = right ventricle; LV = left ventricle; PLSS = peak longitudinal systolic strain.

Otherwise, there was a significant reduction in the right ventricular apex and basal-septal strains 24 hours after closure which was persistent at the level of basal segment for 1-month follow-up with insignificant basal-lateral strain changes (Fig 2E, F). The immediate changes in the right ventricular peak longitudinal systolic strain of mid-anterolateral (PLSSmal) segment were highly significant in comparison to the mid-inferoseptal one (PLSSmis) and was persistent for 1-month duration (Fig 2G). The right ventricular basal-septal segment also had high significant changes after 24 hours in comparison to the basal-lateral one and was persistent for 1 month, because it is the left and right ventricular shared segment (Fig 2H).
Global longitudinal biventricular strain in patients with small versus large atrial septal defect device size
A linear correlation was performed between the percent change of the right and left ventricular global longitudinal strain values at baseline and 24-hour post-closure (Δ1), baseline and 1-month post-closure (Δ2), and 24-hour and 1-month post-closure (Δ3) on the one hand and the absolute value of the device size in the entire study group and in the large and small device size subgroups on the other hand. The same correlation was also performed using the device size indexed to the body surface area.
Comparison between these correlations regarding the r value showed a stronger yet modest and non-significant correlation between the large device size subgroup and the right ventricular global longitudinal strain delta changes (Δ1, Δ2, and Δ3) (r = 0.289, 0.563, and 0.384, respectively) compared to the entire study group (r = 0.039 and 0.195, respectively) and the small device size subgroup (r = −0.102 and −0.322, respectively). There was a significant negative and weak correlation between the large device size indexed/body surface area and the right ventricular global longitudinal strain after 24 hours (r = −0.425, p = 0.034) (Table 6, Fig 3). However, the correlation between left ventricular global longitudinal strain and the study group’s device size and indexed one showed weak non-significant correlation.
Correlation table between the delta change of the biventricular global longitudinal strain perioperatively and the device size and indexed device size of total versus large versus small device groups

Δ1: Difference between GLS value 24-hour post-closure and before closure
Δ2: Difference between GLS value 1-month post-closure and before closure
Δ3: Difference between GLS value 1-month post-closure and before closure
Statistical analysis was done by bivariate correlation (R)
ASD = atrial septal defect; indexed device size = device size (cm)/body surface area (m2); LVGLS = left ventricular global longitudinal strain; RVGLS = right ventricular global longitudinal strain
Significant P-value < 0.05
The bold values of P-wave indicate significant values
The correlation charts between the device size indexed to body surface area and delta change in right ventricular global longitudinal strain after 24 hours of atrial septal defect device closure and 95% confidence interval. Significant negative weak correlation between the indexed device size/body surface area and delta 1 change in right ventricular global longitudinal strain of the large atrial septal defect study subgroup (r: −0.425, p = 0.034). The higher range of indexed large device size to small body surface area (>3 cm/m2) had a lower degree in right ventricular global longitudinal strain acute reduction to normal value than that of low- to mid-range size of indexed large device size (between 1.5–3 cm/m2). Abbreviations: Delta 1: difference between 24-hour post-atrial septal defect device closure and before closure. RVGLS = right ventricular global longitudinal systolic strain; BSA = body surface area. Significant P-value < 0.05. Statistical analysis was done by bivariate correlation (R).

The percent delta changes of the biventricular global and regional strains (Δ1 and Δ2) were compared between the two subgroups and there was no significant difference.
For both intra-observer and inter-observer variability, high correlations of strain values were achieved for left ventricular global longitudinal strain (correlation coefficient (r) = 0.98 and 0.95, respectively, intra-class correlation coefficient = 0.98 and 0.96, respectively, p < 0.0001). There were slightly lower but still significant strong correlations for right ventricular global longitudinal strain intra-observer and inter-observer variation (r = 0.94 and 0.94, respectively, intra-class correlation coefficient = 0.99 and 0.97, respectively p < 0.0001).
Discussion
In this study, the researchers reported the haemodynamic impact of opened atrial septal defect on biventricular dimensions and subsequently global longitudinal strain due to hyperkinesia of the biventricular basal and lateral wall segments and the right ventricular apex. After 24 hours of transcatheter atrial septal defect closure, right ventricle experienced a significant reduction in global longitudinal strain, followed by an improvement in left ventricular preload and global longitudinal strain after 1 month. A marked reduction in the basal interventricular septal strain was observed. In addition, a significant negative correlation existed between the indexed device size and the delta changes in the right ventricular global longitudinal strain after 24 hours of device closure.
There are many factors that can affect the ventricular strain, especially in CHD including the geometrical changes in the form of wall thickness and curvature, inhomogeneity of myocardium, wall desynchrony, preload, and afterload. Reference Voigt and Cvijic16 Most reported cases of strain in atrial septal defect show heterogenicity in regional strain. Reference Van De Bruaene, Buys and Vanhees6,Reference Eroglu, Cakal and Cakal7 The effect of atrial septal defect closure on biventricular global and regional longitudinal strain shows controversy. Reference İslamlı, Cümşüdov and Bilgin17,Reference Bussadori, Oliveira and Arcidiacono18
About a decade ago, researchers found that right ventricular global longitudinal strain of atrial septal defect patients was significantly higher than control subjects and was reduced significantly after atrial septal defect closure, especially in the lateral wall segments, but failed to reach similar results in left ventricular global or segmental longitudinal strain changes. Reference Eroglu, Cakal and Cakal7,Reference Bussadori, Oliveira and Arcidiacono18 In 2013, Aysel Islamli and colleagues identified that there were insignificant changes in the right ventricular global longitudinal strain and segmental strain between atrial septal defect cases and healthy control subjects. Reference İslamlı, Cümşüdov and Bilgin17 In the current study, we demonstrated a significant reduction in right ventricular global longitudinal strain 24-hour post-closure which was persistent at 1-month follow-up. This reduction is considered as normalisation of the right ventricular function because the hyperkinetic right ventricular wall, especially the apical segments as a result of volume overload improved to become normal.
In the present study, there was an insignificant increase in left ventricular global longitudinal strain in the study group compared to the control group which was due to geometrical changes in left ventricular cavity and mass, which in turn resulted in some hyperkinetic segments before closure. Reference Voigt and Cvijic16 The left ventricular global longitudinal strain was insignificantly reduced 24 hours after atrial septal defect closure followed by a significant increase after 1 month. Such a result usually happens due to the acute unmasking of left ventricular systolic dysfunction after closure due to an increase in the blood volume to the left ventricle as described by Bussadori et al. Reference Bussadori, Oliveira and Arcidiacono18 In contrast to data obtained by Aysel Islamli et al, we documented that the early changes in regional left ventricular strain were mainly involving the basal and lateral wall segments and that the apical and lateral segments improved significantly after 1 month. The reason behind this inhomogeneity in the segmental strain was attributed to the fact that the thickness of basal segments were more than apical ones and the posterior septum was the most affected segment due to the device disc mechanical impact. Reference Van De Bruaene, Buys and Vanhees19
In agreement with the current study, one of the earliest studies on biventricular regional longitudinal strain changes after atrial septal defect device versus surgical closure discovered that the early reduction in the mid- and basal-septal and basal-lateral right ventricular strain was highly significant. Reference Di Salvo, Drago and Pacileo4 Aysel Islamli et al also found that the percutaneous atrial septal defect occlusion reduced the right ventricular septal longitudinal strain and increased the lateral wall strain. Reference İslamlı, Cümşüdov and Bilgin17 Other studies found that the septal +/− lateral right ventricular strains decreased after 24 hours of atrial septal defect device closure and all segments increased again after 1 month of closure. Reference Eroglu, Cakal and Cakal7 Van De Bruaene A et al identified that the apical strain of the right ventricle was higher than the basal one before the closure of atrial septal defect and reduced after the closure due to the discrepancy between the basal and apical segments in thickness. Reference Van De Bruaene, Buys and Vanhees19
In the current study, most right ventricular segments showed significant reduction after device closure due to reduction in volume overload but with different rates. In agreement with earlier findings, our study identified that the apical and lateral wall segments, especially the mid-segment of the right ventricular strain was the most sensitive and specific to right ventricular function than septal one because the septal strain is a shared wall between the left and right ventricles and its changes were related mainly to the mechanical device effect. Reference Eroglu, Cakal and Cakal7 However, the basal inferoseptum segment of the left and right ventricles (interventricular septum) had the highest rate of reduction.
Some reports suggested that the reduction in the interventricular septal mid- and basal-longitudinal strain is related to atrial septal defect device size, location, and distance between the left atrial disc of the atrial septal defect device and basal portion of the mitral valve leaflets Reference Di Salvo, Drago and Pacileo4,Reference Xu, Sun and Zhou20 . In the current study, there was no significant difference in the percent change of biventricular global and regional strain between the two subgroups of large and small devices. The only exception was the presence of strong significant correlation between the device size indexed to body surface area and device size of the large device subgroup and the reduction in the right ventricular global longitudinal strain at 24-hour post-device closure, which means the immediate reduction in right ventricular global longitudinal strain was more with the minimum limit of the indexed large device size (between 1.5 and 3 cm/m2), while the maximum limit of indexed large device size (>3 cm/m2) was associated with less changes in right ventricular global longitudinal strain. We attribute this correlation to the fact that large device represents a surrogate for a large atrial septal defect and hence a more significant right ventricular volume overload. We postulate that larger defects will have more volume overload and will need longer time to normalise. And whether or not the device size has an impact on the delayed normalisation remains an area of further research. Comparing these results with a surgically repaired group of the same defect size is planned to determine whether the delayed normalisation is a matter of the defect or the device size.
Limitations and recommendations
We measured all biventricular changes during the acute stage after atrial septal defect device closure and assume that a longer follow-up duration will support our results. Moreover, we recommend increasing the sample size and recruitment of a younger age group to ensure the absence of confounding age effect, because changes in the left ventricular diastolic and systolic function can be affected not only by the haemodynamic effect of atrial septal defect, but also by age. One of this study limitations also is the significant difference between the patient and control group at the level of body weight and height, which are potential influences on strain measurement for some degree. Furthermore, the strain was only done on one platform and on Qlab software. Therefore, it cannot be generalised to GE and TomTec speckle-tracking software.
Conclusion
The significant right ventricular global longitudinal strain reduction started as early as 1-day post-atrial septal defect transcatheter closure, while the left ventricular global longitudinal strain increased after 1-month and both changes happened irrespective of the device size that was used. The most sensitive segments in the left ventricular longitudinal strain were the lateral and basal ones, while of the right ventricular longitudinal strain were the apical and mid-lateral segments. After atrial septal defect device closure, there was an inverse relationship between indexed large device size and right ventricular global longitudinal strain changes which may reflect the impact of closure of significant shunt on the right ventricular global longitudinal function and not a direct effect of a large device used.
Acknowledgements
The authors wish to thank all members of cardiology departments of Ain Shams and Assiut University Hospitals for echocardiography images.
Financial support
The authors received no specific funding for this study.
Conflicts of interest
The authors declare that they have no conflicts of interest.
Ethical standards
This study was approved by Assiut University ethical committee with IRB no: 17200354. Informed consent was obtained from all patients and their guardians in case of patients aged <18 years. The ethical considerations were assured in the current study.