It is well known that a sizeable number of children experience atypical language development despite the absence of any apparent neurobiological pathology. The term most commonly used to refer to a developmental (rather than acquired) disorder of language acquisition is specific language impairment (SLI; e.g., Bishop, Reference Bishop1992; Leonard, Reference Leonard1998; Tomblin et al., Reference Tomblin, Records, Buckwalter, Zhang, Smith and O'Brien1997). The term “specific” refers to the presumption that the impairment of language occurs in otherwise normal development (i.e., typical level of intelligence and no obvious sensory-motor deficiencies), even though the specificity of the language impairment in SLI has been questioned (e.g., Bishop, Reference Bishop1994; Hill, Reference Hill2001; Plante, Reference Plante1998; Ullman & Pierpont, Reference Ullman and Pierpont2005). Other terms are also used including developmental language impairment, developmental dysphasia, or developmental language disorder (DLD). Throughout this article, we will use the term DLD with an understanding that it is similar to the categories of expressive and mixed expressive-receptive language disorders in the Diagnostic and Statistical Manual, Fourth Edition (DSM-IV; American Psychiatric Association, 1994), which suggests the diagnosis of pervasive developmental disorders as an exclusionary criterion, and requires that if mental retardation, sensory deficits or environmental deprivation are present, language difficulties be greater than what is typically associated with these conditions.
The variety of labels used in research, clinical, and educational literature reflects the challenges in precisely defining the DLD phenotype and understanding its neurobiological causes, cognitive underpinnings, and the relationship with other developmental disorders. A major reason for the existing disagreements in terminology and deficit description, as has been widely acknowledged, is the complex multivariate nature of the disorder and its considerable heterogeneity, that is, the variability in the linguistic and cognitive profiles, severity of the deficits across individuals, and causal pathways.
Because DLD diagnosis is based on broad exclusionary criteria, children included in the category exhibit a wide range of symptoms. Thus, DLD features may include any or all of the following: smaller, compared to typically developing peers, receptive and expressive vocabulary (for a review, see Brackenbury & Pye, Reference Brackenbury and Pye2005), word-finding difficulties (e.g., McGregor, Newman, Reilly, & Capóne, Reference McGregor, Newman, Reilly and Capone2002), omission or incorrect use of morphological forms marking syntactic relationships in a sentence (e.g., Leonard et al., Reference Leonard, Deevy, Miller, Rauf, Charest and Robert2003; Rice & Oetting, 1993; Rice & Wexler, Reference Rice and Wexler1996), low syntactic complexity (e.g., Marinelle, Reference Marinellie2004; Skarakis-Doyle & Mentis, Reference Skarakis-Doyle, Mentis and Gallagher1991), difficulty producing or comprehending certain syntactic structures, such as wh-questions (e.g., Deevy & Leonard, Reference Deevy and Leonard2004; Friedmann & Novogrodsky, Reference Friedmann and Novogrodsky2004; Hansson & Nettelbladt, Reference Hansson and Nettelbladt2006; van der Lely & Battell, Reference van der Lely and Battell2003), verbal passives (e.g., Leonard, Wong, Deevy, Stokes, & Fletcher, Reference Leonard, Wong, Deevy, Stokes and Fletcher2006; Marshall, Marinis, & van der Lely, 2006, van der Lely, Reference van der Lely1996) and relative clauses (e.g., Friedman & Novogrodsky, Reference Friedmann and Novogrodsky2004; Håkansson & Hansson, Reference Hakansson and Hansson2000; Schuele & Nicholls, Reference Schuele and Nicholls2001; Stavrakaki, Reference Stavrakaki2001). In addition, although DLD is distinguished from disorders in which the primary deficit is in articulation and pragmatics, both articulation (Maillart & Parisse, Reference Maillart and Parisse2006; Roberts, Rescorla, Giroux, & Stevens, Reference Roberts, Rescorla, Giroux and Stevens1998) and pragmatic deficits (Bishop, Chan, Adams, Hartley, & Weir, Reference Bishop, Bright, James, Bishop and van der Lely2000) have been reported as part of the DLD profile. Furthermore, individuals with spoken language impairments may also exhibit deficits in areas outside of language proper, such as auditory perception (e.g., Tallal, Stark, Kallman, & Mellits, Reference Tallal, Stark, Kallman and Mellits1981; Wright et al., Reference Wright, Bowen and Zecker1997; for a review, see Rosen, Reference Rosen2003), motor control (Hill, Reference Hill2001), and social cognition (Miller, Reference Miller2001; Rakhlin et al., Reference Rakhlin, Kornilov, Reich, Babyonyshev, Koposov and Grigorenko2011). To complicate matters even further, the DLD phenotype exhibits considerable developmental variability due to changes that occur throughout the life span (Leonard, Reference Leonard1998).
Because of its heterogeneity and a lack of obvious biological markers, the search for genetic, neurobiological, and cognitive bases of the disorder has proven to be complicated. Thus, studies revealed that incidence of a positive family history of DLD for probands was four times higher than for their typically developing counterparts (Stromswold, Reference Stromswold1998; Tallal et al., Reference Tallal, Hirsch, Realpe-Bonilla, Miller, Brzustowicz and Flax2001), and the concordance rate for the disorder almost twice as great for monozygotic as for dizygotic twins (Bishop, North, & Donlan, Reference Bishop, North and Donlan1995; Stromswold, Reference Stromswold2001), with reported heritability estimates ranging from 0.50 to 0.75 for school-aged children (for a review, see Bishop, Reference Bishop2002). Likewise, adoption studies showed that a positive history of DLD in biological parents was associated with a significant increase in a child's risk of developing the same types of problems, even if the child was living with adoptive parents; in contrast, there was no risk increase for adopted children as a consequence of living with affected parents (Felsenfeld & Plomin, Reference Felsenfeld and Plomin1997). However, despite strong evidence for a genetic etiology of DLD, investigations of the patterns of inheritance did not reveal any known dominant or recessive pattern in any of the studies, with the exception of the well-publicized case of a three-generational KE family (Lai, Fisher, Hurst, Vargha-Khadem, & Monaco, Reference Lai, Fisher, Hurst, Vargha-Khadem and Monaco2001; cf. also Addis et al., Reference Addis, Friederici, Kotz, Sabisch, Barry and Richter2010) suggesting that typical DLD is a complex common genetic disorder, and the task of finding the susceptibility genes would not be straightforward.
Another level of difficulty in understanding the nature of DLD involves identifying core causal deficit(s) underlying the range of phenotypes observed in children with DLD. The two major views are represented by those who maintain that grammatical deficits in DLD stem from an anomaly in the child's neurobiological system specialized for grammar representation (the so-called domain specific approach: e.g., Gopnik & Crago, Reference Gopnik and Crago1991; Rice & Wexler, Reference Rice and Wexler1996; van der Lely, Reference van der Lely2005) and those who claim that they are secondary to impairments in the capacity for processing linguistic input (e.g., Leonard, Reference Leonard1998; Tallal & Piercy, Reference Tallal and Piercy1973), with substantial empirical support offered for both views. Recently, at least among the proponents of the domain-specific view, the approach has been to accommodate conflicting empirical findings by adopting a fractionating approach to DLD and report on groups of children with a circumscribed set of language deficits (e.g., Friedman & Novogrodsky, Reference Friedmann and Novogrodsky2011; Parisse & Maillart, Reference Parisse and Maillart2009; van der Lely, Rosen, & McClelland, Reference van der Lely, Rosen and McClelland1998; but cf. Bishop, Bright, James, Bishop, & van der Lely, Reference Bishop, Bright, James, Bishop and van der Lely2000). However, whether DLD is better understood as an umbrella term for distinct syndromes (i.e., as a constellation of discrete disorder subtypes, each with potentially distinct causes and core deficits), or a single diverse spectrum disorder remains unclear. Although this question remains unresolved, the search for the core deficits will remain difficult.
Thus, there remains an important goal of finding new lines of evidence able to clarify what lies underneath the substantial diversity of DLD profiles and whether and how it is linked to a comparable diversity at the level of cognitive processes, neurobiology, and genes. The present study aims to contribute to this goal by presenting data from a geographically isolated Russian-speaking population (AZFootnote 1) with an atypically high rate of DLD, comparing the prevalence of DLD in this population with a comparison population matched on environmental characteristics. We hypothesize that the high frequency of DLD we observe in the population of interest is attributable, at least in part, to its unique genetic makeup, as unusual disease or disorder frequencies are a common feature of geographically isolated populations (Kere, Reference Kere2001). Because of the high degree of environmental and genetic homogeneity, we conjecture that the language phenotype observed in the population has a single, albeit complex, etiology. Yet, despite of the common origin, the phenotype observed across individuals and across generations in the population is highly heterogeneous and individual profiles do not breed true. We argue that this situation supports the view of DLD as a complex spectrum syndrome rather than a constellation of discrete subtypes (although, it is, of course, compatible with the existence of additional types of DLD due to phenocopy; that is, additional types of DLD similar in their surface manifestations but with a different etiology).
The second goal we pursue in the current study is to examine the specifics of language functioning of children with and without DLD in the population of interest with a range of nonverbal cognitive functioning and phonological short-term memory (STM) and to investigate to what extent individual differences in the latter affect a child's language development.
There is a growing body of research reporting memory deficits and lower scores on standardized cognitive assessments in children with DLD compared to their typically developing age peers (e.g., Archibald & Gathercole Reference Archibald and Gathercole2007; Bavin, Wilson, Maruff, & Sleeman, Reference Bavin, Wilson, Maruff and Sleeman2005; Bracken & McCallum, Reference Bracken and McCalum1998). These findings suggest that language deficits may be attributable to deficient short-term or working verbal or phonological memory, typically measured with a test of nonword repetition (NWR; Conti-Ramsden, Botting, & Faragher, Reference Conti-Ramsden, Botting and Faragher2001; Gathercole & Baddeley, Reference Gathercole and Baddeley1990).
According to numerous studies conducted in a number of languages, individuals with DLD underperform on the accuracy of NWR compared to their typically developing age peers (for a meta-analysis, see Graf Estes, Evans, & Else-Quest, Reference Graf Estes, Evans and Else-Quest2007). The finding of poor performance on NWR by children with DLD has been so consistent that it was proposed as a clinical marker of DLD (Conti-Ramsden et al., Reference Conti-Ramsden, Botting and Faragher2001), which led to theoretical accounts seeking to derive the broad DLD phenotype from a single core deficit in phonological STM (e.g., Archibald & Gathercole, Reference Archibald and Gathercole2006; Botting & Conti-Ramsden, Reference Botting and Conti-Ramsden2001; Conti-Ramsden & Durkin, Reference Conti-Ramsden and Durkin2007; Conti-Ramsden et al., Reference Conti-Ramsden, Botting and Faragher2001; Gathercole & Baddeley, Reference Gathercole and Baddeley1990).
This account was boosted by studies of DLD and related disorders that featured phonological memory as a productive phenotype for behavior– and molecular–genetic research. Thus, deficient performance on NWR was shown to be strongly related to low NWR scores of first-degree relatives in family studies (Falcaro et al., Reference Falcaro, Pickles, Newbury, Addis, Banfield and Fisher2008) and heritable in twin studies (e.g., Bishop et al., Reference Bishop, North and Donlan1995; Bishop, Adams, & Norbury, Reference Bishop, Adams and Norbury2006) with heritability estimates around 0.50 (reported in Newbury, Bishop, & Monaco, Reference Newbury, Bishop and Monaco2005). In addition, molecular genetic studies have reported a linkage of the NWR phenotype to a region on chromosome 16q (SLI1; Falcaro et al., Reference Falcaro, Pickles, Newbury, Addis, Banfield and Fisher2008; SLI Consortium, 2002, 2004). Furthermore, a targeted association was revealed for two genes in the SLI1 region (CMIP and ATP2C2), which are known to be expressed in the brain and involved in the neuronal processes implicated in memory and language (Newbury et al., Reference Newbury, Winchester, Addis, Paracchini, Buckingham and Clark2009). Thus, phonological STM as indexed by NWR has been systematically implicated in DLD.
It is interesting that, underscoring the genetic complexity of the disorder, neither of the two genes found to be associated with differences in NWR performance (CMIP nor ATP2C2) were identified as a target in an association study looking for genes regulated by FOXP2, connected with the case of a monogenic speech and language disorder in the KE family (Lai et al., Reference Lai, Fisher, Hurst, Vargha-Khadem and Monaco2001). Instead, a significant association was found between performance on NWR (as well as other linguistic measures) and CNTNAP2, a gene on chromosome 7q35, the expression of which is downregulated by FOXP2 (Vernes et al., Reference Vernes, Newbury, Brett, Abrahams, Nicod and Groszer2008). These findings indicate that there may exist multiple pathways important for the normal development of phonological memory and language in general (for a review, see Newbury et al., Reference Newbury, Bishop and Monaco2005; Newbury & Monaco, Reference Newbury and Monaco2010) and, once again, reaffirm the observation in the literature pertaining to the considerable heterogeneity of the disorder.
Another important observation is that not only may there be multiple pathways for the development of phonological STM, an important language-related cognitive factor, but there may also be additional elements consistently implicated in DLD, and phonological STM deficits may be unlikely to solely explain the range of language profiles observed among children diagnosed with DLD. For example, behavioral and molecular genetic studies that included both NWR and measures of grammatical tense marking, also proposed as a clinical DLD marker (Rice & Wexler, Reference Rice and Wexler1996), demonstrated that the two markers differed in the pattern of familial aggregation and appeared to be under different genetic influences (Bishop et al., Reference Bishop, Adams and Norbury2006; Falcaro et al., 2007), suggesting that DLD cannot be reduced to a single core impairment and may be a result of deficits in multiple domains with distinct genetic etiology. If this is correct, it is likely that deficient performance on NWR is not a sufficient condition for developing DLD (at least in a subset of cases). Whether it is a necessary component of DLD still remains to be ascertained (cf. van der Lely & Howard, Reference van der Lely and Howard1993). We will present evidence that, although in our study the group with DLD differed from the typically developing group in their accuracy of NWR, the magnitude of the difference was small, suggesting that additional factors must be responsible for the group differences in language development.
An additional issue debated in the DLD literature is the relationship between language impairments and nonverbal IQ. The presence of nonverbal IQ scores within the norm range is a widely accepted criterion for DLD. The main purpose of applying this criterion is to avoid confounding impaired language with mental retardation. However, a more stringent criterion of an IQ score of at least 85 has become common among researchers. Thus, Plante (Reference Plante1998) reported that almost half of all studies published in the Journal of Speech and Hearing Research, American Journal of Speech–Language Pathology, and Language, Speech, and Hearing Services in Schools between January 1995 and August 1997 used this criterion, thus leaving out a large number of language-impaired children with IQs below 85 but above the cutoff for mental retardation (70 ± 5; DSM-IV, American Psychiatric Association, 1994). Applying the stringent IQ criterion may arguably hamper the generalizability of findings to the full range of language-impaired children (Plante, Reference Plante1998).
For example, in children ascertained for DLD using a cutoff of 1 SD below the mean on standardized tests of nonverbal cognition (i.e., IQ of 85), performance on morphosyntactic measures, such as the use of correct tense marking, and their growth in usage over time, has been shown not to be related to IQ (Rice, Wexler, & Hershberger, Reference Rice, Wexler and Hershberger1998; Rice, Wexler, Marquis, & Hershberger, Reference Rice, Wexler, Marquis and Hershberger2000). However, in studies where the sample includes children with a wider range of IQs, a somewhat different picture emerges. Thus, Conti-Ramsden and colleagues (Reference Conti-Ramsden, Botting and Faragher2001) reported statistically significant, albeit weak, correlations ranging from .19 to .30 between the measures of language functioning (namely, NWR, past tense marking, third person singular marking, and sentence recall), and block design and picture completion subtests of the Weschler Intelligence Scale for Children—III in a sample of 11-year-old language impaired children with nonverbal scores as low as 2 SD below the population norm (i.e., down to 70). It is interesting that, when language functioning was compared between subgroups of children divided according to both their language functioning and nonverbal IQ status (Rice, Tomblin, Hoffman, Richman, & Marquis, Reference Rice, Tomblin, Hoffman, Richman and Marquis2004), the two groups with normal language (above and below a certain IQ cutoff) performed at similar levels on all measures of expressive grammar regardless of the difference in their IQ status (and better than both language-impaired groups), whereas the two language-impaired groups differed from each other, with the low IQ DLD group underperforming in comparison with the normal IQ DLD group (see also Catts, Fey, Tomblin, & Zhang, Reference Catts, Fey, Tomblin and Zhang2002).
These findings suggest that (a) normal IQ does not assure normal language functioning, (b) low IQ is not a sufficient condition for developing language impairment, (c) for children with language impairment having IQ below the norm is a complicating factor associated with more severe language deficits. In sum, there is evidence that language functioning differs among children above and below the commonly adopted IQ cutoff; however, excluding children without mental retardation but with lower IQs from the studied samples obscures the full clinical picture and limits empirical coverage of the finding (see also DeThorne & Watkins, Reference DeThorne and Watkins2006).
The present study addressed the role of nonverbal IQ in DLD by comparing nonverbal IQ scores of DLD and typically developing individuals in the population of interest and examining the magnitude of the difference between the two groups. We report the results in line with the previous findings, which show a significant but small difference between the groups, indicating that deficits in nonverbal cognition are not likely to be a major causal factor in DLD.
To summarize, the substantial heterogeneity of the DLD phenotype coupled with a lack of established cognitive and biological correlates has made the search for the underlying causes of the disorder quite challenging. It is especially difficult to carry out this search in the general population of unrelated individuals because of the considerable diversity of environmental and genetic factors contributing to the phenotypic heterogeneity. Cases of large multigenerational pedigrees with a simple Mendelian pattern of transmission are rare. An important avenue for research aimed at a more precise understanding of the complex DLD phenotype and its genetic basis can be provided by geographically isolated populations, who closely share both their genetic and environmental characteristics and essentially represent a cluster of interconnected extended families, allowing a unique opportunity to look for regularity beneath the surface complexity typically found in DLD. This article presents a quantitative description of the language characteristics of a small geographically isolated Russian-speaking population exhibiting an atypically high prevalence of DLD. We attempt to demonstrate that in this highly genetically and environmentally homogeneous population, the phenotypic profile of the disorder (a) is highly heterogeneous, and (b) cannot be fully explained by the differences in short-term verbal and phonological memory or nonverbal cognition. Given the reported heterogeneity, we propose that a research strategy assuming DLD to be a complex multidimensional disorder with multiple underlying deficits of varying severity may be a productive approach in the quest for genetic and neurobiological correlates of DLD.
OBJECTIVES
The major aims of the reported study were as follows:
1. To assess language functioning of individuals in the small isolated Russian-speaking population (AZ) allegedly exhibiting atypical frequency of DLD, as well as in a comparison population, in the domains of phonetic/prosodic, grammatical, and semantic/pragmatic development using a narrative task.
2. To determine the frequency of various language deficits across the above-mentioned domains in the population of interest relative to the comparison population.
3. To compare preschool and primary school-age children in AZ with children of the same age range from a comparison population on the indices of language development derived from the narrative task across the above-mentioned domains in order to confirm that AZ children significantly underperform on raw measures of narrative performance in comparison to their age peers from a culturally similar population.
4. To compare the same group of AZ children with a group of children from the comparison population matched on mean length of utterance (MLU) in order to quantify the magnitude of the language delay.
5. To evaluate nonverbal cognitive development and verbal and phonological STM in the AZ population in order to quantify the role of these variables in the observed DLD profile.
6. To discuss the patterns of vertical transmission of various aspects of the DLD phenotype with the goal of clarifying whether its diverse clinical manifestations are more compatible with a unitary spectrum condition or multiple discrete subtypes of a complex phenotype.
METHODS
Participants
The AZ population. Participants were recruited from a small remote cluster of villages in Russia's northwestern region. It was identified through an anecdotal referral as a settlement with an unusually frequent occurrence of speech and language problems. Currently, the total number of registered residents is 861, including 118 between the ages of 3 and 18. This population is characterized by a high degree of genetic and environmental uniformity. The residents belong to one ethnicity (Slavic admixed) and closely share their environment: there is one preschool for children 3 to 6 and one secondary school for Grades 1 through high school, the standard organizational structure of Russian education system. Everyone in the village is of a similar socioeconomic status (Russian rural poverty) with an average monthly income per person in the area estimated at $378.Footnote 2
The settlement is located about ~120 km from the nearest train station and away from major highways, and is only connected to the provincial center located 45 km away (population ~11,000) by a dirt road. The nearest major city (population ~350,000) is ~600 km away. The population has been geographically and culturally isolated and small since its establishment, although it has experienced periods of expansion. The settlement was founded in the early 15th century by a small group of nuclear families, who had migrated from another village in the area to escape persecution and were granted ownership of the land. A factor that contributed to the isolation is that the settlements in the area are surrounded by forest and marshland difficult to settle or navigate. The climate is harsh: it is not uncommon for the temperature to drop below freezing in June and August; summers are short and winters are long. However, because of rich soil and abundant resources, the region has been economically self-sufficient and relatively prosperous (prior to the forced collectivization in the Soviet time), which limited the settlers’ need for close contact with outsiders. The region has no industry: the local economy in the early period was based on salt and fur trade; the region was given a state monopoly on salt trade, which brought it considerable prosperity. After the end of the salt monopoly, the area became largely agrarian. At the end of the Soviet period, the agriculture came into severe decline, which led to massive unemployment. Currently, remaining dairy farms, logging, and lumber production are the only sources of reliable employment. In addition, the population relies on small-scale noncommercial fresh water fishing, gathering of wild mushrooms and berries and local crafts.
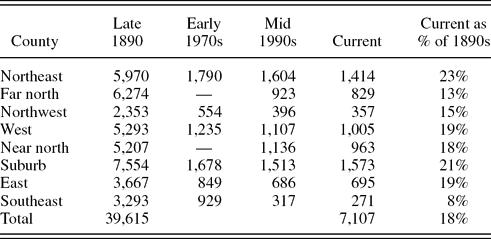
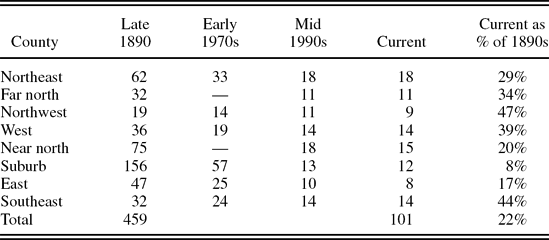
The geographic isolation of the area is exacerbated by the severe depopulation in the region due to a high rate of emigration and a lack of immigration. Many small settlements in the surrounding area have been abandoned and taken over by the forest, further contributing to the isolation of those settlements that remain. As can be seen from Tables 1 and 2, the population and the number of villages in the area has seen a dramatic decline.Footnote 3 Thus, the population of interest has decreased by ~85% over the 1890s–2000s period (including a decrease of 10% from the 1990s to 2000s) and the number of villages in the county where the population resides had a threefold decline. Presently, the average population density in the area is one person per square kilometer.
Population in the rural counties of the district in which the geographically isolated Russian-speaking population was located between the 1890s and 2000s

Note: The real names of the counties in the district are removed from the tables in order to avoid identification.
Number of villages in the rural counties in the district where the geographically isolated Russian-speaking population was located between the 1890s and 2000s
Note: The real names of the counties in the district are removed from the tables in order to avoid identification.
The population has a substantial rate of distant intermarriages, although second-cousin and cousin marriages are avoided for religious reasons. Currently, we have reconstructed a set of multigenerational family units, which includes 6,391 people, approximately 82% of whom are connected through a complex 11-generational pedigree. We estimate that 74.6% of the current residents are connected through this pedigree.
For the purpose of deriving an estimate of the prevalence of DLD in the population of interest, we have collected elicited speech samples from over 700 AZ residents (81% of the total population) over the course of several years as part of a large ongoing epidemiological study. The recruitment was random with a goal of the complete phenotyping of all residents with a resulting rate of missing data (including refusals, individuals who moved away, or the deceased) of about 8% among adults. Thus, language status of around one third of all adults currently residing in AZ was characterized, whereas for adolescents, preschool and primary school the sampling was complete, representing 95% of all children aged 3 through 18.
The analyses reported in this paper are based on speech samples from 328 individuals from the AZ population, including 204 randomly drawn speech samples from adults over 18 (age = 18.83–82.75, M = 44.19, SD = 15.48; 42% male), and almost all of the children age 3 through 18 residing in the village, namely, 46 adolescents (age = 13.42–17.75, M = 15.44, SD = 1.24; 41% male), 48 primary school children (age = 7–12.92, M = 10.03, SD = 1.81; 40% boys) and 30 preschoolers (age = 3.08–6.92, M = 5.25, SD = .98; 63.3% boys).
Given the complicated logistics of the study, we were not able to systematically prescreen the entire study sample for hearing problems, autism, intellectual disability, and genomic disorders. However, there were several procedures that fulfilled that goal. Thus, all children in AZ undergo a mandatory annual health exam by the local nurse practitioner and visiting physicians. Children with severe developmental disabilities are referred to special residential schools because the educational system in Russia does not use the inclusive approach to educating such children. Therefore, because we recruited our sample through the public schools, we relied on this process for screening out children with severe developmental disabilities. In addition, as part of the on-going investigation, all children aged 1 month to 6 years were examined by a clinical geneticist for dysmorphic features, and none were identified. In addition, all children's medical records were examined for hearing problems, and no hearing impairment was documented for any of the children. Finally, a sample of 47 children aged 6 to 15 were screened for hearing loss and all passed the hearing screening at 25 dB (except 1 who passed at 35 dB).
The comparison population. We have recruited a comparison group from a demographically similar population residing in the same administrative region (around 430 km from AZ) and characterized by similar socioeconomic indicators (e.g., the population size of its district, the occupational structure, rates of unemployment; for comparison statistics, see the online supplemental materials), but without geographic isolation: it is a rural agricultural community located near the regional center and connected to it by both a highway and rail.
The comparison sample included 110 individuals: 25 adults over 18 (age = 26.8–65.5, M = 48.19, SD = 11.12; 12% male), 25 adolescents (age = 13.58–17.50, M = 15.24, SD = 1.32; 48% male), 27 primary school children (age = 7.25–12.83, M = 8.96, SD = 1.57; 51.9% boys), and 33 preschoolers (age = 3.42–6.92, M = 5.34, SD = 1.60; 57.6% boys). These preschool, primary school, and adolescent groups represent around 35% of all individuals of that age range in the comparison population. The sample was recruited through the local preschool, primary, and secondary school, and the children were drawn randomly with a target of 30 children per age group.
Data collection
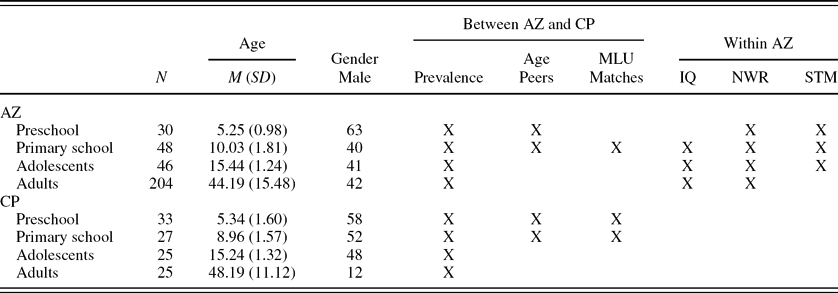
As part of the ongoing investigation, all available individuals from the AZ population willing to participate were given a narrative task and a number of cognitive tasks described below, with a special focus on children between the ages of 4 and 18 (preschool through high school age). Because of the complexities of the data collections conducted in multiple waves over a period of time, it was not possible to administer all measures to all of the participants. Thus, we will be presenting the results of the comparisons between the AZ and the comparison population, and between impaired and unimpaired groups within the AZ population, that were based on subsamples drawn from the total sample of individuals for whom the language status was determined on the basis of a narrative task. The groups included in each analysis are given in Table 3.
Study groups demographics and design for between- and within-population analyses
Note: AZ, geographically isolated Russian-speaking population; CP, comparison population; MLU, mean length of utterance; NWR, nonword repetition; STM, short-term memory. Total N represents the numbers for each of the age groups for both populations whose language status was assessed and from which the participants were drawn for between- and within-population analyses (X).
Measures
The narrative task. As the main tool of the language assessment, we used an elicited narrative task because there are currently no standardized and validated clinical language assessments available in Russian, and narratives have been reported to be a valid measure of language development in typically developing children and clinical populations (e.g., Botting, Reference Botting2002; Norbury & Bishop, Reference Norbury and Bishop2003).
Narrative collection, transcription, and scoring. With adults, semistructured personal interviews were conducted in their homes. The script included questions regarding biographical and family information, occupation, local history, and traditions. The preschoolers and school-aged children were assessed at school using two wordless storybooks each: (for children below 13, The Frog Book series, Meyer, 1969; for adolescents, Free Fall, Wiesner, 2008, and Tuesday, Wiesner, 1997). The interviews were transcribed by Russian native speakers using Cyrillic alphabet and reflected the pronunciation idiosyncrasies. A separate group of Russian native speakers transcribed children's narratives from both populations as opposed to those of adults. All transcripts were double checked and corrected if necessary by two native-Russian speaking clinical linguists, who used both the audio and the transcript during the manual scoring procedure, and who went through multiple rounds of the agreement training.
Both the audio and the transcripts were used together to rate each narrative on a comprehensive set of facets that could be scored quantitatively in the phonological, syntactic, and semantic/pragmatic domains, namely, phonetic and prosodic characteristics, well-formedness, syntactic complexity, narrative quality, and semantic/pragmatic characteristics. The affectedness status was determined by using the cutoff criterion of performance at 1 SD below the mean of the age peer sample from the comparison population after the age was regressed out from the continuous measures that showed to be related to age. Each domain (phonetic/prosodic characteristics, well-formedness, syntactic complexity, narrative quality, and semantics/pragmatics) included a number of subscales, as follows.
Phonetic/prosodic characteristics. Overall phonetic/prosodic ratings were determined on the basis of the following subscales:
• phonological simplifications, such as sound deletions or distortions, which make the speech sound imprecisely articulated, slurred or unclear, including consonant cluster simplification, vowel reduction, syllable deletion, lenition, and so on;
• misarticulations, such as sound substitutions, metathesis, loss (or incorrect presence) of phonemic palatalization;
• prosodic abnormality, which is inappropriate intonation contour and/or sentential stress, abnormal rate of speech, abnormal volume, excessive number and duration of pauses, halting or belabored speech; and
• word stress, which is deviant word-level stress patterns.
Each individual was rated as 1 (affected), 2 (mildly affected), or 3 (unaffected) based on the severity and frequency of each characteristic. A rating of 1 indicated severe and moderate frequent errors, 2 indicated moderate occasional/infrequent or mild but frequent errors, and 3 indicated at most mild occasional/infrequent errors. An overall phonetic rating was determined based on the subscales. An individual was rated as overall affected on phonetic/prosodic characteristics if he or she received a rating of “mildly” or “mildly affected” on at least two of the subscales or “severely affected” on at least one.
Measure of well-formedness. The overall rating of well-formedness was derived based on two subscales: the number of errors (both grammatical and lexical) and the number of false starts. The errors included case and declension, optional infinitives, agreement, tense and aspect, lexical errors, and so forth. The false starts included repetitions, self-corrections, self-interruptions, and so forth (see online supplemental materials for the examples of each type of errors and false starts). The combined number of errors and false starts divided by the number of words in the narrative was used to derive a measure of well-formedness adjusted for the length of the narrative. The individuals were rated as affected on well-formedness if they performed at least 1 SD below the mean of the comparison sample.
Measure of syntactic complexity. The rating of syntactic complexity was obtained based on two subscales: the number of complex structures and mean length of utterance in words (MLUW). The former was a measure of complex syntax, in which the number of the complex structures of various types including verb-complement clauses (both finite and nonfinite), relative clauses, coordinated clauses, nonformulaic wh-questions, participial constructions, and passives was divided by the number of words to derive a measure of syntactic complexity adjusted for the length of the narrative. The individuals were rated as affected on syntactic complexity if they performed at least 1 SD below the mean of the comparison sample on both subscales. An example of a low-complexity narrative can be found in the online supplemental materials.
Semantic/pragmatic characteristics. The overall semantic/pragmatic rating was derived from the subscales of semantic/pragmatic errors and lexical richness (except for adults, for whom lexical richness was not assessed). Semantic/pragmatic error rating was derived from the number of errors that disrupt meaning of a sentence making it uninterpretable. These errors included the following:
• ambiguous pronoun reference (e.g., “The dog and the boy were looking for the frog. He looked in a beehive”);
• shifting of the topic abruptly, without providing a linguistic signal of the shift or not establishing common ground before referring to a new participant or event (e.g., “They are burying the turtle. The turtle is carrying him on its back” [omitting the discovery that the turtle turned out to be alive]);
• presupposition failure (e.g., using “tozhe” [also] in contexts in which no one else performed the same action); and
• any other abnormality of meaning.
The total number of errors was divided by the number of words in the narrative in order to obtain a measure of semantic errors adjusted by the length of the narrative. Each narrative was also rated on the number of distinct lexemes contained in the 100 words of the narrative. The individuals were rated as affected on semantic/pragmatic characteristics if they performed at least 1 SD below the mean of the comparison sample on both subscales.
Narrative quality. The overall narrative quality was assessed on the basis of two subscales: elaboration and narrative structure. On the elaboration scale, the narrative was rated 1 if it contained very sparse output, namely, responses consisting mostly of single phrases/sentences, and required a lot of prompting from the interviewer. It was rated 2 if responses were somewhat expanded, but information was still limited to a minimum. It was rated as 3 if the output was judged to be adequate and the information flow did not require a lot of prompting from the interviewer.
Finally, each child and teen narrative was rated on a scale of 1 to 3 for the narrative structure; that is, the ability to tell a connected story with characters, a plot, a sequence of events, and a well-defined beginning and ending. A narrative was rated 1 if the child used single nouns or descriptions of events in the present tense with no attempt to connect them, with mental state verbs generally absent. A narrative was rated 2 if the child used descriptions of events in the past tense, arranged in a temporal or causal sequence, used mental state verbs frequently and appropriately. It was rated 3 if the child used a well-defined plot, with events arranged in logical temporal or causal sequences, the narrative had an introduction in the beginning of the story and a resolution at the end. The measure of narrative quality was not used with the preschool children and with adult narratives.
Based on the elaboration and narrative structure subscales, an overall rating of affected on narrative quality was derived. The rating “affected” was assigned if the speaker received the total combined score of 3 or less.
Overall status. Based on the individual subscales, the members of the population were rated as either impaired or unimpaired in each of the five language domains described above. The individuals were classified as having a DLD if they displayed two or more impaired language domains.
Interrater agreement. The scoring was done taking the features of the local dialect into consideration. The local dialect (Pomorsky dialect) is a group of Northern Russian dialects spoken along the White Sea coast and along the rivers of the White Sea basin. A detailed description of the main features of the dialect are beyond the scope of the article, but are well described in Samorodova (Reference Samorodova2004). In brief, along with certain morphological forms, a number of archaisms and borrowings from Finno-Ugric and Scandinavian languages, its major distinctive characteristic is the so-called “okanije” or pronouncing unstressed vowels [a] and [e] as [o], instead of as [∂] and [i], as in standard Russian (Post, Reference Post2006; Samorodova, Reference Samorodova2004). The dialect has been undergoing a substantial degree of leveling, as a result of the influences of standard Russian (the so-called Russian literary language). Consequently, the dialectal characteristics are prominent only among individuals over 60, with only traces of them observed among those under 22 (Samorodova, Reference Samorodova2004). Using a comparison group from a rural population residing in the same area and speaking the same dialect helped us separate nonstandard features of grammar and phonetics (i.e., those that regularly recurred in the speech of multiple individuals in both populations) from disordered language. Finally, all questionable morphological and lexical forms were checked using dictionaries of the regional dialect (i.e., Moseev, Reference Moseev2005; Podvysotsky, Reference Podvysotskii1885).
The interrater reliability between the two raters who analyzed the narratives ranged across age groups from 73% to 99.2% (M = 82.2%) for phonetic/prosodic characteristics subscales, 83.4% to 89.3% (M = 86.4%) for narrative structure, from Pearson r = .62 to .93 (M = 0.81) for well-formedness, from r = .94 to .98 (M = 0.97) for MLUw, from 0.96 to 0.98 (M = 0.97) for complex structures, from 0.51 to 0.95 (M = 0.72) for semantics and pragmatics measures, and from r = .83 to 1.00 (M = 0.94) for lexical richness. Together, these numbers indicate satisfactory convergence of ratings.
Nonverbal cognitive functioning. We used Cattell's Culture-Fair Intelligence Test (Cattell & Cattell, Reference Cattell and Cattell1963), Scale 2 to evaluate nonverbal cognitive functioning of the population. The Cattell's Culture-Fair Intelligence Test is a group administered paper and pencil test for individuals aged 7 and above. It is a measure of nonverbal fluid intelligence, which is thought to be relatively independent of verbal fluency, cultural background, and educational level. The full battery consists of four subtests all involving geometrical figures (series, classification, matrices, and topology). We used the standardized general IQ score. The sample internal consistency coefficient α for the subtests ranged from 0.83 to 0.93 (M = 0.87).
For preschool children, the nonverbal IQ was measured either by the Mullen Early Scales of Learning (Mullen, Reference Mullen1995; for children under 5) or Universal Non-Verbal Intelligence Test (Bracken & McCallum, Reference Bracken and McCalum1998; for children 5 to 7). The Mullen Early Scales of Learning is a multidimensional individually administered assessment of children's functioning in five domains: gross motor, visual reception, fine motor, expressive and receptive language. We used the standardized visual reception score for the analyses (α = 0.80). The Universal Non-Verbal Intelligence Test is an individually administered assessment with a fully nonverbal administration procedure that requires multiple response modes, including use of manipulatives, paper and pencil and pointing. The extended battery includes six subtests: object memory, spatial memory, symbolic memory, cube design, analogic reasoning, and mazes, with the first three designed to assess memory, and the last three to assess reasoning. The internal consistency α for the subtests ranged from 0.74 to 0.89 (M = 0.85), and the full-scale score was used for the analyses.
Verbal and phonological STM. A nonword repetition test modeled after the Children's Test of Nonword Repetition (Gathercole & Baddeley, Reference Gathercole and Baddeley1996) was designed to provide a measure of phonological working memory (Gathercole & Baddely, Reference Gathercole and Baddeley1990). Each participant was presented with 40 items ranging from two to five syllables in length with an equal number of items of each length. In addition, the complexity of the syllable structure was systematically varied with half of the items containing consonant clusters and with the remaining half containing no clusters. Thus, the syllable complexity of the nonwords ranged from consonant–vowel (CV) and VC syllables, to CVC, and to CVCC or CCVC. The nonwords were presented in random order by a native-Russian speaker of the same regional dialect as the participants using live voice. The live presentation rather than a recording was used in order to make sure that the child's attention was engaged before presenting an item (as recommended by Adams and Gathercole, Reference Adams and Gathercole1995, Reference Adams and Gathercole1996). The test was scored “on-line” with each item judged as correctly or incorrectly repeated. If an item was repeated incorrectly, the child was given a chance to try again and a successful second trial was counted as a correct response in the total correct score. This resulted in a total score of number correct out of 40. The internal consistency of the test was high with α = 0.81.
Children were also administered a series of tests measuring their STM. The two measures used were the word and the digit span. In the word span (STM words), the child was asked to repeat a series of sequences of unrelated words (the sequence length varied from one to seven words with a total of 21 sequences in blocks of 3; α = 0.70). Both forward and backward digit span (STM numbers) tasks included 16 sequences of digits progressing from two to eight digits in a sequence with a total of 32 sequences in blocks of 2 (α = 0.89). The tests were modeled after the subtests of the Weschler Intelligence Scale for Children—III (Wechsler, Reference Wechsler1991).
RESULTS
Frequency of language impairments in the AZ population
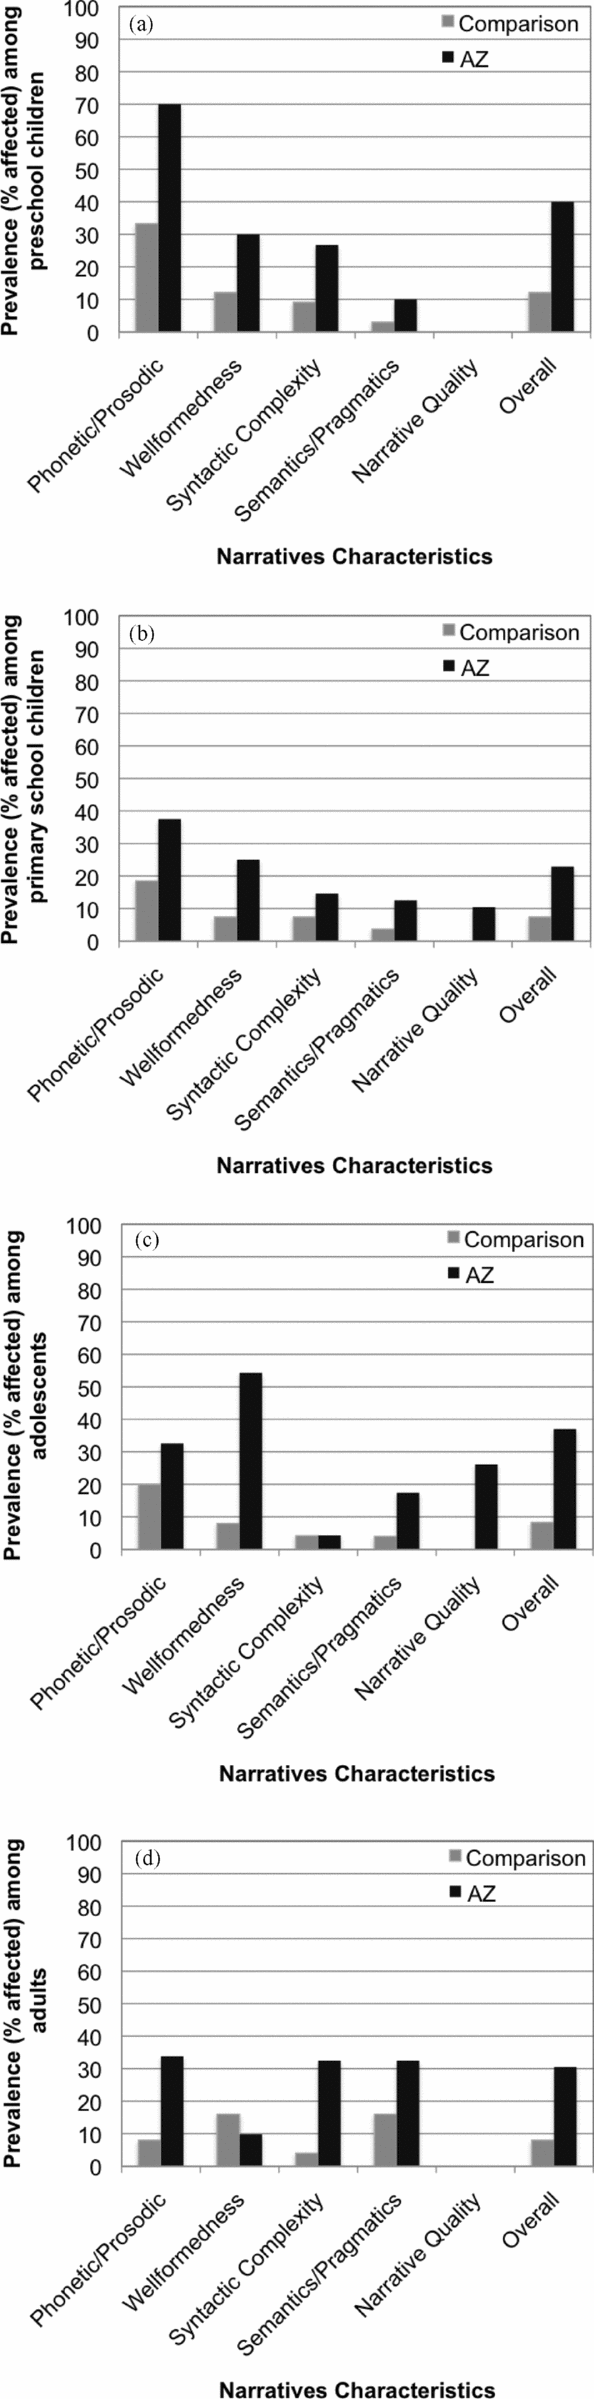
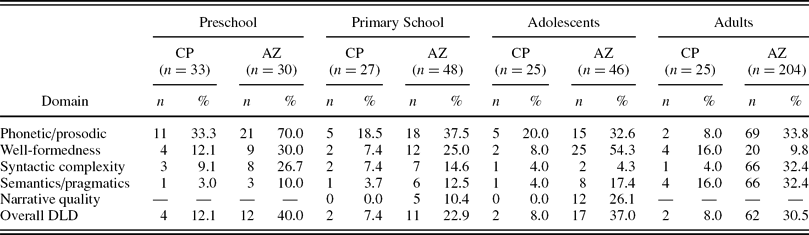
Using the classification described above, we calculated the frequency of impairments in each of the five domains: phonetic/prosodic characteristics, well-formedness, syntactic complexity, narrative quality, and semantics/pragmatics. The prevalence in the population of interest was compared to that in the comparison population. As Figure 1a–d, and Table 4 demonstrate, the AZ population exhibits a substantially elevated rate of impairments across the domains in all age groups. Overall, a total of 22.9% to 40% were classified as affected with DLD across AZ age groups.
The estimated prevalence of developmental language disorder in a geographically isolated Russian-speaking population and a comparison population. The prevalence was estimated for each of the five major domains of narratives characteristics. Individuals were classified as overall affected if they displayed two or more impaired domains. The estimates are presented separately for (a) preschool children, (b) primary school children, (c) adolescents, and (d) adults. The narrative quality measure was not used for preschool children and adults.
Frequency of DLD across language domains in the AZ and CP
Note: DLD, developmental language disorder; AZ, geographically isolated Russian-speaking population; CP, comparison population; n, the total number of children within each age group for each population separately, where the columns indicate the number of children within each age group in each population that were classified as being affected on a specific domain. The percentage columns indicate the prevalence (% total n for each age group). Narrative quality was not assessed for preschool children and adults.
Using the prevalence estimates in both (i.e., the target and comparison) populations, we have calculated odds ratios for the overall impairment status for each age group separately. The analysis yielded an odds ratio [OR] = 4.83 (95% confidence interval [CI] = 1.40–16.42) for the preschool children, OR = 3.72 (95% CI = 0.84–16.08) for the primary school children, OR = 6.45 (95% CI = 1.48–27.39) for adolescents, and OR = 5.02 (95% CI = 1.27–19.72) for adults. Taken together, these values indicate the significantly higher (three to six times) prevalence of DLD in the AZ population relative to the comparison population.
We also investigated gender differences in the rate of DLD in the AZ population. For the preschool children the boys versus girls OR = 1.24 (95% CI = 0.26–5.91), for the primary school children OR = 0.73 (95% CI = 0.19–2.85), for the teenagers, OR = 1.49 (95 CI = 0.43–5.12), for the adults OR = 0.31 (95% CI = 0.17–0.58). Thus, we did not find any significant differences between the prevalence of DLD in boys versus girls in the population for three younger groups. However, among adults, women were more likely to be classified as having the disorder than men, contrary to other findings reported in the literature.
Quantitative differences between AZ children and children from the comparison population
In order to investigate language functioning in the AZ population, we compared the raw scores of the narrative task measures in the AZ children and their age peers and language matches from the comparison population.
For these analyses we used the language data from 135 children aged 3 to 13 from both populations (see Table 3). These included 75 children from the AZ population (age, M = 8.22, SD = 2.79; 51% boys) and their age peers from the comparison population (age, M = 6.88, SD = 2.16; 53% boys). Nonverbal IQ data were available for 73 out of the 75 AZ children (M = 90.40, SD = 14.90) and for 56 out of the 58 children from the comparison group (M = 97.93, SD = 13.14). The groups differed in age, with the comparison group children being significantly younger than the AZ group, F (1, 131) = 9.01, p < .01, ηpartial2 = 0.06, and the former outperforming the latter on the IQ measures, F (1, 127) = 8.96, p < .01, ηpartial2 = 0.07.
Three sets of univariate analyses of variance were performed. First, we compared the two groups on their raw performance on the narratives measures controlling for age (with a set of univariate analyses of covariance). Second, we compared the two groups on their raw performance on the narrative measures controlling for age and IQ. Third, from the sample described above we selected 46 AZ children between the ages of 7 and 13 and 50 children from the comparison group matched to the AZ group on MLUw, F (1, 94) = 0.01, p > .05, ηpartial2 < 0.0001, and compared them on age and the rest of narrative scales used in the study.
The first analysis has revealed a significant main effect of group status for the measures of well-formedness, F (1, 130) = 7.66, p < .01, ηpartial2 = 0.06, number of complex structures, F (1, 130) = 16.60, p < .001, ηpartial2 = 0.11, MLUw, F (1, 130) = 18.27, p < .001, ηpartial2 = 0.12, semantic and pragmatic errors, F (1, 130) = 13.72, p < .001, ηpartial2 = 0.10, and lexical richness, F (1, 130) = 18.39, p < .001, ηpartial2 = 0.12, indicating that when controlled for age, the comparison group outperformed the AZ group on all measures. The analysis of contingency between the phonology affectedness and group status indicated a significant association between the two, χ2 (1) = 7.57, p < .01, Cramer V = 0.24, with more phonologically affected children in AZ.
The second analysis (controlling for both age and IQ) has revealed a significant main effect of group status for the measures of well-formedness, F (1, 125) = 5.04, p < .05, ηpartial2 = 0.04, number of complex structures, F (1, 125) = 12.72, p < .001, ηpartial2 = 0.09, MLUw, F (1, 125) = 14.24, p < .001, ηpartial2 = 0.10, semantic and pragmatic errors, F (1, 125) = 7.87, p < .01, ηpartial2 = 0.06, and lexical richness, F (1, 125) = 13.24, p < .001, ηpartial2 = 0.10, also indicating that when controlled for age and IQ, the comparison group outperformed the AZ group on all measures. The analyses held when children with low nonverbal IQ scores (<80) were excluded.
The third set of analyses compared 46 AZ children aged 7 to 13 and their MLUw matches (n = 50) from the comparison group, yielding no significant differences for the number of complex structures, F (1, 94) = 0.22, p > .05, ηpartial2 = 0.002, well-formedness, F (1, 94) = 0.03, p > .05, ηpartial2 < 0.0001, semantic/pragmatic errors, F (1, 94) = 0.24, p > .05, ηpartial2 = 0.003, and lexical richness, F (1, 94) = .45, p > .05, ηpartial2 = 0.005, indicating that the groups were matched on all the language measures. The groups drastically differed in age, F (1, 94) = 69.53, p < .001, ηpartial2 = 0.43, with AZ children (M = 10.06, SD = 1.79) being around 3.5 years older than the control children (M = 6.73, SD = 2.10), exemplifying the severity of the delay in language development in AZ children.
The relationship between nonverbal cognition and language functioning within the AZ population
For the purpose of investigating the differences in nonverbal cognitive functioning between individuals affected and unaffected with DLD, 176 AZ individuals age 7.42 to 56.67 (M = 17.72, SD = 9.04; 44.3% males) were administered the Cattell's Culture-Fair Intelligence Test Scale 2 (Cattell & Cattell, 1973). Of these, 43 were classified as affected and 133 as unaffected. The groups were not statistically different on age, F (1, 174) = 1.62, p > .05, ηpartial2 = 0.01, and there was a small but statistically significant difference in IQ between the groups, with the affected group underperforming (M = 89.51, SD = 12.29) in comparison with the unaffected group (M = 93.94, SD = 11.83). This effect, although statistically significant, F (1, 174) = 4.47, p < .05, was not substantial in magnitude (ηpartial2 = 0.02).
The relationship between short-term verbal and phonological memory and language functioning within the AZ population
A sample of 199 AZ individuals aged 7.75 to 68.75 (M = 22.28, SD = 14.90; 40.2% male) was administered the NWR task. Of these, 47 were classified as overall affected and 152 as unaffected. The groups were matched on age, F (1, 197) = 1.57, p > .05, ηpartial2 = 0.01. The unaffected group significantly outperformed the affected group on the NWR measure, F (1, 197) = 6.48, p < .05, ηpartial2 = 0.03, but the effect was again not substantial in magnitude.
Another sample of 97 AZ children aged 4.08 to 18 (M = 11.69, SD = 3.97; 49.5% male) was administered the measures of digit span and word span. The affected (n = 28) and unaffected (n = 69) were matched on age, F (1, 95) = .28, p > .05, ηpartial2 = 0.003. The analysis revealed a marginally significant difference between the affected and the unaffected groups on the measures of word span, F (1, 95) = 3.51, p = .06, ηpartial2 = 0.04, and digit span, F (1, 95) = 3.37, p = .07, ηpartial2 = 0.03. These differences were of nonsubstantial magnitude, similar to that found for the NWR task as reported above.
DISCUSSION
Prevalence of DLD in the AZ population
In the present article we have described a small geographically isolated population characterized by an atypically high prevalence of language disorders in all age groups from preschoolers to adults. When contrasted with a comparison population, which exhibits rates of DLD similar to what has been reported previously for the general population in other countries (e.g., Horwitz et al., Reference Horwitz, Irwin, Briggs-Gowan, Bosson Heenan, Mendoza and Carter2003; Tomblin et al., Reference Tomblin, Records, Buckwalter, Zhang, Smith and O'Brien1997), we found that although the frequency of the overall impaired status in the comparison population ranges between 7% and 12% across the age groups, in the AZ population it ranges between 23% and 40%. The differences are even greater in certain individual domains (e.g., in adolescents, 8% for well-formedness in the comparison population versus 54.3% in AZ).
The elevated frequency of DLD in a population that matches the comparison sample on socioeconomic status and cultural characteristics indicates that environmental factors alone do not account for the increased risk of developing the disorder and strongly suggests a genetic risk factor shared by the members of the population. Although we lack direct genetic evidence at this point, given the history of the population discussed above, its isolation and lack of migration into the population, it is plausible that the increased rate of DLD in the AZ population has a genetic basis, with the genetic risk factor likely present in the initial settlers and carried through the multiple generations via the founder effect. The founder effect implies that a small number of individuals had a significant and lasting effect on the gene pool of a population (Kere, Reference Kere2001), which can manifest itself as an unexpected frequency of certain diseases in a population, namely, exceptionally high or exceptionally low frequency compared with other populations.
It is important to note that we found higher rates of language impairments in preschoolers compared to other age groups. It is unclear whether the differences are due to the developmental trajectory of the disorder abating at a certain age, individuals developing compensatory strategies with age, or the impact of some other protective or remediating factors. Thus, there may be an ameliorating influence of schooling. It is important to note that due to mandatory secondary education laws in Russia, all individuals in AZ (except some of the older adults) have at least 9 years of schooling, with the majority completing high school (currently 11 years) plus technical or trade school (typically a 2-year degree that results in a professional certification). There are also individuals with college degrees. All healthy men over 18 complete military service outside of their geographic area. Thus, as recognized in the literature (Fidler, Plante, & Vance, Reference Fidler, Plante and Vance2011; Tomblin, Freese, & Records, Reference Tomblin, Freese and Records1992), diagnosing residual deficits in adults requires measures with high sensitivity. However, because even in adults we found an increased rate of the disorder compared to the controls, we can conclude that our measure was sensitive enough to capture DLD in adults and therefore provide evidence that the condition in question is not a language delay, but a disorder persisting throughout the life span.
It is also of note that we did not find a higher risk for developing DLD in males compared to females. It was surprising that we found a higher risk of being identified as impaired in females than in males for adults. However, the reason for this may simply be a greater reluctance of affected adult males to be interviewed resulting in a higher rate of refusals in that group. In addition, it is possible that previous studies, completed primarily with children, demonstrated a referral bias, with boys being referred more often than girls; perhaps here we were able to get an estimate that better approximates the gender ratio in DLD.
The degree of language deficit in the AZ population
When compared with their age peers from the comparison population residing in the same geographic area, the AZ children displayed marked impairments in all of the examined domains, that is, phonetic/prosodic, well-formedness, syntactic complexity, semantics/pragmatics and narrative quality, which remained even when controlled for age and nonverbal IQ differences. Furthermore, a comparison between the AZ children and their MLUw matches from the comparison population revealed that the two groups performed similarly on all measures, but differed in age by about 3.5 years, indicating a significant developmental delay in the target group.
The role of nonverbal cognition and STM in DLD in the AZ population
We also addressed the question of whether impaired language functioning in the target population is related to nonverbal cognitive functioning and phonological/verbal STM. With respect to nonverbal cognitive functioning, we found a small, but significant difference between the affected and unaffected individuals within the AZ population. This finding is consistent with other studies that did not restrict IQ to greater than 85 or match subjects for mental age, which reported lower nonverbal IQ scores for children with DLD compared to typically developing children (e.g., Botting, Reference Botting2005; Kamhi, Ward, & Mills, Reference Kamhi, Ward and Mills1995; Montgomery, Reference Montgomery1995; Plante & Vance, Reference Plante and Vance1994, 1995; Swisher, Plante, & Lowell, Reference Swisher, Plante and Lowell1994), suggesting that low-average IQ is a common component of the DLD profile. In addition, in line with the previous research, we found that not only does normal nonverbal IQ not guarantee normal language functioning, but low IQ is neither sufficient nor necessary for causing language impairment: the observed relationship between IQ scores and impairment status in the population was of small magnitude (~2% of shared variance), which suggests that other explanatory factors must be implicated in accounting for the linguistic profiles of the impaired group.
A somewhat surprising finding was the low magnitude of the effect sizes observed for phonological and verbal STM (~3% of shared variance). This result substantially diverges from what is typically found in the literature (i.e., a meta-analysis by Graf Estes et al., Reference Graf Estes, Evans and Else-Quest2007, yielded a large mean effect for NWR across 23 studies). This observation can be interpreted in two ways: (a) unlike other types of DLD described in the literature, the language impairment in the AZ population is only weakly related to deficits in phonological memory capacity and is likely to have a multifaceted core deficit profile, in which deficits in phonological STM play a relatively minor role; and (b) because of the unique nature of the AZ population as a genetic isolate with a high degree of interrelatedness, the affected and unaffected members of the population may share the genetic risk factor(s) responsible for lower phonological STM compared with the general population. If the latter is correct, then we would expect a smaller difference between the two groups than is generally reported for unrelated individuals.
Being present as a subclinical trait in unaffected family members of affected individuals is a commonly assumed criterion for endophenotypes, or latent traits underlying overt clinical phenotypes of complex disorders, posited as a link between the latter and their genetic causes (e.g., Cannon & Keller, Reference Cannon and Keller2006; Gottesman & Gould, Reference Gottesman and Gould2003). The endophenotype concept was developed in the 1980s based on the multifactorial threshold model proposed for diabetes (Falconer, Reference Falconer1965) and adopted for complex psychiatric disorders. This model assumes that (a) multiple factors contribute to a disorder; (b) the effects of a single factor are small, but the effects of multiple factors add up; and (c) once the additive effects pass a certain threshold value, the individual begins to exhibit the clinical phenotype of the disorder.
The advantage of this model is that it has the potential to clarify complex pathways between disease phenotypes and their genetic causes by introducing intermediate phenotypes. Cannon and Keller (Reference Cannon and Keller2006) use “the watershed” model explaining the pathway between genes and phenotypes. In this model, specific genes contribute variation to narrowly defined neurophysiological endophenotypes such as dopaminergic regulation in the prefrontal cortex. This endophenotype, together with other narrowly defined endophenotypes, affects a more broadly defined cognitive endophenotype (e.g., phonological STM), which, in conjunction with other endophenotypes (e.g., grammatical morphology), affects observable phenotypes (i.e., symptoms of complex neurodevelopmental disorders, like DLD). This model allows us to reconcile the multifactorial and continuously variable causality with categorical outcomes. It seems promising in explaining the multifaceted and variable DLD phenotypes by allowing (but not requiring) linear and nonlinear effects from multiple factors for crossing the threshold into the category of affected. It explains why we need not expect to find the same cognitive profiles in all individuals diagnosed with DLD: the disorder threshold can be crossed with a confluence of various or with fewer but more severely deficient endophenotypes, producing the full clinical array of DLD subtypes (for the description of clinical subtypes, see Conti-Ramsden & Botting, Reference Conti-Ramsden and Botting1999; Conti-Ramsden, Crutchley, & Botting, Reference Conti-Ramsden, Crutchley and Botting1997; Rapin & Allen, Reference Rapin, Allen and Kirk1983). Finally, it allows us to reconcile the findings that DLD children frequently exhibit deficits outside of the narrowly defined domain of language (e.g., deficient temporal auditory processing or poor visual–spatial memory), with claims that the disorder (in at least a subset of cases) cannot be fully reduced to such deficits, but requires an explanation specific to the domain of language (i.e., deficit in the neurobiological representation of grammar).
NWR fits the criteria for a cognitive endophenotype because it has clearly been shown to be associated with the various forms of DLD (Graf Estes et al., Reference Graf Estes, Evans and Else-Quest2007), is heritable (Bishop et al., Reference Bishop, North and Donlan1995) and has been successfully used in genetic linkage and association studies (Addis et al., Reference Addis, Friederici, Kotz, Sabisch, Barry and Richter2010; Newbury et al., Reference Newbury, Bishop and Monaco2005; The SLI Consortium, 2002). Further research is needed to ascertain whether the NWR performance deficit is present as a subclinical marker in the unaffected relatives of the affected probands in this population. Comparing the unaffected individuals from the AZ population with a group of unimpaired controls from the general population would provide valuable insight into this question and further corroborate the role of NWR as a valid endophenotype for DLD. In addition, further research is needed to identify additional endophenotypes underlying the complex AZ phenotype. Given the small size of the shared variance between NWR and language phenotypes we found, the existence of such additional traits being related to the language impairments we described is quite plausible.
Heterogeneity and vertical transmission of the AZ phenotype
In this research, our last objective was (a) to investigate whether we could identify distinct profiles in which DLD is manifested in the AZ population, and (b) to see whether the pattern of vertical transmission of these profiles could shed light on whether DLD is a complex but unitary disorder with a spectrum of profiles or rather a group of discrete syndromes each with a distinct profile. First, using the narrative samples and the methodology described above, we identified all combinations of language deficits that occur in the AZ population and their frequencies.
As the four-way Venn diagram (Figure 2) illustrates, there is no predominant profile that characterizes the AZ phenotype: nearly all possible combinations of phonetic/prosodic, well-formedness, syntactic complexity, and semantic/pragmatic deficits occur in the population with relatively similar frequencies. There are somewhat higher frequencies of deficits in single domains, compared to domain combinations. It is worth noting that individuals with a deficit in a single domain have been excluded from the overall category “DLD affected” in our disorder prevalence estimates for the sake of being conservative in our classification and avoiding labeling as DLD-impaired individuals with an isolated phonological or pragmatic disorder. However, it is interesting to observe that even in a population with such closely shared genes and environments, we observe not only isolated phonetic, grammatical, and semantic/pragmatic deficits, but also every possible combination thereof. Such heterogeneity brings into question the usefulness of attempting to classify DLD individuals from the general population based solely on their behavioral characteristics. A more promising strategy may be to look beyond the surface heterogeneity and identify markers at the more abstract level of cognitive functions, each with a plausible neurobiological foundation, shared by individuals regardless of the variation in their behavioral phenotypes. Such an approach may be more successful in tracing the genetic pathways of a complex disorder phenotype.
The four-way Venn diagram of the frequencies of impairments in major language domains in a geographically isolated Russian-speaking population (n = 328 across all age groups). The numbers represent the percentage affected per domain. Overlapping areas show frequencies of multiple impairments. [A color version of this figure can be viewed online at http://journals.cambridge.org/aps]
To get a better understanding of the complex AZ phenotype, we can compare ratios of the frequency of an isolated impairment in each domain to its occurrence in conjunction with other impairments in order to see how frequently each type of deficit occurs in isolation. An isolated phonetic impairment appears to be rather uncommon and most frequently occurs in conjunction with other deficits. Namely, in only about one-third of the individuals with a phonetic deficit (i.e., in 34% of them), it occurs as a single impairment, in the remaining 66% it co-occurs with grammatical and semantic deficits. This percentage is even lower for a semantic impairment—only in 28% of those who have this difficulty are there no other language deficits. In comparison, a grammatical deficit, manifested as either a high frequency of ill-formed structures or low syntactic complexity (or both), occurs without other language difficulties slightly more frequently, in 38% of the individuals who have impaired grammar. These numbers underscore the multivariate and diverse nature of linguistic profiles found in the AZ population, consistent with a body of literature reporting substantial heterogeneity of DLD phenotypes found across studies (Leonard, Reference Leonard1998).
A topic often discussed in the DLD literature in regard to the diversity of reported profiles is whether within this diversity, distinct disorder subtypes can be identified. To address this question, we have examined multigenerational subpedigrees of AZ extended families to trace patterns of transmission of deficits in various domains and see whether we can find distinct linguistic profiles transmitted vertically within families as distinct disorder subtypes. An examination of subpedigrees revealed a complex pattern of transmission of the multifaceted phenotype described above. As can be seen from the exemplar pedigrees (Figure 3a and b), individual language deficits and their combination show familial clustering. This is in line with other cross-sectional studies of DLD that report familiality of the disorder(s) (e.g., Spitz, Tallal, Flax, & Benasich, Reference Spitz, Tallal, Flax and Benasich1997). Every generation has individuals exhibiting language deficits; however, the youngest generation shows the highest frequency of the disorder. In addition, it is possible for an affected child to have unaffected parents who, in turn, may have affected siblings, parents, or other relatives. As can be observed, no given type of deficit appears to breed true, with the phonological, grammatical, or semantic deficits or their combinations being mixed within a family in what appears to be a rather unpredictable pattern. Thus, we see no evidence for distinct disorder subtypes beneath the phenotypic diversity found in this population being transmitted across generations. The lack of clear dissociation between phonetic, grammatical, and semantic deficits is compatible with the view that they might be facets of a single disorder phenotype not representing discrete disorder subtypes.
Two exemplar pedigrees are shown. Circles represent females, and squares represent males. The impairment status is color coded as follows (online only): white, unimpaired; gray, no information available; crossed out, deceased; yellow, impaired on well-formedness; blue, phonetic/prosodic characteristics; green, syntactic complexity; red, semantics/pragmatics. Each individual is marked for each impaired domain. (a) The grandfather shows three out of four impaired domains, and the deceased grandmother has a sibling affected on two domains. However, their descendents exhibit unpredictable combinations of the three deficits, with the additional deficit in syntactic complexity appearing in the youngest generation. (b) The syntactic complexity deficit appears in the oldest generation (of note is that the grandparents on the right exhibit three out of four possible deficits), but the unaffected individuals appear among their descendents, as well as individuals with a well-formedness impairment not found in the grandparents. [A color version of this figure can be viewed online at http://journals.cambridge.org/aps]
The study has a number of limitations. Because of logistical reasons (demanding instruments that can be used across all age groups and are easy and quick to administer), as well as a lack of normed language assessments in Russian, we had to rely on a narrative task rather than on a published standardized assessment of language, as is common practice in the field. We also had to rely on general ability measures standardized on American samples as proxies for cognitive ability. However, the consistency of applying our methodology and the use of a comparative population alleviate this shortcoming to some degree. Moreover, a thorough investigation of a linguistic profile of the population would require using measures of comprehension and targeted elicitation, as pointed out by an anonymous reviewer. Although such data were also obtained from children of both populations, due to length considerations, these data cannot be presented in this paper and are currently being prepared for another publication. Another limitation is that because there are no theoretically based accounts of DLD in Russian and very few empirical investigations on which we could draw, this study represents one of the first attempts to characterize the disorder in Russian, and consequently leaves a lot of questions and linguistic details unaddressed. In addition, we recognize that in order to understand the DLD profile of the Russian-speaking AZ population, a detailed linguistic analysis of the indicators of their grammatical functioning is needed. Because of length limitations, we are unable to include such an analysis in the current article, and leave it for further research.
Finally, because the present study recruited individuals from a unique population, legitimate questions about the generalizability of these findings to other populations can be raised. However, what we report is in line with the body of literature on the role of genetic factors in DLD, the heterogeneous and multifactorial nature of the disorder, and its specificity to the verbal domain, namely, deficient language functioning without apparent sensory, neurological, and general cognitive explanatory factors.
The phenotypic data presented here have been collected as part of a large-scale genetic linkage and association study, which, the authors hope, will provide insights on the genetic etiology of DLD, a field that, despite several successful attempts to identify susceptibility loci, have been hindered with conflicting findings and nonreplications.
ACKNOWLEDGMENTS
We express our gratitude to many colleagues in Russia (Liudmila Kniazeva, Igor Pushkin, Anastasia Strelina, and health practitioners and community leaders in AZ who assisted us in the data collection) and in the United States (Lesley Hart, Suzanna Krivulskaya, Jodi Reich, and Bruce Tomblin). We also gratefully acknowledge essential contributions to the linguistic component of this research by the late Dr. Maria Babyonyshev. Finally, we are indebted to the members of AZ, who let us live and work in their community. The first two authors contributed equally to the writing of the manuscript. Preparation of this manuscript was supported by Grant DC07665 from the National Institutes of Health. Grantees undertaking such projects are encouraged to freely express their professional judgment. This article therefore does not necessarily represent the position or policies of the National Institutes of Health and no official endorsement should be inferred.