





1. Introduction
The manipulation of particles and cells in Newtonian and non-Newtonian fluids is crucial for biomedical and biochemical applications (Yuan et al. Reference Yuan, Zhao, Yan, Tang, Alici, Zhang and Li2018). Various passive and active techniques have been used for particle and cell handling in microchannels (Sajeesh & Sen Reference Sajeesh and Sen2013). Recently, ultrasonic standing wave (USW) technology has gained attention for its contactless, gentle, biocompatible and non-invasive characteristics (Laurell, Petersson & Nilsson Reference Laurell, Petersson and Nilsson2007). Exposure of particles to an ultrasound field results in nonlinear scattering, leading to time-averaged acoustic radiation force (ARF) (King Reference King1934; Yosioka Reference Yosioka1955; Lighthill Reference Lighthill1978). In a Newtonian fluid, the primary ARF is proportional to particle volume (Bruus Reference Bruus2012b), acoustic energy density (AED) (Barnkob et al. Reference Barnkob, Augustsson, Laurell and Bruus2010) and acoustic contrast factor (ACF) (Petersson et al. Reference Petersson, Nilsson, Holm, Jönsson and Laurell2004), the latter being a function of compressibility of the particle relative to the suspending fluid and decides the direction of force. This dependency enables label-free manipulation of particles based on size, density and compressibility contrast (Bruus Reference Bruus2012b; Nath, Malik & Sen Reference Nath, Malik and Sen2021; Malik et al. Reference Malik, Nath, Nandy, Laurell and Sen2022).
Various theoretical and numerical studies have formulated ARF on small particles within the Rayleigh limit (Baasch & Dual Reference Baasch and Dual2018), for ideal fluids (Gorkov Reference Gorkov1962; Bruus Reference Bruus2012b; Hoque, Nath & Sen Reference Hoque, Nath and Sen2021), viscous fluids (Doinikov Reference Doinikov1997; Settnes & Bruus Reference Settnes and Bruus2012) and thermo-viscous fluids (Karlsen & Bruus Reference Karlsen and Bruus2015), based on perturbation theory (Bruus Reference Bruus2012a) and first-order scattering theory (Settnes & Bruus Reference Settnes and Bruus2012). The USW in the low MHz range generates a first-order pressure field with the pressure node and antinode within a microfluidic channel. For the fundamental resonance mode, i.e. a half-wave actuation, the node and antinode correspond to the channel centre and walls (Bruus Reference Bruus2012a), respectively. Particles suspended in a Newtonian fluid and exposed to ARF migrate to the node (positive ACF) or antinode (negative ACF) (Petersson et al. Reference Petersson, Nilsson, Holm, Jönsson and Laurell2004). Barnkob et al. (Reference Barnkob, Augustsson, Laurell and Bruus2010) studied acoustic particle transport in such a fluid, traced particle trajectories over time and equated viscous drag with ARF to predict the AED. Experimental investigations on particle/cell migration (Laurell et al. Reference Laurell, Petersson and Nilsson2007; Karthick et al. Reference Karthick, Pradeep, Kanchana and Sen2018; Nath et al. Reference Nath, Malik and Sen2021) show that changes in fluid density, compressibility and viscosity affect AED and ACF, thereby influencing migration trajectory and migration time. This is important for ARF-driven separation and sorting of particles/cells in microchannels (Lenshof & Laurell Reference Lenshof and Laurell2010).
Owing to the rich property dependence of ARF, fluid viscoelasticity can significantly alter the ARF (Doinikov, Fankhauser & Dual Reference Doinikov, Fankhauser and Dual2021b). A viscoelastic fluid exhibits both viscous and elastic characteristics, enabling a time-dependent response to deformation, including stress relaxation and creep (Joseph Reference Joseph2013). Consequently, the motion of particles suspended in a viscoelastic fluid differs significantly from their motion in a Newtonian fluid. For instance, the first normal stress difference  $({\mathsf{N}}_1=\sigma _{x x}-\sigma _{y y})$, which is absent in Newtonian fluids, produces a viscoelastic lift force (Leshansky et al. Reference Leshansky, Bransky, Korin and Dinnar2007) on particles in viscoelastic fluids. Over the last decade, significant progress has been made in understanding particle migration and sorting enabled by fluid viscoelasticity (D'Avino, Greco & Maffettone Reference D'Avino, Greco and Maffettone2017; Hazra et al. Reference Hazra, Nath, Mitra and Sen2021). However, passive viscoelastic particle migration and sorting require a large shear rate and longer channel length. Additionally, passive sorting methods have disadvantages such as low separation efficiency and throughput (Yuan et al. Reference Yuan, Zhao, Yan, Tang, Alici, Zhang and Li2018), which could be mitigated by exposing viscoelastic fluid systems to external force fields (Yuan et al. Reference Yuan, Zhao, Yan, Tang, Alici, Zhang and Li2018).
Most microfluidic systems use complex bio-fluids such as blood (Lenshof & Laurell Reference Lenshof and Laurell2010), blood plasma (Brust et al. Reference Brust, Schaefer, Doerr, Pan, Garcia, Arratia and Wagner2013), saliva (Stokes & Davies Reference Stokes and Davies2007), sputum (Li et al. Reference Li, Ren, Huang, Yao, Cuento, McCoy, Cameron, Levine and Huang2016), synovial fluid (Rainer & Ribitsch Reference Rainer and Ribitsch1985), protein solutions (Pan et al. Reference Pan, Filobelo, Pham, Galkin, Uzunova and Vekilov2009) or hydrogels (Chaudhuri et al. Reference Chaudhuri, Cooper-White, Janmey, Mooney and Shenoy2020). These bio-fluids possess complex rheology, with most being viscoelastic. For example, blood is a viscoelastic shear-thinning fluid due to the dynamics, deformability, and interactions of red blood cells (Chien Reference Chien1970; Brust et al. Reference Brust, Schaefer, Doerr, Pan, Garcia, Arratia and Wagner2013). Studies on protein solutions (Pan et al. Reference Pan, Filobelo, Pham, Galkin, Uzunova and Vekilov2009), polymeric solutions (Rouse Reference Rouse1953), hydrogels and extracellular matrices (Chaudhuri et al. Reference Chaudhuri, Cooper-White, Janmey, Mooney and Shenoy2020) also highlight the significance of the viscoelastic nature of bio-fluids. Some of the existing studies have used ARF for manipulating particles suspended in bio-fluids in microchannels (Laurell et al. Reference Laurell, Petersson and Nilsson2007; Lenshof & Laurell Reference Lenshof and Laurell2010). Even though these studies involve the use of complex bio-fluids, modelling and analysis of such systems often assume the fluid to be Newtonian. Since bio-fluids are inherently viscoelastic, the dynamics may not be captured well by treating the physics based on such simplified assumptions. Therefore, understanding the interaction of viscoelastic fluids with external acoustic fields in micro-confinements is of utmost importance to accurately decipher the physics. This could find relevance in better understanding particle transport characteristics, leading to important microfluidic applications (Sajeesh & Sen Reference Sajeesh and Sen2013; Yuan et al. Reference Yuan, Zhao, Yan, Tang, Alici, Zhang and Li2018).
Although interaction between viscoelastic fluids and external force fields in a micro-confinement is yet to be understood, there are few reports which consider the effect of viscoelasticity on acoustic parameters. For instance, Hintermuller, Reichel & Jakoby (Reference Hintermuller, Reichel and Jakoby2017), Doinikov, Fankhauser & Dual (Reference Doinikov, Fankhauser and Dual2021a) and Vargas et al. (Reference Vargas, Campos-Silva, Méndez, Arcos and Bautista2022), modelled Oldroyd-B and Maxwell fluids under ultrasound to study acoustic streaming. Recently, Doinikov et al. (Reference Doinikov, Fankhauser and Dual2021b) theoretically formulated and numerically calculated the ARF on isotropic solid spherical particles in unbounded compressible viscoelastic fluids, without imposing any restriction on the particle size compared with the acoustic wavelength. They derived a generalized ARF expression using indefinite integrals, highlighting the complexity and precision required for these calculations. Their findings showed that boundary layer formation on particle surface and shear wave propagation affect wave scattering and ARF. However, their study focused only on the effects of the particle boundary layer on ARF. An understanding of the effects of boundary layers on the channel walls, shear wave propagation and viscous dissipation in the fluid on the incoming waves and ARF is missing in the literature. Furthermore, the decoupled effects of AED in the fluid and ACF on ARF and particle migration in viscoelastic fluids are yet to be investigated.
Recently, Vargas et al. (Reference Vargas, Campos-Silva, Méndez, Arcos and Bautista2022) examined the effects of viscosity and elasticity (Deborah number,  $De$) on the perturbation field to study acoustic streaming, considering shear wave attenuation. However, their analysis is limited to extremely narrow microchannels where the channel depth (
 $D$) is comparable to the boundary layer thickness (
 $\delta _{ve}$) but much smaller than the channel width (
 $W$) and acoustic wavelength (
 $\lambda _0$) (
 $\delta _{ve} \sim D \ll W \sim \lambda _0$). Due to the constraints in the perturbation method, they omitted higher-order viscous effects (assuming
 $\epsilon = D/\lambda _0 \ll 1$, neglecting second and higher orders of
 $\epsilon$) and considered
 $\delta _{ve}$ only as a function of viscosity. Nonetheless, microfluidic devices used for particle manipulations often feature channel depth and width that are of the same order as the acoustic wavelength. In such cases, the solution provided by Vargas et al. (Reference Vargas, Campos-Silva, Méndez, Arcos and Bautista2022) becomes inadequate. Consequently, it is essential to advance the analysis for viscoelastic fluid cases where
 $\delta _{ve} < D \sim W \sim \lambda _0$ for microfluidic acoustophoresis applications. Further, there is no theoretical and experimental study reported, exploring acoustic particle migration in viscoelastic fluids inside a microchannel exposed to ultrasound, which serves the objective of the present study.
In summary, previous studies on particle dynamics in viscoelastic fluids exposed to ultrasound have mainly focused on acoustic streaming and the effect of the acoustic boundary layer near the particles on ARF. However, the impact of the boundary layer at the channel walls and viscoelasticity on the AED in the fluid, and consequently the ARF, has not received attention. Further, there is a lack of understanding of the dynamics of acoustic particle transport in viscoelastic fluids inside a microchannel, specifically the decoupled effects of viscous and elastic effects. In this study, we investigate how fluid viscoelasticity and boundary layer formation along the channel walls influence acoustic perturbations in a fluidic channel having dimensions comparable to the acoustic wavelength, typical of a microfluidic acoustophoresis device. By considering the effects of boundary layers on the channel walls and adjusting the incoming acoustic field, we develop a improved formulation for the acoustic force in viscoelastic fluids inside a channel. This formulation decouples the effects of viscoelasticity on both the ACF and the AED. Further, through experiments and theoretical analysis, we explore the effects of viscoelasticity on acoustic particle migration dynamics in a microchannel. Our work addresses a significant gap in the literature, providing new insights into how viscoelastic properties impact acoustic migration phenomena.
In order to understand the sole effect of viscoelasticity on the ARF, neglecting any contribution from the viscoelastic lift force, we conduct the study in a quiescent fluid where the lift force vanishes. We use the Oldroyd-B model (Oldroyd Reference Oldroyd1950) to describe viscoelastic fluids as this model stands out for its simplicity and accuracy in capturing both viscous and elastic behaviours, making it ideal for representing the complex behaviours of bio-fluids and polymer solutions. We characterize viscous effects  $(\mu =\mu _s+\mu _p)$ via the viscosity ratio
 $\mu ^* = \mu / \mu _{bf} = \mu _p^* + \mu _s^*$ and the elastic effects or fluid relaxation time
 $\tau$ via the Deborah number
 $De = \tau \omega$, where
 $\mu _p$ and
 $\mu _s$ are the polymer and solvent viscosities,
 $\mu$ is the total viscosity,
 $\mu _{bf}$ is the base Newtonian fluid viscosity and
 $\omega$ is the ultrasonic actuation frequency. In § 2, we introduce formulations for acoustic field perturbations in viscoelastic fluids, influenced by the acoustic boundary layer, which is a function of viscous and elastic properties. We develop a theory to determine the scattered acoustic field using first-order scattering theory with multipole expansion. We then derive a modified expression for the ARF by decoupling the AED and ACF and analyse particle migration dynamics. In § 3, we describe the numerical schemes for solving the perturbed governing equations and determining the AED. In § 4, we detail the experimental set-up and fluid properties. In § 5, we present and discuss the effects of
 $\mu _p^*$,
 $\mu _s^*$,
 $De$ and acoustic boundary layer on the incoming field, AED, ACF, ARF and particle migration dynamics from theory and experiments using polyethylene oxide (PEO) and polyvinylpyrrolidone (PVP) solutions. Finally, conclusions are outlined in § 6.
2. Theoretical formulation
Exciting a fluid with sound waves under resonance condition induces fluid perturbations (Lighthill Reference Lighthill1978; Bruus Reference Bruus2012a). Particles present in the fluid experience ARF due to sound wave scattering, leading to acoustophoretic motion. Studies by Bruus (Reference Bruus2012b), Settnes & Bruus (Reference Settnes and Bruus2012) and Karlsen & Bruus (Reference Karlsen and Bruus2015) provided an expression for ARF for ideal, viscous and thermos-viscous fluids, respectively. Recently, Doinikov et al. (Reference Doinikov, Fankhauser and Dual2021a,Reference Doinikov, Fankhauser and Dualb) derived an expression for the ARF for solid spherical particles in compressible viscoelastic fluids. Here, we aim to advance this formulation by considering the AED in micro-confinements, for particles much smaller than the acoustic wavelength. Our theory considers the particles to be solid, compressible and spherical, with the fluid's resonance frequency significantly smaller than that of the solid particles (Settnes & Bruus Reference Settnes and Bruus2012; Karlsen & Bruus Reference Karlsen and Bruus2015). Our formulation provides new understanding of the influence of micro-confinements and viscoelasticity on the ARF and particle migration dynamics.
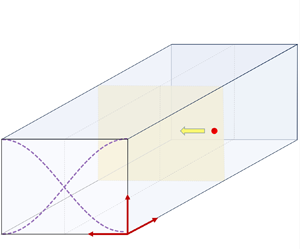
A schematic of the physical domain used in our theoretical formulation is shown in figure 1. We consider a straight rectangular microchannel of width  $W$ and depth
 $D$. The channel is filled with a viscoelastic fluid containing particles, both the particles and fluid are initially in a quiescent state. The spherical particles have radius
 $a$, density
 $\rho _P$ and compressibility
 $\kappa _P$. The fluid has viscosity
 $\mu$ (with solvent and polymer contributions
 $\mu _s$ and
 $\mu _p$,
 $\mu =\mu _s+\mu _p$), relaxation time
 $\tau$, density
 $\rho _0$ and compressibility
 $\kappa _0$. The channel is exposed to a standing bulk acoustic wave (S-BAW) along the
 $y$-axis, causing particle migration. By setting the channel width
 $W$ to half the acoustic wavelength (
 $\lambda _0/2$), we achieve half-wave resonance. A cross-sectional view of the channel is shown in figure 1(a). In the presence of an USW, the acoustic boundary layer forms along the channel's top and bottom walls, with a thickness
 $\delta _{ve}$ shown in figure 1(a). Assuming the standing wave is uniform along the channel length (
 $x$-axis), we analyse fluid perturbations in the
 $y$–
 $z$ plane. We consider the particle motion along the
 $y$-direction in the
 $x$–
 $y$ plane, with negligible drift in the
 $x$ and
 $z$ directions. The initial particle position is indicated by
 $y_0$, and a representative particle trajectory is shown in figure 1(b). We focus over a region away from the channel inlet and outlet to avoid end effects, which defines our physical domain.
Schematic representation of physical domain used in the theoretical and numerical formulation. (a) Side view of the microchannel with width  $W$ and depth
 $D$, the acoustic boundary layer thickness is indicated by
 $\delta _{ve}$. (b) Top view of the microchannel with particle, the starting position of the particle in the channel is
 $y_0$. The channel width
 $W$ is exposed to a one-dimensional standing wave (along
 $y$ axis, shown by dashed violet lines) operating at the first harmonic mode, i.e. half-wave mode. Particle trajectory due to acoustic excitation of the fluid is shown using red circles at different time instants.

2.1. Standing bulk acoustic wave and fluid perturbation
Acoustic perturbations cause changes in the pressure  $p$, density
 $\rho$ and velocity
 $\boldsymbol {v}$ fields within a fluid. To understand these variations, we begin with the continuity and momentum equations. For a viscoelastic fluid, the governing equations are
 $$\begin{gather} \frac{\partial \rho}{\partial t}+\boldsymbol{\nabla} \boldsymbol{\cdot} (\rho \boldsymbol{v})=0, \end{gather}$$
 $$\begin{gather}\rho\left(\frac{\partial \boldsymbol{v}}{\partial t}+\boldsymbol{v} \boldsymbol{\cdot} \boldsymbol{\nabla} \boldsymbol{v}\right) ={-}\boldsymbol{\nabla} p+\boldsymbol{\nabla} \boldsymbol{\cdot} \mu_s\left[\boldsymbol{\nabla} \boldsymbol{v}+(\boldsymbol{\nabla} \boldsymbol{v})^T-\frac{2}{3}(\boldsymbol{\nabla} \boldsymbol{\cdot} \boldsymbol{v}) \boldsymbol{I}\right]+\boldsymbol{\nabla} \boldsymbol{\cdot} \boldsymbol{\sigma}_{ve}. \end{gather}$$
To represent the rheological behaviour of a viscoelastic fluid, we use the Oldroyd-B model (Oldroyd Reference Oldroyd1950), where  $\mu _s$ stands for the solvent viscosity, and
 $\boldsymbol {\sigma }_{ve}$ represents the second-order viscoelastic polymer stress tensor. Here,
 $\boldsymbol {\sigma }_{ve}$ incorporates both viscous and elastic effects introduced by the polymer part of the fluid and can be expressed as
 \begin{equation} \tau\hat{\boldsymbol{\sigma}}_{ve}+\boldsymbol{\sigma}_{ve}=\mu_p[\boldsymbol{\nabla} \boldsymbol{v}+(\boldsymbol{\nabla} \boldsymbol{v})^T-\tfrac{2}{3}(\boldsymbol{\nabla} \boldsymbol{\cdot} \boldsymbol{v}) \boldsymbol{I}]. \end{equation}
Here,  $\mu _p$ is the contribution of the polymer viscosity to the total viscosity of the solution,
 $\mu =\mu _s+\mu _p$, and
 $\tau$ is the relaxation time. A convected time differentiation is introduced on
 $\boldsymbol {\sigma }_{ve}$ to account for the frame invariance of the stress tensor, and
 $\hat {\boldsymbol {\sigma }}_{ve}$ represents the upper-convected stress derivative of
 $\boldsymbol {\sigma }_{ve}$, defined as
 \begin{equation} \hat{\boldsymbol{\sigma}}_{ve}=\frac{\partial \boldsymbol{\sigma}_{ve}}{\partial t}+\boldsymbol{v} \boldsymbol{\cdot} \boldsymbol{\nabla} \boldsymbol{\sigma}_{ve}-(\boldsymbol{\nabla} \boldsymbol{v})^T \boldsymbol{\cdot} \boldsymbol{\sigma}_{ve}-\boldsymbol{\sigma}_{ve} \boldsymbol{\cdot} \boldsymbol{\nabla} \boldsymbol{v}. \end{equation}
The governing equations (2.1)–(2.4) are nonlinear and difficult to solve directly. To simplify, we use a perturbation approach suitable for small acoustic amplitudes. Following the works of Bruus (Reference Bruus2012b), Settnes & Bruus (Reference Settnes and Bruus2012) and Doinikov et al. (Reference Doinikov, Fankhauser and Dual2021a), we introduce perturbation schemes for fluid density  $\rho$, pressure
 $p$, velocity
 $\boldsymbol {v}$ and the viscoelastic stress tensor
 $\boldsymbol {\sigma }_{ve}$ up to second order. Unperturbed quantities are labelled with subscript ‘0’, while first- and second-order perturbations use subscripts ‘1’ and ‘2’. We assume that the zeroth-order fields remain constant in space and time. The first-order fields represent the system's linear response to small perturbations, oscillating harmonically at an angular frequency
 $\omega$ and an amplitude that varies only with space (Baasch, Pavlic & Dual Reference Baasch, Pavlic and Dual2019). The second-order fields account for nonlinear interactions arising from the first-order perturbations, oscillating at double the frequency,
 $2\omega$. The perturbed fluid fields are
 \begin{equation} \rho=\rho_0+\rho_1+\rho_2, \quad p=p_0+p_1+p_2, \quad \boldsymbol{v}=\boldsymbol{v}_1+\boldsymbol{v}_2, \quad \boldsymbol{\sigma}^{ve}=\boldsymbol{\sigma}_1^{ve}+ \boldsymbol{\sigma}_2^{ve}. \end{equation}
In the unperturbed state, the viscoelastic fluid is at rest, implying that  $\boldsymbol {v}_0$ and
 $\boldsymbol {\sigma }^{ve}_0$ are initially zero. We substitute equation (2.5a–d) into (2.1)–(2.4). By disregarding the products of first-order terms and keeping only the first-order terms, we express the first-order equations as
 $$\begin{gather} \frac{\partial \rho_1}{\partial t}+\rho_0 \boldsymbol{\nabla} \boldsymbol{\cdot} \boldsymbol{v}_1=0, \end{gather}$$
 $$\begin{gather}\rho_0 \frac{\partial \boldsymbol{v}_1}{\partial t}={-}\boldsymbol{\nabla} p_1+\boldsymbol{\nabla} \boldsymbol{\cdot} \mu_s\left[\boldsymbol{\nabla} \boldsymbol{v}_1+(\boldsymbol{\nabla} \boldsymbol{v}_1)^T-\frac{2}{3}(\boldsymbol{\nabla} \boldsymbol{\cdot} \boldsymbol{v}_1) \boldsymbol{I}\right]+\boldsymbol{\nabla} \boldsymbol{\cdot} \boldsymbol{\sigma}_1^{ve}, \end{gather}$$
 $$\begin{gather}\tau \frac{\partial \boldsymbol{\sigma}_1^{ve}}{\partial {t}}+\boldsymbol{\sigma}_1^{ve}=\mu_p\left[\boldsymbol{\nabla} \boldsymbol{v}_1+(\boldsymbol{\nabla} \boldsymbol{v}_1)^T-\frac{2}{3}(\boldsymbol{\nabla} \boldsymbol{\cdot} \boldsymbol{v}_1) \boldsymbol{I}\right]. \end{gather}$$
Furthermore, the equation of state can be expressed as
 \begin{equation} p_1-p_0=(\rho_1-\rho_0) c_0^2, \end{equation}
where  $p_0$ and
 $\rho _0$ are unperturbed pressure and mass density, respectively, and
 $c_0$ represents the speed of sound in the fluid.
We assume the first-order fields oscillate harmonically with an angular frequency  $\omega$ (Baasch et al. Reference Baasch, Pavlic and Dual2019). Thus, the harmonic time dependence of the first-order field can be expressed as
 \begin{align}
\begin{aligned}
\rho_1(r,t)=\tilde{\rho}_1 (r) \, {\rm e}^{{\rm i} \omega t}, \quad p_1(r,t)=\tilde{p}_1 (r) \, {\rm e}^{{\rm i} \omega t}, \nonumber\\
\boldsymbol{v}_1(r,t)=\tilde{\boldsymbol{v}}_1 (r)\, {\rm e}^{{\rm i} \omega t}, \quad \boldsymbol{\sigma}_1^{ve}(r,t)
= \tilde{\boldsymbol{\sigma}}_1^{ve} (r)\, {\rm e}^{{\rm i} \omega t}.\end{aligned}
\end{align}
Here, the angular frequency  $\omega =2{\rm \pi} f$ and
 $f$ represents the resonant frequency. The terms
 $\tilde {\rho }_1 (r), \ \tilde {p}_1 (r), \tilde {\boldsymbol {v}}_1(r)$ and
 $\tilde {\boldsymbol {\sigma }}_1^{ve} (r)$ represent time-independent amplitudes (only functions of space) of first-order density, pressure, velocity and viscoelastic stress fields, respectively. By applying harmonic time dependence (2.10a–d) to (2.6)–(2.8), we transform the first-order equations from the time domain to the frequency domain. Upon simplification, we obtain
 $$\begin{gather} {\rm i} \omega \tilde{\rho}_1+\rho_0 \boldsymbol{\nabla} \boldsymbol{\cdot} \tilde{\boldsymbol{v}}_1=0, \end{gather}$$
 $$\begin{gather}{\rm i} \omega \rho_0 \tilde{\boldsymbol{v}}_1={-}\boldsymbol{\nabla} \tilde{p}_1 +\boldsymbol{\nabla} \boldsymbol{\cdot} \mu_c[\boldsymbol{\nabla} \tilde{\boldsymbol{v}}_1+(\boldsymbol{\nabla} \tilde{\boldsymbol{v}}_1)^T-\tfrac{2}{3}(\boldsymbol{\nabla} \boldsymbol{\cdot} \tilde{\boldsymbol{v}}_1) \boldsymbol{I}], \end{gather}$$
where
 \begin{equation} \mu_c=\mu_s+\frac{\mu_p}{1+{\rm i} \tau \omega}. \end{equation}
Here, we introduce complex viscosity  $\mu _c$ to describe the effect of viscoelastic parameters
 $\mu _s, \ \mu _p$ and
 $\tau$ on the first-order fields.
The first-order fields do not contribute to the time-averaged effects (Bruus Reference Bruus2012b). However, the time-averaged second-order fields are non-zero. We obtain the second-order perturbed equations by substituting equation (2.5a–d) into (2.1)–(2.4) and retaining only the second-order terms. This includes the second-order perturbations of single variables as well as products of two first-order perturbations. The time-averaged second-order equations are
 \begin{gather} \rho_0 \boldsymbol{\nabla} \boldsymbol{\cdot} \langle\boldsymbol{v}_2\rangle={-}\boldsymbol{\nabla} \boldsymbol{\cdot} \langle\rho_1 \boldsymbol{v}_1\rangle, \end{gather}
 \begin{gather} \rho_0\langle\boldsymbol{v}_1 \boldsymbol{\cdot} \boldsymbol{\nabla} \boldsymbol{v}_1+\boldsymbol{v}_1 \boldsymbol{\nabla} \boldsymbol{\cdot} \boldsymbol{v}_1\rangle={-}\boldsymbol{\nabla} \langle p_2\rangle+\mu \boldsymbol{\nabla} ^2\langle\boldsymbol{v}_2\rangle+\frac{\mu}{3} \boldsymbol{\nabla} (\boldsymbol{\nabla} \boldsymbol{\cdot} \langle\boldsymbol{v}_2\rangle)\nonumber\\ -\tau \boldsymbol{\nabla} \boldsymbol{\cdot} \langle\boldsymbol{v}_1 \boldsymbol{\cdot} \boldsymbol{\nabla} \boldsymbol{\sigma}_1^{ve}\rangle+\tau \boldsymbol{\nabla} \boldsymbol{\cdot} \langle(\boldsymbol{\nabla} \boldsymbol{v}_1)^T \boldsymbol{\cdot} \boldsymbol{\sigma}_1^{ve}\rangle+\tau \boldsymbol{\nabla} \boldsymbol{\cdot} \langle\boldsymbol{\sigma}_1^{ve} \boldsymbol{\cdot} \boldsymbol{\nabla} \boldsymbol{v}_1\rangle. \end{gather}
Here, ‘ $\langle {\cdot } \rangle$’ denotes time averaging over a full oscillation period, which is
 $2{\rm \pi} /\omega$. The time average of harmonically varying fields
 $f$ and
 $g$ can be expressed as
 $\langle \,f \ g \rangle = \frac {1}{2} \ \text {Re}[\,\tilde {f} \ \tilde {g}^c]$, where
 $\tilde {f}$ and
 $\tilde {g}$ are the time-independent amplitudes and
 $c$ represents the complex conjugate. The last three terms on the right side of (2.15) arise from the viscoelastic fluid model and represent additional volume forces due to the fluid's viscoelastic properties.
The time average of the second-order fields from (2.14)–(2.15) results in the primary ARF (Bruus Reference Bruus2012b). The ARF acting on a particle can be expressed as
 \begin{equation} \boldsymbol{F}_{rad}=\left\langle\oint_s \boldsymbol{\sigma} \boldsymbol{\cdot} \boldsymbol{n} \, {\rm d} A\right\rangle, \end{equation}
where  $\boldsymbol {\sigma }$ is the total fluid stress tensor and
 $s$ is the surface of the particle,
 $\boldsymbol {n}$ is the outward normal to the surface and
 ${\rm d} A$ is the infinitesimal particle area. The radiation force expression can be further modified by considering the momentum flux through an arbitrary surface
 $s_1$ enclosing the particle (Doinikov et al. Reference Doinikov, Fankhauser and Dual2021b) as follows:
 \begin{equation} \boldsymbol{F}_{rad}=\left\langle\oint_{s 1}(\boldsymbol{\sigma}_2-\rho_0 \boldsymbol{v}_1 \boldsymbol{v}_1) \boldsymbol{\cdot} \boldsymbol{n} \, {\rm d} A\right\rangle. \end{equation}
Here,  $\boldsymbol {\sigma }_2$ is the total second-order fluid stress tensor (terms on the right side of (2.15)), which includes second-order pressure, as well as viscous and viscoelastic stresses.
Using (2.17), Doinikov et al. (Reference Doinikov, Fankhauser and Dual2021a,Reference Doinikov, Fankhauser and Dualb) derived a generalized expression for ARF on solid particles in a viscoelastic fluid. They solved first- and second-order equations near particles but did not address the effects of boundary layers at the channel walls on the ARF or the modifications in AED or ACF due to viscoelasticity. Building on their work, we present a simplified expression for ARF that includes boundary layer effects around particles and microchannel walls for small particles (particle radius much smaller than the acoustic wavelength). We introduce a corrected ACF for viscoelastic fluids, considering first-order scattering theory and boundary layer formation, to determine the ARF and particle migration. Additionally, we analyse the impact of microchannel wall boundary layers on incoming waves and AED, incorporating viscous dissipation. This simplified expression, decoupling AED and ACF, enhances the understanding of acoustic particle migration dynamics in microchannels.
2.2. Acoustic boundary layer formation in viscoelastic fluids
Acoustic boundary layer formation at microchannel walls (Muller & Bruus Reference Muller and Bruus2014; Bach & Bruus Reference Bach and Bruus2018) and around particles (Doinikov Reference Doinikov1997; Settnes & Bruus Reference Settnes and Bruus2012; Karlsen & Bruus Reference Karlsen and Bruus2015) is well studied for Newtonian fluids. To modify the expression for ARF in viscoelastic fluids considering the effects of microchannel walls, understanding the acoustic boundary layer (ABL) formation on the microchannel walls is important. Here, we derive the ABL thickness in viscoelastic fluid ( $\delta _{ve}$) by solving the first-order field equations using Helmholtz decomposition (see supplementary material § 1.1 available at https://doi.org/10.1017/jfm.2024.965), following Doinikov et al. (Reference Doinikov, Fankhauser and Dual2021a). The shear wavenumber (
 $k_{ve}$) for a viscoelastic fluid is
 \begin{equation} k_{ve}=(1-{\rm i}) \sqrt{\frac{\rho_0 \omega}{2 \mu_c}}. \end{equation}
From (2.18) the viscous boundary layer thickness  $\delta _{v e}$ and viscous shear wavelength
 $\lambda _{ve}$ for viscoelastic fluids can be expressed as (Doinikov et al. Reference Doinikov, Fankhauser and Dual2021a)
 \begin{equation} \delta_{v e}={-}\frac{1}{\operatorname{Im}\{k_{ve}\}} \quad \textrm{and} \quad \lambda_{ve}=\frac{2 {\rm \pi}}{\operatorname{Re}\{k_{ve}\}}. \end{equation}
Simplifying (Brown & Churchill Reference Brown and Churchill2009) the above expressions gives
 $$\begin{gather} \delta_{v e}={-}\frac{1}{\sqrt{\varGamma}-\sqrt{\varUpsilon}}, \end{gather}$$
 $$\begin{gather}\lambda_{ve}=\frac{2 {\rm \pi}}{\sqrt{\varGamma}+\sqrt{\varUpsilon}}. \end{gather}$$
Here,  $\varGamma$ and
 $\varUpsilon$ are functions of
 $\varsigma$ and
 $\chi$, and can be expressed as
 \begin{equation} \varGamma=\frac{\sqrt{\varsigma^2+\chi^2}-\varsigma}{2} \quad \textrm{and} \quad \varUpsilon=\frac{\sqrt{\varsigma^2+\chi^2}+\varsigma}{2}, \end{equation}
where  $\varsigma$ and
 $\chi$ are fluid parameters that depend on
 $\mu$ and
 $\tau$ as follows:
 \begin{equation} \varsigma=\frac{\rho_0 \omega[\mu+\mu_s (\tau \omega)^2]}{2 [\mu^2+\mu_s^2 (\tau \omega)^2]} \quad \textrm{and} \quad \chi=\frac{\rho_0 \omega[\mu -\mu_s]\tau \omega}{2 [\mu^2+\mu_s^2(\tau \omega)^2]}. \end{equation}
From here onwards we use subscript ‘ $v$’ to indicate the viscous Newtonian fluid and ‘
 $ve$’ for the viscoelastic fluid in ABL thickness and viscous shear wavelength.
2.3. Acoustic radiation force formulation
To study how viscoelastic parameters and acoustic boundary layers affect particle migration, we derive an expression for the ARF, separating the effects of the AED and the ACF, thus advancing the formulation by Doinikov et al. (Reference Doinikov, Fankhauser and Dual2021b). We consider a small, compressible spherical particle (radius  $a$, density
 $\rho _P$, compressibility
 $\kappa _P$) in a viscoelastic fluid (density
 $\rho _0$, compressibility
 $\kappa _0$) exposed to an acoustic field with wavelength
 $\lambda _0$ (see figure 2). Assuming a dilute suspension and treating particles as weak scatterers (
 $a \ll \lambda _0$), we set the system's frequency below the particle's resonance frequency due to a higher speed of sound in the particle compared with that in the fluid.
Schematic of (a) a solid particle of radius  $a$ in a viscoelastic fluid (viscosity
 $\mu$, relaxation time
 $\tau$), with particle density
 $\rho _P$ and compressibility
 $\kappa _P$. An acoustic wave
 $(\phi _1=\phi _{{in}} + \phi _{sc})$ is introduced to study scattering. The bulk fluid domain includes a near field
 $(r \ll \lambda _0)$ with instantaneous scattered field
 $\phi _{sc}$ and a far field with time-retarded scattered field
 $\phi _{sc}(t-r/c_0)$. The viscoelastic boundary layer thickness is
 $\delta _{ve}$ (dotted line), with boundary layer width
 $\sim 5 \delta _{ve}$. Beyond this, the fluid is considered inviscid and compressible with properties
 $\rho _0$ and
 $\kappa _0$. A viscous shear wavelength
 $\lambda _{ve}$ is shown by a dotted circle around the particle. (b) Compressibility contrast: particle contracts and expands in the incident pressure wave, causing monopole radiation with scattering coefficient
 $f_1$. (c) Density contrast: particle oscillates due to inertia difference, causing dipole radiation with scattering coefficient
 $f_2$.

We actuate the walls of a viscoelastic fluid-filled microchannel at the system's resonance frequency (see figure 1). This generates pressure and velocity perturbations in the fluid, which act as incoming waves for the particle, represented by  $p_{in}$ and
 $v_{in}$. The amplitudes of these waves vary with the fluid's viscoelastic properties and ABL formation at the channel walls, and are obtained through numerical simulations (see § 3). In theory, we denote the incoming and scattered waves as
 $\phi _{in}$ and
 $\phi _{sc}$, respectively, with the total field
 $\phi _1 = \phi _{in} + \phi _{sc}$. The velocities are given by
 $\boldsymbol {v}_{in} = \boldsymbol {\nabla } \phi _{in}$ for the incoming wave,
 $\boldsymbol {v}_{sc} = \boldsymbol {\nabla } \phi _{sc}$ for the scattered wave and
 $\boldsymbol {v}_1 = \boldsymbol {v}_{in} + \boldsymbol {v}_{sc}$ for the first-order velocity. Figure 2(a) shows the acoustic wavelength
 $\lambda _0$, boundary layer thickness
 $\delta _{ve}$ and viscous shear wavelength
 $\lambda _{ve}$, comparing the scales of the incoming compressible and scattered shear waves. A spherical coordinate system
 $(r, \theta, \varphi )$ is used for the analysis.
In response to external acoustic perturbations, the fluid's behaviour changes radially from the particle's surface, forming three distinct regions. In the boundary layer region  $(a < r \lesssim a + 5 \delta _{ve})$, viscoelastic properties dominate due to high shear gradients. Here, the fluid is considered to be incompressible because the wave propagation time through the boundary layer is much shorter than the acoustic wave's oscillation period
 $( {5 \delta _{ve}}/{c_0} \ll {1}/{\omega } )$. Field variations in this region exhibit an exponential decay, falling below 1 % at a distance of
 $5 \delta _{ve}$. We use this distance to differentiate between the boundary layer and near-field region (discussed in supplemental material § 1), and the exact value of the prefactor is not critical in our analysis. The near-field region is defined as
 $a + 5 \delta _{ve} \lesssim r \ll \lambda _0$ and the far-field region as
 $r \gg \lambda _0$, with the fluid considered inviscid and compressible in both the regions.
We characterize the acoustic wave scattering from a point scatterer using a time-retarded multipole expansion. In the far-field region (see figure 2a), only monopole ( $\phi _{mp}$) and dipole (
 $\phi _{dp}$) components are significant and take the forms
 $\phi _{mp}({r}, t)=b(t-r/c_0)/r$ and
 $\phi _{dp}({r}, t)=\boldsymbol {\nabla } \boldsymbol{\cdot} [\boldsymbol {B}(t-r/c_0)/r]$, where
 $b$ and
 $\boldsymbol {B}$ are functions of
 $(t-r/c_0)$ (Bruus Reference Bruus2012b; Settnes & Bruus Reference Settnes and Bruus2012). The scalar function
 $b$ is related to the first-order density field (
 $b \sim \rho _{{in}}$), and the vector function
 $\boldsymbol {B}$ corresponds to the first-order velocity field (
 $\boldsymbol {B} \sim \boldsymbol {v}_{{in}}$). Thus, in the far field, the total scattering field
 $\phi _{sc} \approx \phi _{mp} + \phi _{dp}$, can be expressed as
 \begin{equation} \phi_{s c}({r}, t)={-}f_1 \frac{a^3}{3 \rho_0} \frac{\partial_t \rho_{i n}(t-r / c_0)}{r}-f_2 \frac{a^3}{2} \boldsymbol{\nabla} \boldsymbol{\cdot} \left[\frac{\boldsymbol{v}_{i n}(t-r / c_0)}{r}\right]. \end{equation}
Here,  $f_1$ is the monopole scattering coefficient and
 $f_2$ is the dipole scattering coefficient. To maintain the correct dimensions of
 $\phi _{sc}$, we introduce
 $a$,
 $\rho _0$ and
 $\partial _t$ in (2.24). In the near-field region
 $a + 5 \delta _{ve} \lesssim r \ll \lambda _0$, the scattering field depends on the instantaneous argument
 $t$, unlike the time-retarded argument in the far field (Bruus Reference Bruus2012b; Settnes & Bruus Reference Settnes and Bruus2012). Thus, the total scattered field becomes
 \begin{equation} \phi_{s c}(r, \theta)=\phi_{m p}(r)+\phi_{d p}(r, \theta)={-}f_1 \frac{a^3}{3 \rho_0} \partial_t \rho_{i n} \frac{1}{r}+f_2 \frac{a^3}{2} v_{i n} \frac{\cos \theta}{r^2}. \end{equation}
The first-order velocity and pressure field can be expressed as
 \begin{equation} \boldsymbol{v}_1=\boldsymbol{\nabla} \phi_1=\boldsymbol{\nabla} \phi_{in}+\boldsymbol{\nabla} \phi_{sc}, \quad p_1={-}\rho_0 \partial_t \phi_1={-}{\rm i} \rho_0 \omega(\phi_{i n}+\phi_{s c}). \end{equation}
We calculate the ARF using (2.17) for an arbitrary surface in the far-field region. Here, the fluid is inviscid, therefore viscous and viscoelastic stresses are zero, and  $\boldsymbol {\sigma }_2$ simplifies to the time-averaged second-order pressure:
 $\langle p_2\rangle =\kappa _0 \langle p_1^2\rangle /2-\rho _0\langle v_1^2\rangle /2$, similar to Settnes & Bruus (Reference Settnes and Bruus2012). Using the incoming and far-field scattered fields (2.26a,b), we derive the ARF expression (see supplemental material § 1.2), which simplifies as follows:
 $$\begin{gather} \boldsymbol{F}_{r a d}={-}\boldsymbol{\nabla} U_{r a d}, \end{gather}$$
 $$\begin{gather}U_{{rad }}=\frac{4 {\rm \pi}}{3} a^3\left[f_1 \frac{\kappa_0}{2}\langle p_{i n}^2\rangle-f_2 \frac{3 \rho_0}{4}\langle v_{i n}^2\rangle\right]. \end{gather}$$
Here,  $U_{rad}$ is the acoustic potential,
 $f_1$ and
 $f_2$ are unknowns that need to be determined for the case of viscoelastic fluid to predict the ARF.
When a fluid with a particle is subjected to pressure oscillations, the particle compresses and expands. If the particle's compressibility differs from that of the fluid, it generates fluid flow towards or away from the particle (Challis et al. Reference Challis, Povey, Mather and Holmes2005). For a small spherical particle, this resembles a monopole source, where a more compressible particle ejects fluid at a rate of  $\partial _t m$, calculated using the scattered first-order velocity field
 $\rho \boldsymbol {v}_{sc}$ (Bruus Reference Bruus2012b; Settnes & Bruus Reference Settnes and Bruus2012; Karlsen & Bruus Reference Karlsen and Bruus2015). Following Settnes & Bruus (Reference Settnes and Bruus2012), we find that viscoelasticity does not affect the monopole scattering coefficient
 $f_1$ (see supplemental material § 1.3). Therefore,
 $f_1$ can be expressed as
 \begin{equation} f_1({\kappa}_{P}^*)=1-{\kappa}_{P}^*. \end{equation}
Here,  ${\kappa }_P^*$ is the compressibility ratio between particle and viscoelastic fluid,
 ${\kappa }_{P}^*=\kappa _P / \kappa _0$.
The dipole scattering coefficient  $f_2$ arises from the density difference between the particle and the surrounding fluid (Bruus Reference Bruus2012b). For denser particles, pressure waves cause oscillatory motion due to inertia differences (Challis et al. Reference Challis, Povey, Mather and Holmes2005). This motion is influenced by the viscous boundary layer (Settnes & Bruus Reference Settnes and Bruus2012). In this study, we present a new expression for
 $f_2$ that includes both viscous and elastic effects of the fluid, which were not considered in previous studies (Doinikov et al. Reference Doinikov, Fankhauser and Dual2021a,Reference Doinikov, Fankhauser and Dualb). The value of
 $f_2$ is determined through asymptotic matching of the velocity in the ABL with the near-field region, as detailed in supplemental material § 1.3. Therefore,
 $f_2$ can be expressed as
 $$\begin{gather} f_2(\rho_P^*, {\delta}_{v e}^*, {\lambda}_{ve}^*)=\frac{2[1-\gamma^*({\delta}_{v e}^*, {\lambda}_{ve}^*)]({\rho}^*_P-1)}{2 {\rho}^*_P+1-3 \gamma^*({\delta}_{v e}^*, {\lambda}_{ve}^*)}, \end{gather}$$
 $$\begin{gather}\gamma^*({\delta}_{v
e}^*, {\lambda}_{ve}^*)=\frac{3 (1+{\rm i})[1+Q+{\rm i} (1+P)]}{(P-{\rm i}
Q)^2},
\end{gather}$$
and  $P$ and
 $Q$ become
 \begin{equation} P=\frac{1}{{\delta}_{v e}^*}+\frac{2 {\rm \pi}}{{\lambda}_{ve}^*} \quad \textrm{and} \quad Q=\frac{1}{{\delta}_{v e}^*}-\frac{2 {\rm \pi}}{{\lambda}_{ve}^*}. \end{equation}
Here,  $\delta _{ve}^*$ and
 $\lambda _{ve}^*$ are the dimensionless ABL thickness and viscous shear wavelength in a viscoelastic fluid, defined as
 $\delta _{ve}^* = \delta _{ve} / a$ and
 $\lambda _{ve}^* = \lambda _{ve} / a$. The density ratio between the particle and fluid is represented by
 $\rho _P^* = \rho _P / \rho _0$. The dipole scattering coefficient
 $f_2$ depends on
 $\delta _{ve}^*$ and
 $\lambda _{ve}^*$, which are functions of the viscoelastic parameters
 $\mu _s$,
 $\mu _p$ and
 $\tau$, as obtained from (2.20) and (2.21). In the absence of elasticity, for a viscous fluid,
 $\lambda _{ve} / \delta _{ve} = \lambda _v / \delta _v = 2{\rm \pi}$, matching the results of Settnes & Bruus (Reference Settnes and Bruus2012). For an ideal fluid with zero viscosity (
 $\delta _{ve}^* = 0$ and
 $\lambda _{ve}^* = 0$), (2.30) simplifies to
 $f_2 = 2(\rho _P^* - 1) / (2\rho _P^* + 1)$, as established by Gorkov (Reference Gorkov1962).
For an ideal fluid, in a microchannel exposed to a one-dimensional (1-D) S-BAW of the form  $\tilde {p}_{in} = p_a \cos (k_y y)$ with
 $\lambda _0 \gg a$, the expression for the ARF (equation 2.27) simplifies to (Yosioka Reference Yosioka1955; Gorkov Reference Gorkov1962; Bruus Reference Bruus2012b)
 \begin{equation} F_{rad}=4 {\rm \pi}\varPhi({\kappa}^*_P, {\rho}^*_P) a^3 k_y E_{{ac}} \sin (2 k_y y), \quad \varPhi({\kappa}_{P}^*, {\rho}^*_P)=\tfrac{1}{3} f_1({\kappa}_P^*)+\tfrac{1}{2} f_2^r({\rho}_P^*). \end{equation}
Here,  $\varPhi$,
 $a$,
 $k_y$ and
 $E_{ac}$ denote the ACF, particle radius, wavenumber and AED, respectively. The compressibility and density ratios are represented by
 $\kappa ^*_P = \kappa _P / \kappa _0$ and
 $\rho ^*_P = \rho _P / \rho _0$. The value of
 $E_{ac}$ is independent of fluid properties and is given by
 $E_{ac} = p_a^2 / (4\rho _0^2 c_0^2)$. Settnes & Bruus (Reference Settnes and Bruus2012) modified the expression for
 $F_{rad}$ for a viscous fluid by correcting the ACF (
 $\varPhi$) to account for the acoustic boundary layer thickness
 $\delta _v$, which depends on fluid viscosity.
Our study considers a rectangular channel with a 1-D S-BAW (see figure 1). The channel width is set to  $\lambda _0 / 2$ to achieve resonance with a unidirectional pressure wave, which serves as the incoming wave for the particle. The incoming wave is assumed to be in resonance, and has the form
 $\tilde {p}_{in} = p_a^{ve} \cos (k_y y)$, and the AED is
 $E_{ac}^{ve} = {(p_a^{ve})^2}/{4 \rho _0^2 c_0^2}$. Here,
 $p_a^{ve}$ is the amplitude of the incoming pressure field generated inside the microchannel which varies with viscoelastic parameters. The wavenumber along the
 $y$ direction is
 $k_y = {2 {\rm \pi}}/{\lambda _0}$. Following the works of Yosioka (Reference Yosioka1955) and Settnes & Bruus (Reference Settnes and Bruus2012), we modify the expression for the ARF incorporating the viscoelastic parameters,
 $$\begin{gather} F_{{rad}}=4 {\rm \pi}\varPhi({\kappa}_{P}^*, {\rho}^*_P, {\delta}_{v e}^*, {\lambda}_{ve}^*) a^3 k_y E_{a c}^{ve} \sin(2 k_y y), \end{gather}$$
 $$\begin{gather}\varPhi({\kappa}_{P}^*, {\rho}^*_P, {\delta}_{v e}^*, {\lambda}_{ve}^*)=\tfrac{1}{3} f_1({\kappa}_P^*)+\tfrac{1}{2} f_2^r({\rho}_P^*, {\delta}_{v e}^*, {\lambda}_{ve}^*). \end{gather}$$
The ACF ( $\varPhi$) for viscoelastic fluids depends on
 $\delta _{ve}^*$,
 $\lambda _{ve}^*$,
 $\rho _P^*$ and
 $\kappa _P^*$. Here,
 $\delta _{ve}^*=\delta _{ve}/a$ and
 $\lambda _{ve}^*=\lambda _{ve}/a$. However,
 $\delta _{ve}$ and
 $\lambda _{ve}$ are functions of the viscoelastic parameters (
 $\mu _s$,
 $\mu _p$,
 $\tau$),
 $\rho _0$ and
 $\omega$, as given by (2.20) and (2.21). We compute
 $\varPhi$ by substituting equation (2.29) and the real part of (2.30) into (2.35). Further, we refine the AED for viscoelastic fluids by accounting for boundary layer effects at the channel walls, given by
 $E_{ac}^{ve} = (p_a^{ve})^2 / (4 \rho c_0^2)$. The amplitude of acoustic pressure in the viscoelastic fluid
 $p_a^{ve}$, which depends on
 $\mu$ and
 $\tau$, is determined through numerical simulations detailed in § 3. In summary, we derived an expression for the ARF in viscoelastic fluids by decoupling the effects of viscoelasticity on
 $\varPhi$ and
 $E_{ac}^{ve}$, particularly for
 $a \ll \lambda _0$, contrasting the approach taken by Doinikov et al. (Reference Doinikov, Fankhauser and Dual2021a,Reference Doinikov, Fankhauser and Dualb). This new expression for ARF enhances our understanding of the effects of fluid viscoelasticity on the AED and ACF and consequently the particle migration dynamics.
2.4. Acoustic particle migration characteristics
We present a new formulation for particle migration in a viscoelastic fluid under ultrasonic excitation. A particle in a viscoelastic fluid experiences several forces: ARF, inertial force, viscoelastic force and drag force. The ARF varies along the direction of the standing wave, and is proportional to  $\sin {(2 k_y y)}$ (see (2.34)). Besides ARF, inertial force can also influence particle migration; however, a comparison of the acceleration time scale
 $(\tau _a=(4 / 3) {\rm \pi}a^3 \rho _P / 6 {\rm \pi}\mu a)$ and the translation time scale
 $(\tau _{ {trans }}=W / 2 V_P)$ reveals that the acceleration time scale
 $(10^{-6}\ \mathrm {s})$ is much smaller than the translation time scale
 $(10^{-2}\ \mathrm {s})$, allowing us to neglect inertial effects (Muller et al. Reference Muller, Rossi, Marín, Barnkob, Augustsson, Laurell, Kähler and Bruus2013). Here,
 $V_P$ is the particle velocity. In viscoelastic flows, particle migration arises from the imbalance in the first normal stress difference,
 ${\mathsf{N}}_1(\dot {\gamma })=\sigma _{x x}-\sigma _{y y}$, and the viscoelastic force
 $(F_e)$ is expressed as (Leshansky et al. Reference Leshansky, Bransky, Korin and Dinnar2007)
 $F_e \sim a^3(\partial {\mathsf{N}}_1(\dot {\gamma }) / \partial y)$. However, we consider a quiescent fluid with a negligible strain rate
 $(\dot {\gamma })$ and therefore
 $F_e$ is taken to be zero.
With inertial and viscoelastic forces negligible, particle migration is governed by the balance of ARF and drag force that can be explained in a Lagrangian framework. Our study focuses on particles with a diameter of  $15 \ \mathrm {\mu }$m
 $(\beta =a/(W/2)=0.0375)$. Stokes drag due to acoustic streaming is significant for submicron particles, while the ARF dominates for particles of diameter above
 $2\ \mathrm {\mu }$m (Lighthill Reference Lighthill1978; Barnkob et al. Reference Barnkob, Augustsson, Laurell and Bruus2010; Muller et al. Reference Muller, Barnkob, Jensen and Bruus2012). Consistent with this, our experiments did not show any traces of acoustic flow rolls, allowing us to neglect the influence of Stokes drag arising from acoustic streaming. We introduce an ordinary differential equation to express Newton's law of motion for the particle. If
 $m$ is the mass of a particle,
 $V_P$ is the particle velocity at position
 $y$ and the different forces are represented by
 $F_i(y)$, a force balance on the particle gives
 \begin{equation} m \frac{{\rm d} V_P}{{\rm d} t}=\sum_i F_i(y). \end{equation}
Neglecting the inertial, gravitational (Barnkob et al. Reference Barnkob, Augustsson, Laurell and Bruus2010) and viscoelastic forces, (2.36) reduces to
 \begin{equation} F_{{drag }}=F_{ {rad }}. \end{equation}
Due to the inherent viscoelastic properties of the fluid, there is a change in the drag coefficient and the correction in the drag coefficient for a spherical particle has been reported by Faroughi et al. (Reference Faroughi, Fernandes, Miguel Nóbrega and McKinley2020). Thus, the drag force in a viscoelastic fluid can be expressed as
 \begin{equation} F_{d r a g}=6 {\rm \pi}\mu a \xi V_p. \end{equation}
Here,  $\xi$ represents the drag coefficient correction. For a quiescent fluid considered in our study,
 $\xi \approx 1$ (Faroughi et al. Reference Faroughi, Fernandes, Miguel Nóbrega and McKinley2020). Incorporating equations (2.34) and (2.38) in (2.37) gives
 \begin{equation} 6 {\rm \pi}\mu a \xi \frac{{\rm d} y}{{\rm d} t}=4 {\rm \pi}\varPhi({\kappa}_P^*, {\rho}_P^*, {\delta}_{v e}^*, {\lambda}_{ve}^*) a^3 k_y E_{ac}^{ve} \sin (2 k_y y). \end{equation}
By simplifying equation (2.39), we obtain
 \begin{equation} V_P=\frac{2 \varPhi({\kappa}_P^*, {\rho}_P^*, {\delta}_{v e}^*, {\lambda}_{ve}^*) k_y a^2 E_{a c}^{ve} \sin (2 k_y y)}{3 \mu \xi}. \end{equation}
Integrating the equation via separation of variables  $y$ and
 $t$ gives the analytical expression for the particle trajectory, which is expressed as
 \begin{equation} y(t)=\frac{1}{k_y} \arctan \left\{\tan [k_y y(0)] \exp \left[\frac{4 \varPhi({\kappa}_P^*, {\rho}_P^*, {\delta}_{v e}^*, {\lambda}_{ve}^*)(k_y a)^2 E_{a c}^{ve} t}{3 \mu \xi}\right]\right\}. \end{equation}
Here,  $y(0)$ and
 $y(t)$ are the initial location and particle location at a time instant
 $t$, respectively. We obtain an expression for the particle migration time by adjusting (2.41) as
 \begin{equation} t=\frac{3 \mu \xi}{4 \varPhi({\kappa}_P^*, {\rho}_P^*, {\delta}_{v e}^*, {\lambda}_{ve}^*)(k_y a)^2 E_{a c}^{ve}} \ln \left[\frac{\tan [k_y y(t)]}{\tan [k_y y(0)]}\right]. \end{equation}
We validate the theory described above using experiments, and the details are given in § 4.
3. Numerical simulations
We perform numerical simulations to determine acoustic field perturbations in the viscoelastic fluid inside the microchannel considering the boundary layer formation on the channel walls. These perturbations act as incoming waves to suspended particles and represent the AED in the fluid. Assuming a 1-D S-BAW along the  $y$-direction (figure 1a), we consider the variation of the acoustic field and AED along the length (
 $x$-direction) of the channel to be negligible. Therefore, we select the channel cross-section in the
 $y$–
 $z$ plane as the simulation domain. Similar to the experimental device, the domain of width 400
 $\mathrm {\mu }\text {m}$ and depth 300
 $\mathrm {\mu }\text {m}$ is filled with a viscoelastic fluid specified by
 $\mu _s$,
 $\mu _p$ and
 $\tau$.
We numerically solve (2.11)–(2.13) for the cross-section of the microchannel, excluding particles, using the finite element method in COMSOL Multiphysics 6.0. A detailed description of the numerical model is presented in supplemental material § 2. The channel sidewalls are excited with a velocity boundary condition,  $\tilde {\boldsymbol {v}}_1 = {\rm i}A \omega \hat {\boldsymbol {e}}_y$ in the frequency domain (Bach & Bruus Reference Bach and Bruus2018; Vargas et al. Reference Vargas, Campos-Silva, Méndez, Arcos and Bautista2022). Here,
 $A$ is the vibration amplitude, determined through 3-D numerical modelling of the experimental device (Barnkob et al. Reference Barnkob, Augustsson, Laurell and Bruus2010; Dual & Möller Reference Dual and Möller2012; Dual & Schwarz Reference Dual and Schwarz2012; Hahn et al. Reference Hahn, Leibacher, Baasch and Dual2015). The angular frequency
 $\omega = 2 {\rm \pi}f$, where
 $f \approx 1.93$ MHz is the resonant frequency of the experimental device. The top and bottom walls have a Lagrangian no-slip boundary condition. The first-order fields
 $(\kern0.7pt \tilde {p}_1, \tilde {v}_1)$ in the channel act as incoming waves for the particles, thus we denote the perturbations inside the fluid as
 $\tilde {p}_{in}$ and
 $\tilde {v}_{in}$. Due to half-wave resonance condition, the incoming pressure wave distribution is
 $\tilde {p}_{in} = p_a^{ve} \cos (k_y y)$, the amplitude of pressure field
 $p_a^{ve}$ is given by
 $\tilde {p}_{in}$ at the sidewall (at
 $y=0$). By following the approach for 1-D S-BAW wave in microchannels (Barnkob et al. Reference Barnkob, Augustsson, Laurell and Bruus2010; Bruus Reference Bruus2012b; Karlsen & Bruus Reference Karlsen and Bruus2015), we find AED using
 $E_{a c}^{ve}=(p_a^{ve})^2 / 4 \rho c_0^2$, where
 $p_a^{ve}$ depends on the fluid's viscoelastic properties.
We conduct a mesh convergence study following Muller & Bruus (Reference Muller and Bruus2014). The mesh convergence parameter,  $C_M$, for a solution
 $g$ with respect to a reference solution
 $g_{{ref}}$ is defined as
 $C_M(g)=[{\int (g-g_{{ref}})^2 \,{{\rm d} y} \,{\rm d} z}/{\int (g_{{ref}})^2 \,{{\rm d} y} \, {\rm d} z}]^{1/2}$. We choose
 $C_M = 10^{-3}$, and select the mesh by ensuring
 $\delta _{ve}/d_{bd}$ is greater than 1 at which both the first- and second-order fields converge. Here,
 $d_{bd}$ is the mesh size in the boundary layer. We validate the numerical model for both first- and second-order fluid fields against Hintermuller et al. (Reference Hintermuller, Reichel and Jakoby2017), which shows close agreement (see supplemental material § 2.1). We also predict the ARF using a numerical model (Baasch et al. Reference Baasch, Pavlic and Dual2019) and compare it with the theoretical predictions (supplemental material § 2.1). The predicted acoustic perturbations and ARF are also validated with existing studies (Hintermuller et al. Reference Hintermuller, Reichel and Jakoby2017; Doinikov et al. Reference Doinikov, Fankhauser and Dual2021a) (see supplemental material § 2.2).
4. Experimental
Experiments are performed with dilute suspensions containing spherical polystyrene particles of size between 5 and 25  $\mathrm {\mu }$m (microParticles GmbH, Berlin) in viscoelastic and Newtonian fluids. Polyvinylpyrrolidone (PVP) solution, which is a pure viscoelastic fluid of molecular weight 0.36 MDa, (Sigma-Aldrich, USA) and polyethylene oxide (PEO) solution which is a shear-thinning viscoelastic fluid (Sigma-Aldrich, USA) of molecular weights 0.4 and 1.0 MDa are used as viscoelastic fluids. The details of the viscoelastic fluid preparation are given in supplemental material § 3.1. A mixture of deionized (DI) water and 0.3
 $\,\%$ glycerol (Sigma-Aldrich, Bangalore, India) is used as the Newtonian fluid. In both viscoelastic and Newtonian fluids, Iodixanol (OptiPrepTM, Sigma-Aldrich, Bangalore, India) is mixed to adjust the fluid density. The proportions are carefully tuned to avoid significant a difference in density and speed of sound between the viscoelastic and Newtonian fluids. The properties of the fluids are presented in table 1. The fluid viscosity is measured using a rotational rheometer (MCR 72, Anton-Paar). The relaxation time
 $\tau$ of dilute viscoelastic fluids are predicted using available correlations (Rouse Reference Rouse1953; Zimm Reference Zimm1956). Other viscoelastic fluid properties and details about the relaxation time measurement is given in supplemental material § 3.1.
Concentration and viscoelastic properties of various fluids, the Newtonian fluid is DI water+0.3 wt. $\%$ glycerol. For all of the fluids:
 $\mu _{bf}=0.89$ mPa s,
 $\rho ^*=\rho _0/\rho _{bf}\approx 1.007$ and
 $c^*=c_0/c_{bf}\approx 1.003$ (Rouse Reference Rouse1953; Zimm Reference Zimm1956; Tirtaatmadja, McKinley & Cooper-White Reference Tirtaatmadja, McKinley and Cooper-White2006).

A schematic diagram of the experimental set-up is shown in figure 3(a). The glass–silicon–glass microchip (see figure 3b) is fabricated by photolithography followed by dry reactive ion etching. First, the channel design is patterned on a 3 inch  $\langle 100\rangle$ silicon wafer of 300
 $\mathrm {\mu }$m thickness by coating the wafer with a positive photoresist (MICROPOSIT S1813), followed by UV exposure. The patterned wafer is through etched to realize a channel layer of 20 mm length having a rectangular cross-section of 400
 $\mathrm {\mu }$m width
 $(W)$ and 300
 $\mathrm {\mu }$m depth
 $(D)$. The channel is sealed with two borosilicate glasses of 500
 $\mathrm {\mu }$m thickness on top and bottom sides using anodic bonding by applying a voltage of 1000 V and temperature of 450
 $^{\circ }$C. Inlet and outlet holes are micro-drilled to establish fluidic connections.
Schematic of (a) experimental set-up, (b) acoustofluidic chip assembly.

The working fluid containing suspended particles is infused into the channel using a syringe pump (neMESYS pump, Cetoni GmbH, Germany). The microchannel is actuated using a piezoelectric transducer (2.0 MHz, Sparkler Piezoceramics) attached to the bottom glass lid using an epoxy with a sinusoidal signal generated from a function generator (SMC100A, Rohde Schwarz, Germany) and amplified using an amplifier (75A250A, Amplifier Research, USA) operating between 10 and 1000 mW.
The resonance frequency of the system is identified by introducing a 15  $\mathrm {\mu }$m spherical polystyrene particle suspension inside the channel and actuating the transducer between 1.85 and 2.1 MHz. At half-wave resonance condition, the particles quickly migrate to the nodal plane (Nath et al. Reference Nath, Malik and Sen2021) at the channel centre. The resonant frequency of the system is found to be 1.93 MHz, which is maintained throughout the study. We measure the AED for the base fluid at the resonance frequency using a particle tracking method (Barnkob et al. Reference Barnkob, Augustsson, Laurell and Bruus2010), and find it to be 48.3 J m
 $^{-3}$. The lateral migration of particles is observed using an inverted microscope (IX73, Olympus) coupled with a high-speed CCD camera (SA5, Photron) operating at 500 fps. The particle trajectory and velocity are determined by analysing the captured videos using a free video analysis and modelling tool, tracker 6.1.0.
5. Results and discussion
We study the effect of fluid viscoelasticity on the acoustic field and subsequently the transport dynamics of particles in microchannels of dimensions comparable to the acoustic wavelength  $(D \sim W \sim \lambda _0)$. In § 5.1, we report the behaviour of a viscoelastic fluid in a rectangular microchannel exposed to a S-BAW, where the fluid perturbations are influenced by the ABL on the microchannel walls. Then, we present and discuss the effects of ABL and the viscoelastic parameters of the fluid on the AED in § 5.2. Using theoretical formulations, we decouple the effects of AED on the ARF. We report the effects of fluid viscoelasticity and the AED on the ARF in § 5.3. The magnitude and distribution of the ARF in the fluid and the resulting particle migration dynamics are discussed in § 5.4. Here, we decouple the viscous and elastic effects on the acoustic force field and particle migration by studying the individual effects of
 $\mu _p$ and
 $\mu _s$ (with
 $\mu =\mu _p+\mu _s$) and
 $\tau$. Our study mainly addresses the effects of viscoelasticity and boundary layer formation at the microchannel walls on particle migration, which is missing in the literature. In our analysis, we non-dimensionalize the viscoelastic parameters: solvent viscosity
 $(\mu _s)$ via dimensionless solvent viscosity
 $\mu _s^*=\mu _s/\mu _{bf}$, polymer viscosity
 $(\mu _p)$ via dimensionless polymer viscosity
 $\mu _p^*=\mu _p/\mu _{bf}$ and relaxation time
 $(\tau )$ via the Deborah number
 $De=\tau \omega$. Here,
 $\mu _{bf}$ is the base Newtonian fluid (DI water) viscosity, and
 $\omega$ is the angular frequency, which is kept constant throughout the study. Similarly, the dimensionless complex viscosity, density and speed of sound of the fluid are taken as,
 $\mu _c^*=\mu _c/\mu _{bf}$,
 $\rho ^*=\rho _0/\rho _{bf}$ and
 $c^*=c_0/c_{bf}$, respectively.
5.1. Effect of viscoelastic properties on fluid perturbations
A S-BAW induces perturbations in the viscoelastic fluid present in the microchannel. We analyse the variation of the first-order fields  $(\kern0.7pt \tilde {p}_1, \tilde {{v}}_1)$ along the channel width (
 $\kern0.7pt y$-direction) (refer to figure 1a) and depth (
 $z$-direction) in the absence of particles by numerically solving (2.11)–(2.13), as detailed in § 2.3. These perturbed fields act as incoming fields for the particle, hence we name them as
 $p_{in}$ and
 $v_{in}$. Here,
 $v_{in}$ indicates the component of perturbed velocity field along the
 $y$-direction. The perturbed fields are characterized using dimensionless first-order fluid pressure,
 $p_{in}^* = \tilde {p}_{in}/(\rho _0 c_0 A \omega )$, and dimensionless first-order fluid velocity,
 $v_1^* = \tilde {v}_{in} / (A \omega )$ (Vargas et al. Reference Vargas, Campos-Silva, Méndez, Arcos and Bautista2022), where
 $A$ is the amplitude of vibration of the channel, and
 $\rho _0$ and
 $c_0$ are respectively the density and speed of sound of the viscoelastic fluid. The variations of the incoming fields are shown in figure 4. Here,
 $y^* = y/(W/2)$ and
 $z^* = z/(D/2)$. We compare the field fluctuations in a viscoelastic fluid for
 $De=0.1, 1.0, 10, 300$ and
 $10^5$ with those in a Newtonian fluid (
 $De = 0$), for a fixed total viscosity (
 $\mu ^* = 1001$, with
 $\mu _p^* = 1000$ and
 $\mu _s^* = 1$), density (
 $\rho ^* = 1$) and speed of sound (
 $c^* = 1$), thereby decoupling the elastic effects from the viscous effects.
Numerical results of dimensionless incoming pressure  $(p_{in}^*)$ and velocity
 $(v_{in}^*)$ fields in Newtonian (
 $De=0$) and viscoelastic fluids (
 $De=0.1, 1, 10, 300, 10^5$) at
 $\mu _p^*=1000$,
 $\mu _s^*=1$,
 $\rho ^*=1$ and
 $c^*=1$. Variation of (a)
 $p_{in}^*$ along
 $y^*$ (along width or S-BAW direction, at
 $z^*=1$), (b)
 $v_{in}^*$ along
 $y^*$ (
 $\kern0.7pt y^*=0$ and 2 as the channel walls,
 $y^*=1$ as the centre), (c)
 $p_{in}^*$ along
 $z^*$ (along depth or perpendicular to S-BAW, at
 $y^*=0.5$) and (d)
 $v_{in}^*$ along
 $z^*$ (symmetric about the channel centre
 $z^*=1$,
 $z^*=0$ is the channel wall perpendicular to S-BAW direction), refer to figure 1. (e) Theoretical and numerical variation of dimensionless boundary layer thickness (
 ${\delta }_{v e}^*$), viscous shear wavelength (
 ${\lambda }_{ve}^*$),
 $\alpha$ (
 ${\lambda }_{ve}^*/{\delta }_{v e}^*$) and
 $E_{ac}^*$ with
 $De$.

We depict the distribution of  $p_{in}^*$ along the channel width
 $y^*$ in figure 4(a), where its magnitude varies from a maximum at the channel walls (
 $\kern0.7pt y^* = 0$ or
 $y^* = 2$) to zero at the channel centre (
 $\kern0.7pt y^* = 1$). A zero value of
 $p_{in}^*$ indicates a pressure node, signifying the absence of the primary ARF. In contrast,
 $v_{in}^*$ attains a maximum at the centre and decreases to zero at the walls, suggesting a velocity node at the walls, as shown in figure 4(b). The fluid field variation along
 $z^*$ is symmetric about the channel centre
 $z^* = 1$. A decrease in
 $p_{in}^*$ from the wall
 $(z^* = 0)$ to the centre
 $(z^* = 1)$ is seen in figure 4(c), while figure 4(d) depicts oscillations in
 $v_{in}^*$ near the wall that stabilize at the centre. These fluctuations can be attributed to viscous shear disturbances and acoustic boundary layer formation resulting from the no-slip condition at the walls and acoustic perturbations (Hamilton, Ilinskii & Zabolotskaya Reference Hamilton, Ilinskii and Zabolotskaya2003; Baasch & Dual Reference Baasch and Dual2018). Specifically, the ABLs formed at the top and bottom walls of the microchannel (shown in figure 1a) affect the pressure and velocity distribution along the
 $z$-direction. A change in nature of shear waves near particles with viscoelastic parameters has been reported by Doinikov et al. (Reference Doinikov, Fankhauser and Dual2021a). However, in their study, the discussion is limited to the effect of boundary layer formation on a particle in a viscoelastic fluid from the perspective of acoustic streaming. Here, we study the effects of viscoelasticity on the incoming waves and unravel the effects of boundary layer formation at the channel walls on the perturbations.
Here, the viscous shear disturbances propagate from the walls to the bulk, in the  $z$-direction, i.e. perpendicular to the S-BAW direction, influenced by the fluid properties. The characteristics of viscous shear waves with
 $De$ are shown in figure 4(e), where the viscous shear wave is characterized using the dimensionless boundary layer thickness (
 ${\delta }_{ve}^*=\delta _{ve}/a$) and the dimensionless viscous shear wavelength (
 ${\lambda }_{ve}^*=\lambda _{ve}/a$). The parameter
 ${\delta }_{ve}^*$ indicates the penetration distance of viscous disturbances, while
 ${\lambda }_{ve}^*$ provides an idea about the wavelength of shear waves or the number of oscillations in the vicinity of the channel wall, as obtained from (2.20) and (2.21). In the absence of elasticity (
 $De \approx 0$) or in low elasticity fluids (at very low values of
 $De =0.1$), the shear waves attenuate easily due to higher viscous effects, and oscillations are overdamped (shown in figure 4d), indicated by a smaller
 ${\delta }_{ve}^*$ and larger
 ${\lambda }_{ve}^*$ (
 ${\lambda }_{ve}^* > {\delta }_{ve}^*$) in figure 4(e). Here,
 $\varsigma =\rho _0 \omega /(2\mu _{bf} \mu ^*)$ and
 $\chi =0$ (2.23a,b). From (2.13), (2.20) and (2.21), the dimensionless complex viscosity
 $\mu _c^* (=\mu _c/\mu _{bf})$,
 $\delta _{ve}^*$ and
 $\lambda _{ve}^*$ reduce to
 \begin{equation} \mu_c^*|_{De \rightarrow 0}= \mu_s^*+\mu_p^*, \quad \delta_{ve}^*|_{De \rightarrow 0}=\frac{1}{a}\sqrt{\frac{2 \mu_{bf}(\mu_s^*+\mu_p^*)}{\rho_0 \omega}} \quad \textrm{and} \quad \lambda_{ve}^*|_{De \rightarrow 0}=2 {\rm \pi}\delta_{ve}^*. \end{equation}
As  $De$ increases to intermediate values (
 $De=1.0$ and
 $10$) or in moderate elasticity fluids, the amplitude, frequency and propagation distance of viscous shear waves increase due to the transition from a viscous to an elastic state. This transition is shown by the variation of
 $v_{in}^*$ over a larger distance from the channel wall in figure 4(d). Further, as depicted in figure 4(e), there is an increase in
 ${\delta }_{ve}^*$ and a decrease in
 ${\lambda }_{ve}^*$, with
 ${\delta }_{ve}^*$ being greater than
 ${\lambda }_{ve}^*$. Here,
 $\mu _c^*$,
 $\varsigma$ and
 $\chi$ reduce to
 \begin{gather}\begin{gathered}
\mu_c^*|_{De}= \mu_s^*+\frac{\mu_p^*}{1+iDe}, \nonumber\\
\varsigma|_{De}=\frac{\rho_0 \omega[\mu^*+\mu_s^* De^2]}{2
\mu_{bf} [\mu^{*2}+\mu_s^{*2} De^2]} \quad \textrm{and}
\quad \chi|_{De}=\frac{\rho_0 \omega[\mu^* -\mu_s^*]De}{2
\mu_{bf}
[\mu^{*2}+\mu_s^{*2}De^2]}.
\end{gathered}\end{gather}
By substituting the above values of  $\varsigma$ and
 $\chi$ into (2.20) and (2.21), we obtain the variation of
 $\delta _{ve}^*$ and
 $\lambda _{ve}^*$ for intermediate
 $De$ values.
At a higher  $De$ or for high elasticity fluids, disturbances attenuate faster with further increases in
 $De$ (
 $De = 300$ and
 $10^5$) due to a decrease in the contribution of
 $\mu _p^*$ to
 $\mu _c^*$, as indicated by a decrease in
 ${\delta }_{ve}^*$ in figure 4(d), which stabilizes at higher
 $De$ values. At very high
 $De$ (
 $=10^5$), the polymer contribution to the complex viscosity approaches zero, restricting the propagation of viscous shear waves to a smaller distance from the wall, indicated by variations in
 $v_{in}^*$ very close to the wall in figure 4(d) and negligible variation of
 ${\delta }_{ve}^*$ and
 ${\lambda }_{ve}^*$ with
 $De$ in figure 4(e), where
 ${\lambda }_{ve}^*>\delta _{ve}^*$. Here,
 $\varsigma =\rho _0 \omega /(2\mu _{bf} \mu _s^*)$ and
 $\chi =0$. The values of
 $\mu _c^*$,
 $\delta _{ve}^*$ and
 $\lambda _{ve}^*$ reduce to
 \begin{equation} \mu_c^*|_{De \rightarrow \infty}= \mu_s^*, \quad \delta_{ve}^*|_{De \rightarrow \infty}=\frac{1}{a}\sqrt{\frac{2 \mu_{bf}\mu_s^*}{\rho_0 \omega}} \quad \textrm{and} \quad \lambda_{ve}^*|_{De \rightarrow \infty}=2 {\rm \pi}\delta_{ve}^*. \end{equation}
The variation in amplitude of  $v_{in}^*$ along
 $y^*$ and
 $z^*$ shows a non-monotonic pattern with increasing
 $De$, as shown in figures 4(b) and 4(d). At low
 $De$
 $(De \leq 1)$, higher momentum transfer to the fluid occurs with increasing
 $De$ or elasticity, causing an increase in
 $v_{in}^*$. Beyond
 $De=1$, due to a significant reduction in effective viscosity,
 $v_{in}^*$ decreases. Our results in figures 4(a) and 4(c) illustrate an increase in pressure amplitude of incoming waves from
 $De = 0$ to
 $De = 300$ at a fixed
 $\mu ^*$, followed by a small decrease and then negligible variation with further increases in
 $De$. However, the rate of increase in
 $p_{in}^*$ with
 $De$ is minimal for fluids with low elasticity (
 $De \ll 1$), more pronounced for fluids with moderate elasticity (intermediate
 $De$) and negligible for fluids with high elasticity
 $(De=10^5)$. Interestingly, in narrow microchannels where the acoustic boundary layer thickness
 $\delta _{ve}$ is comparable to the channel depth
 $D$ but much smaller than the channel width
 $W$ and acoustic wavelength
 $\lambda _0$ (
 $\delta _{ve} \sim D \ll W \sim \lambda _0$), Vargas et al. (Reference Vargas, Campos-Silva, Méndez, Arcos and Bautista2022) reported a continuous increase in pressure with relaxation time, with pressure being proportional to
 $De^{1/2}$. However, this relationship does not hold for commonly used microchannels in acoustofluidics, where
 $\delta _{ve}$ is smaller and both
 $D$ and
 $W$ are comparable to
 $\lambda _0$ (
 $\delta _{ve} < D \sim W \sim \lambda _0$). Thus our findings highlight a remarkable differences in the behaviour of pressure waves in commonly used microchannels as compared with narrow microchannels, highlighting the unique attributes of the present study.
Generally, a fluid undergoes relaxation when exposed to external perturbations, and it depends on the relaxation time scale  $\tau$. In a viscous fluid,
 $\tau \sim 0$, and in an elastic body,
 $\tau \sim \infty$. Viscoelastic fluids have a relaxation time between the two extremes (Bird, Armstrong & Hassager Reference Bird, Armstrong and Hassager1977; Joseph Reference Joseph2013), and
 $De$ represents the fluid relaxation time
 $(\tau )$ with respect to the time period of acoustic perturbation
 $(t_f=1/\omega )$. For viscoelastic fluids with
 $De \ll 1$ (
 $\tau \ll t_f$), stress generated by the perturbation relaxes faster than the actuation period, causing a low pressure amplitude. At high
 $De$ (
 $\tau \gg t_f$), stress generated by the perturbation relaxes very slowly, showing higher incoming pressure amplitude compared with a Newtonian fluid (
 $De = 0$). Therefore, viscoelastic fluids exhibit a distinct behaviour compared with Newtonian fluids due to the variations in fluid's elasticity,
 ${\delta }_{ve}^*$ and
 ${\lambda }_{ve}^*$, as shown in figure 4(a–d).
We introduce a parameter  $\alpha = {\lambda }_{ve}^* / {\delta }_{ve}^*= {\lambda }_{ve} / {\delta }_{ve}$, shown in figure 4(e), to study the relative variation of the length scales related to the viscous shear wave. The viscous shear wave parameter
 $\alpha$ attains a value of approximately
 $2 {\rm \pi}$ for low elasticity (
 $De \ll 1$) and high elasticity fluids
 $De$ (
 $De \gg 1$). For moderate elasticity fluids (moderate
 $De$ values),
 $\alpha$ decreases up to
 $De \approx 10$, beyond which it increases. This trend can be attributed to the variations in
 ${\delta }_{ve}^*$ and
 ${\lambda }_{ve}^*$, providing deeper insights into the viscoelasticity of fluids. The variations in the incoming fields directly indicate changes in the AED of the fluid. We characterize AED using the dimensionless AED (
 $E_{ac}^*$), defined as the ratio of
 $E_{ac}$ for a viscoelastic fluid to that of the base Newtonian fluid,
 $E_{ac}^* = {E_{ac}^{ve}}/{E_{ac}^{bf}}$, as shown in figure 4(e). Interestingly, at a fixed value of
 $\mu ^*$, we observe that, with increasing elasticity or
 $De$ (keeping
 $t_f$ fixed),
 $E_{ac}^*$ increases, mirroring the variation in amplitude of the incoming pressure wave, as shown in figure 4(a). The rate of increase, however, varies across the different ranges of
 $De$. For low elasticity fluids (
 $De\ll 1$), the change in
 $E_{ac}^*$ is negligible. Conversely, moderate elasticity fluids (moderate
 $De$) show a significant rise in
 $E_{ac}^*$ with
 $De$, corresponding to a marked increase in incoming pressure wave amplitude in figure 4(a). Further increase in
 $De$ results in a negligible change in the incoming pressure field, leading to a nearly fixed value of
 $E_{ac}^*$ in highly elastic fluids (
 $De \gg 1$). Viscous effects dominate in low elasticity fluids, while elasticity effects surpass viscous effects in high elasticity fluids. Higher viscous effects indicate an energy dissipation state, whereas higher elasticity effects indicates an energy storage state. Thus, with increasing
 $De$, a viscoelastic fluid transitions from an energy dissipation state (relaxation mode or relaxing state of AED) to an energy storage state (frozen mode or freezing state of AED) where energy dissipation is minimized (Bird et al. Reference Bird, Armstrong and Hassager1977; Joseph Reference Joseph2013).
In the next section, we investigate the transition of AED with  $De$ at different
 $\mu _p^*$ and
 $\mu _s^*$, that affects the ARF and particle migration. Our study unveils novel insights into the energy states of viscoelastic fluids under varying conditions, contributing significantly to the understanding of fluid behaviour in microfluidic environments exposed to the acoustic waves.
5.2. Effect of viscoelastic properties on acoustic energy density
Acoustic waves can transport energy without a net fluid transfer (Lighthill Reference Lighthill1978). Viscous attenuation alters the acoustic field and AED in viscous fluids (Allegra & Hawley Reference Allegra and Hawley1972). However, the impact of viscoelastic properties on AED in micro-confinements is not well studied. Therefore, we numerically analyse AED transition in a microchannel due to variations in the viscoelastic parameters  $\mu _p^*$,
 $\mu _s^*$ and
 $De$ (see §§ 2.1 and 3). Using the theoretical formulations in § 2.2 for
 $\delta _{ve}$,
 $\lambda _{ve}$ and
 $\alpha (=\lambda _{ve}/\delta _{ve})$, we relate variations in dimensionless AED
 $(E_{ac}^* = {E_{ac}^{ve}}/{E_{ac}^{bf}})$ to the characteristics of viscous shear waves.
We depict the variation of  $E_{ac}^*$ with
 $\mu _p^*$ in figure 5(a) for three different cases: (i) small
 $De$ (
 $De \leq ~1$, low elasticity fluids), (ii) intermediate
 $De$ (
 $1 < De \leq 100$, moderate elasticity fluids) and (iii) high
 $De$ (
 $De>100$, high elasticity fluids), with
 $\mu _s^* = 1$,
 $\rho ^* = 1$ and
 $c^* = 1$ fixed in all cases. For low elasticity fluids (
 $De \leq 1$), viscous effects dominate, with
 ${\delta }_{ve}^* < {\lambda }_{ve}^*$ and
 $\alpha > 1$. The variation of
 ${\delta }_{ve}^*$ and
 ${\lambda }_{ve}^*$ with
 $\mu _p^*$ is shown in figure 5(b-i) using solid and dashed lines, respectively. The corresponding variations in
 $\alpha$ are illustrated in figures 5(c) and 5(d). According to (5.1a–c) and figure 5(b-i), increasing
 $\mu _p^*$ amplifies
 $\delta _{ve}^*$ and viscous dissipation, reducing incoming fields and consequently the AED, as shown in figure 5(a-i). The decay is more rapid at smaller
 $\mu _p^*$ and slower at higher
 $\mu _p^*$, due to a higher rate of change in
 ${\delta }_{ve}^*$ and
 $\alpha$ at smaller
 $\mu _p^*$, which stabilizes at a higher
 $\mu _p^*$ (see figures 5a-i, 5b-i and 5c,d). Thus, viscoelastic fluids with
 $De \ll 1$ and
 $\tau \ll t_f$ exhibit energy dissipation at a faster rate similar to viscous fluids, depicting the relaxation mode. Interestingly,
 $E_{ac}^*$ increases with
 $De$ for all
 $\mu _p^*$, because an increase in
 $\tau$ decreases
 $\alpha$, leading to an increase in the incoming fields and energy storage, as mentioned in § 5.1. For moderate elasticity fluids (
 $1 < De \leq ~100$), elastic effects start to dominate over viscous effects, with
 $\delta _{ve}^* > \lambda _{ve}^*$ and
 $\alpha < 1$ for
 $De > 3$ (see figures 5b-ii and 5c,d). In this range,
 $E_{ac}^*$ decreases with
 $\mu _p^*$, but the rate of decrease slows down due to enhanced elastic effects, indicating a reduced contribution of polymer viscosity to viscous dissipation (see (5.2a–c)). As
 $De$ increases, the incoming pressure
 $p_{in}^*$ rises (figure 4a), and
 $E_{ac}^*$ approaches 1 for
 $De = 100$, suggesting a transition to a freezing state of AED (frozen mode) at all
 $\mu _p^*$.
(a) Numerical variation of dimensionless acoustic energy density ( $E_{ac}^*$) and corresponding (b) theoretical variation of
 $\delta _{ve}^*$ and
 $\lambda _{ve}^*$ with
 $\mu _p^*$ at different
 $De$: (i)
 $De \leq 1$, (ii)
 $1 < De \leq 100$, (iii)
 $De>100$. (c) Contour plot of
 $\alpha$ with
 $De$ and
 $\mu _p^*$. (d) Variation of
 $\alpha$ with
 $\mu _p^*$ at different
 $De$. Here, we consider
 $\mu _s^*=1$,
 $\rho ^*=1$ and
 $c^*=1$.

For high elasticity fluids ( $De>100$), elastic effects dominate over viscous effects, with
 $\delta _{ve}^* > \lambda _{ve}^*$ and
 $\alpha > 1$ (see figures 5b-iii and 5c,d). Here,
 $E_{ac}^*$ becomes nearly independent of
 $\mu _p^*$ and
 $De$ (see (5.3a–c)), as shown in figure 5(a-iii). Viscoelastic fluids with
 $De \gg 1$ and
 $\tau \gg t_f$ indicate energy storage, representing a freezing state of energy or frozen mode (Bird et al. Reference Bird, Armstrong and Hassager1977; Joseph Reference Joseph2013). The frozen mode shows a state of viscoelastic fluid where the AED is independent of
 $De$ and
 $\mu _p^*$. From figure 5(a-i–a-iii), we conclude that viscoelastic fluids exposed to ultrasound transition from a relaxing to a freezing state with increasing
 $De$, regardless of
 $\mu _p^*$. This suggests that viscoelastic fluids have a higher AED compared with a Newtonian fluid for a fixed total viscosity. The increase in
 $p_{in}^*$ with
 $De$ in figure 4 supports this finding. At lower
 $De$, the effects of
 $\mu _p^*$ (see (5.1a–c)) is predominant, while at higher
 $De$, acoustic energy dissipation is determined by
 $\mu _s^*$ (see (5.3a–c)).
To study the influence of solvent viscosity on AED of low, moderate and high elasticity fluids, the variation of  $E_{ac}^*$ with
 $\mu _s^*$ at different
 $De$ and
 $\mu _p^*$ is presented in figure 6(a). For
 $\mu _p^* = 1$, figure 6(a-i) shows a decrease in
 $E_{ac}^*$ with
 $\mu _s^*$, which is due to the fact that an increase in
 $\mu _s^*$ leads to the growth of
 ${\delta }_{ve}^*$, causing enhanced viscous dissipation and a decrease in
 $p_{in}^*$. Interestingly, for
 $\mu _p^* = 1$,
 $E_{ac}^*$ appears to be independent of
 $De$ at high
 $\mu _s^*$, where variation of
 $\alpha$ with
 $De$ is negligible (see figures 6b-i and 6d-i). The inset in figure 6(a-i) shows
 $E_{ac}^*$ increases with
 $De$ for low
 $\mu _s^*$, accompanied by a small variation in
 $\alpha$ (see figure 6d-i). The variation of
 $E_{ac}^*$ with
 $\mu _s^*$ and
 $De$ for
 $\mu _p^* = 10^3$ is presented in figure 6(a-ii), showing a decrease in
 $E_{ac}^*$ with
 $\mu _s^*$ similar to
 $\mu _p^* = 1$. Notably,
 $E_{ac}^*$ varies significantly with
 $De$ at smaller
 $\mu _s^*$, attributed to the variation of
 $\delta _{ve}^*$ and
 $\lambda _{ve}^*$ (see figure 6b-ii) and the change in
 $\alpha$ from
 $<1$ to
 $2{\rm \pi}$ (see figure 6c). At higher
 $\mu _s^*$, AED follows the same trend as that at lower
 $\mu _s^*$ with increasing
 $De$, but due to a higher viscous dissipation, the freezing state
 $E_{ac}^*$ reduces to a smaller value. In summary, viscoelastic fluids transits from a relaxing to a freezing state in AED for all
 $\mu _s^*$. In the freezing state,
 $E_{ac}^*$ decreases with increasing
 $\mu _s^*$, with the rate of decrease dependent on
 $\mu _p^*$ and
 $De$. Interestingly, increasing
 $\mu _p^*$ (or
 $\mu ^*$) does not always result in a decrease in the pressure amplitude – at higher
 $De$,
 $\mu _p^*$ has negligible effect on pressure field and AED. This contrasts with the study by Vargas et al. (Reference Vargas, Campos-Silva, Méndez, Arcos and Bautista2022) that reported a continuous decrease in pressure wave amplitude with viscosity varying as
 $\mu ^{-3/5}$ in narrow microchannels. The difference likely arises because they considered
 $\delta _{ve}^*$ only as a function of viscosity and neglected higher-order viscous effects by assuming
 $2D/\lambda _0 \ll 1$, which is applicable to narrow channels. In our study,
 $D \sim \lambda _0$ and therefore we consider the effects of both viscosity and elasticity in
 $\delta _{ve}$ and
 $\lambda _{ve}$ (see (2.20) and (2.21)).
(a) Numerical variation of dimensionless AED ( $E_{ac}^*$) and corresponding (b) theoretical variation of
 $\delta _{ve}^*$ and
 $\lambda _{ve}^*$ with
 $\mu _s^*$ at different
 $De$
 $(0, 0.1, 1, 10, 10^3, 10^7)$ for (i)
 $\mu _p^*=1$ and (ii)
 $\mu _p^*=10^3$. (c) Variation of
 $\alpha$ with
 $\mu _p^*$ at different
 $De$. (d) Contour variation of
 $\alpha$ with
 $\mu _s^*$ and
 $De$ for (i)
 $\mu _p^*=1$ and (ii)
 $\mu _p^*=10^3$. We consider
 $\rho ^*=1$ and
 $c^*=1$.

In the following section, we discuss how variations in the acoustic energy transition affect the ARF on a particle in a viscoelastic fluid.
5.3. Effect of acoustic energy transitions on acoustic radiation force
The ARF can induce particle migration in a fluid exposed to ultrasound (Barnkob et al. Reference Barnkob, Augustsson, Laurell and Bruus2010; Bruus Reference Bruus2012b). The effects of boundary layer formation over particles suspended in unbounded fluids of different viscoelastic properties on the ARF are discussed in Doinikov et al. (Reference Doinikov, Fankhauser and Dual2021b). However, most acoustomicrofluidic devices consider microchannels of dimensions of the order of the acoustic wavelength. Here, apart from boundary layer formation over the particles, the boundary layer formation on the channel walls and dissipation in viscoelastic fluid also become significant, influencing ARF and particle migration, which is missing in the literature. We focus on the dynamics of particle migration in microchannels and for  $a \ll \lambda _0$. We consider the influence of viscoelastic fluid properties on ARF, characterized by AED (§ 5.2) and ACF. In contrast to Doinikov et al. (Reference Doinikov, Fankhauser and Dual2021a,Reference Doinikov, Fankhauser and Dualb), we successfully decouple the effects of
 $E_{ac}^{ve}$ and
 $\varPhi$ on ARF theoretically, as described in (2.34) in § 2.3. Our approach considers the ABL formation on both the microchannel walls and the particles, reflected in AED and ACF, respectively. From (2.34), we find that ARF is directly proportional to AED and ACF. Therefore, the ABL formation on the channel walls and the consequent variation in AED with
 $\mu _p^*$,
 $\mu _p^*$ and
 $De$ (given in § 5.2) significantly impacts ARF and particle migration. Further, we observe that increasing the fluid elasticity enhances the AED and consequently the ARF due to boundary layer formation over the channel walls. However, we do not observe any change in the sign of the force as compared with Doinikov et al. (Reference Doinikov, Fankhauser and Dual2021b), even with the influence of the channel boundary layers, likely due to the high driving frequency used in our system (order of MHz).
To further differentiate the effect of viscoelasticity on AED from that on ACF, we analyse the relative variation in ACF for a particle in fluids with and without viscoelasticity, as detailed in supplemental material § 4.1. This variation is expressed as  $\varOmega = \{\varPhi ({\kappa }^*_P, {\rho }^*_P, {\delta }_{ve}^*, {\lambda }_{ve}^*) - \varPhi ({\kappa }^*_P, {\rho }^*_P, 0, 0)\} / \varPhi ({\kappa }^*_P, {\rho }^*_P, 0, 0)$ in percentages. We find that the values of
 $\varOmega$ vary by up to
 $0.3\,\%, 3.75\,\%, 2.6\,\%, 11.8\,\%, 27\,\%$ and
 $39\,\%$ for polystyrene (PS), MESC2.10 cells, melamine resin, polymethacrylate, silica and Pyrex particles, respectively, in viscoelastic fluid with
 $\mu _s^* = 1, \mu _p^* = 10, De = 200, \rho ^* = 1.005$ and
 ${c^* = 1}$. To study the effect of viscoelastic parameters and AED transition on particle migration dynamics inside a microchannel, we focused on PS microparticles for which the ACF in a viscoelastic fluid, compared with that in the base Newtonian fluid, is minimal (only
 $0.3\,\%$), as given in supplemental material § 4.1. Therefore, the dimensionless acoustic radiation force
 $F_{rad}^*$ (
 $F_{rad}^* = F_{rad}^{ve} / F_{rad}^{bf}$) follows the same trend as the variation of
 $E_{ac}^*$ with the viscoelastic properties of the fluid, as detailed in supplemental material § 4.2.
5.4. Effect of viscoelastic properties on particle migration
A particle suspended in a fluid with a positive ACF experiences ARF towards acoustic pressure node (Barnkob et al. Reference Barnkob, Augustsson, Laurell and Bruus2010; Bruus Reference Bruus2012b). Here, through appropriate channel design and actuation, a pressure node is formed at the channel centre, as shown in figure 4(a). We investigate how changes in the AED and acoustic force field, resulting from the viscoelastic parameters  $\mu _p^*, \mu _s^*$ and
 $D e$, affect the particle migration dynamics. For the first time, we conduct experiments to study particle migration dynamics in a viscoelastic fluids within a microchannel exposed to ultrasound and validate the theoretical expressions given by (2.40) and (2.42) in § 2.4. We use PS beads suspended in PEO and PVP-based viscoelastic fluids, offering a positive ACF as obtained from (2.35).
We present the trajectories and velocities of PS particles during their migration, with different initial locations ( $\kern0.7pt y_0^*=y_0/(W/2)$),
 $y_0^*=0.125,0.25$ and 0.50, in PEO
 $0.4\ \mathrm {MDa}$ solutions at two different concentrations,
 $C=2.5\,\%$ and
 $3.5\,\%$, in figure 7. For PEO
 $0.4\ \mathrm {MDa}$ solution with
 $C=2.5\,\%$, the fluid properties are:
 $\mu ^*=75\ (\mu _s^*=1, \mu _p^*=74), De=7.4 \times 10^4, \rho ^*= 1.025, c^*=1.011, \xi \approx 1$. Similarly, the properties for
 $C=3.5\,\%$ are:
 $\mu ^*=203\ (\mu _s^*=1, \mu _p^*=202), De=25.5 \times 10^4, \rho ^*=1.045, c^*=1.015, \xi \approx 1$ (Zimm Reference Zimm1956; Ebagninin, Benchabane & Bekkour Reference Ebagninin, Benchabane and Bekkour2009; Faroughi et al. Reference Faroughi, Fernandes, Miguel Nóbrega and McKinley2020). We normalize the instantaneous locations of the particles with the half-width of the channel,
 $y^*=y /(W / 2)$. We define an acoustic time scale
 $(t_{a c}=D \lambda _0 \mu / a^2 E_{a c} \varPhi )$ based on the solvent (DI water) to non-dimensionalize the migration time as
 $t^*=t / t_{a c}$. The local velocity of the particles is normalized using a reference velocity
 $(V_{r e f}=(W / 2) / t_{a c})$, the dimensionless particle velocity
 $V_P^*=V_P / V_{r e f}$. The particle diameter is
 $15 \ \mathrm {\mu }\mathrm {m}$ and therefore blockage ratio becomes
 $\beta =a /(W / 2)=0.0375$. The transducer is operated at a driving voltage
 $U_{p p}=13.2\ \mathrm {V}$, where
 $U_{p p}^*=U_{p p}/U_{p p}^{min}=1.14$.
(a) Experimental images showing the time history of the transverse position of a particle released from  $y_0^*=0.125$ in a PEO 0.4 MDa solution with
 $C=2.5\,\%$. The particle is marked by a red dashed circle. Comparison of theoretical and experimental variation of (i) dimensionless particle trajectory (transverse location vs time of migration) and (ii) dimensionless particle velocity along
 $y^*$ in PEO 0.4 MDa at two polymer concentrations: (b)
 $C=2.5\,\%$:
 $\mu ^*=75$ (
 $\mu _s^*=1, \mu _p^*=74$),
 $De=7.4 \times 10^4$ and (c)
 $C=3.5\,\%$:
 $\mu ^*=203$ (
 $\mu _s^*=1, \mu _p^*=202$),
 $De=25.5 \times 10^4$. The particle is released from initial locations
 $y_0^*=0.125, 0.25$ and
 $0.5$. The dimensionless central migration time is represented as
 $T^*$.

We initially study the effect of varying ARF across the channel width (S-BAW or  $y$-direction) on particle migration in a viscoelastic fluid. Since the ARF acts only along the
 $y$ direction, particle translation is one-dimensional in the
 $x$–
 $y$ plane, with negligible drift in the
 $x$ direction. The time-lapsed experimental images showing migration of a 15
 $\mathrm {\mu }$m PS particle with
 $y_0^*=0.125$ in PEO 0.4 MDa solution of
 $C=2.5\,\%$ is shown in figure 7(a). The corresponding time evolution of particle position
 $(y^*)$ and particle migration velocity (
 $V_P^*$) are shown in figures 7(b-i) and 7(b-ii), respectively. Under an acoustic field, the particles migrate from their initial positions to a final equilibrium position with a varying velocity, and the final equilibrium position is represented by
 $y^*=1 \pm 0.05$ (the central pressure nodal region is indicated as a band in figure 7a). The value of
 $V_P^*$ shows a non-monotonic variation during its migration, where
 $V_P^*$ is found to be small closer to the channel centre and wall, but becomes maximum closed to
 $y^* \approx 0.5$, shown in figure 7(b-ii). We compare the experimental data with the predictions from the theoretical expressions given by (2.40) and (2.42) in § 2.4, which shows a close agreement, with
 $V_P \propto \sin {(2 k_y y)}$. The maximum velocity seen at
 $y^* \approx 0.5$ is due to the higher acoustic radiation force, which becomes zero at the walls and the channel centre, here,
 $F_{rad} \propto E_{ac}^{ve} \sin {(2 k_y y)}$, as given by (2.40).
To further investigate the effect of initial locations of a particle on acoustic migration characteristics in viscoelastic fluids, we consider particles at  $y_0^*=0.125,0.25$ and
 $0.5$. For PEO fluid with
 $C=2.5\,\%$,
 $\mu ^*=75$ and
 $De=7.4\times 10^4$, the particle trajectories change with the initial location and the migration time to reach the centre of the channel decreases with increase in the
 $y_0^*$, illustrated in figure 7(b-i). It is interesting to observe that the migration velocities across
 $y^*$ are found to follow a fixed curve, irrespective of the values of
 $y_0^*$, illustrated in figure 7(b-ii), agreeing with our theoretical prediction (2.42).
Viscoelastic fluids show a coupled variation of viscous and elastic properties with increasing polymer concentration (Ebagninin et al. Reference Ebagninin, Benchabane and Bekkour2009; Joseph Reference Joseph2013). We study the coupled variation of  $\mu ^*$ (or
 $\mu _p^*$, where
 $\mu _s^*=1$) and
 $De$ on acoustic particle migration in figures 7(b-i,ii) and 7(c-i,ii). At a fixed
 $y_0^*$, a coupled increase in both
 $\mu ^*$ and
 $De$ slows down particle migration due to the combined increase in drag force and decrease in acoustic energy density, shown in figure 7(c-i,ii). The value of
 $V_P^*$ is found to be smaller at a higher
 $\mu ^*$ and
 $De$. However, the effect of initial location remains same as figure 7(b-ii). A quantitative comparison between theoretical predictions and experimental data shows a close agreement in terms of the particle trajectory and velocity variations within
 $10\,\%$.
Now we discuss the individual effects of  $\mu ^*$ and
 $De$ and the corresponding AED transition on acoustic particle migration, theoretically and experimentally, as shown in figure 8. We consider PVP
 $0.36\ \mathrm {MDa}\ (C=0.1\,\%, \mu ^*=1.9, \mu _s^*=1, \mu _p^*=0.9, De=91)$, PEO
 $0.4 \ \mathrm {MDa}$ (
 $C=0.2\,\%, \mu ^*= 1.9, \mu _s^*=1, \mu _p^*=0.9, De=178$) and Newtonian fluid (DI water
 $+0.3\,\%$ Glycerol,
 $\mu ^*= 1.9, {De}=0$) all having a fixed
 $\rho ^*(\rho ^* \approx 1.007)$ and
 $c^*(c^* \approx 1.003)$, keeping
 $\mu ^*$ fixed and only varying
 $De$, as shown in figure 8. Here, we find that an increase in the elasticity or
 $De$ of the fluid enhances the particle migration, shown by a reduced central migration time
 $(T^*=t^*|_{y^* \approx 1})$ and a higher
 $V_P^*$ in figures 8(a) and 8(b), respectively. Therefore, as compared with the Newtonian fluid
 $(De=0)$, particles migrate faster in PEO 0.4MDa fluid with
 $De=178$. This is mainly because of the acoustic energy transition with
 $De$, as discussed in § 5.2. Due to the viscous nature, the Newtonian fluid exhibits higher viscous dissipation and remains in the relaxation mode, giving rise to a low AED in the fluid. However, in high elasticity fluids, the elastic nature helps to reduce the viscous dissipation and store the energy, offering high AED and consequently higher ARF. Here, we observe a strong agreement between our experimental data and the predictions from our theory and simulations, all of which suggest that the AED transition is attributed to the fluid elasticity giving rise to a faster particle migration in viscoelastic fluids than in Newtonian fluid.
Comparison of theoretical and experimental variation of dimensionless (a) trajectory ( $\kern0.7pt y^*$ vs
 $t^*$) and (b) velocity (
 $V_P^*$ vs
 $y^*$) of particle in PEO 0.4 MDa, PVP 0.36 MDa and Newtonian (DI water+0.3
 $\,\%$ glycerol) fluid of constant viscosity
 $\mu ^*=1.9$. The initial location of particle is considered as
 $y_0^*=0.125$. Each data point corresponds to a value averaged over repeated experiments.

Next, we discuss the effect of fluid elasticity and the corresponding AED transition on the particle migration dynamics at different  $\mu _p^*$ and
 $\mu _s^*$, presented in figure 9. We express the theoretical variation of particle migration time in terms of dimensionless central migration time
 $T^*$, which is defined as the ratio of the time taken by a particle to reach the channel centre (nodal plane)
 $(t_c = t|_{y^* \approx 1})$ to the acoustic time scale
 $(t_{a c}), T^*=t_c / t_{a c}$. We illustrate the variation of
 $T^*$ with
 $\mu _p^*$ in figure 9(a) for three different scenarios: (a) low elasticity fluids (
 $De\leq 1$), (b) moderate elasticity fluids (
 $1< De\leq 100$) and (c) high elasticity fluids (
 $De\geq 200$), with
 $\mu _s^*=1, \rho ^*=1$ and
 $c^*=1$.
Theoretical variation of (a) dimensionless particle central migration time  $(T^*)$ with
 $\mu _p^*$ at different
 $De$: (i)
 $De \leq 1$, (ii)
 $1 < De \leq 100$, (iii)
 $De>100$ for
 $\mu _s^*=1$, and (b)
 $T^*$ with
 $\mu _s^*$ at different
 $De$ for (i)
 $\mu _p^*=1$ and (ii)
 $\mu _p^*=10^3$. Here,
 $\beta =0.0375, U_{pp}^*=1.14, \rho _P^*=1.05$ and
 $y_0^*=0.125$. (c) Experimental variation of
 $T^*$ with blockage ratio (
 $\beta$, at
 $U_{pp}^*=1.14$) and dimensionless peak-to-peak voltage (
 $U_{pp}^*$, at
 $\beta =0.0375$) for PEO 1 MDa solution with
 $C=1.05\,\%$ (
 $\mu ^*=45.1$,
 $De=5.7 \times 10^4$), where
 $y_0^*=0.125$. The theoretical variation of
 $T^*$ with
 $\beta$ from (2.40) is shown by a solid line, where
 $T^* \propto \beta ^{-2}$. For
 $T^*$ with
 $U_{pp}^*$, the experimental fit becomes
 $T^* \propto U_{pp}^{*-2}$.

For low elasticity fluids ( $De \leq 1$), viscous effects dominate and fluids are in the relaxation state. Therefore, an increase in
 $\mu _p^*$ amplifies the viscous dissipation, and consequently the AED and ARF decrease, as shown in figure 5(a-i). Moreover, with increase in
 $\mu _p^*$ drag forces increases. The combined effects of these variations gives rise to a significant increase in
 $T^*$ with
 $\mu _p^*$ in figure 9(a-i). However, an increase in
 $De$ leads to an increase in the AED in the fluid, which causes a decrease in the
 $T^*$ as well as the rate of increase in
 $T^*$ with
 $\mu _p^*$. The influence of
 $De$ on
 $T^*$ becomes more pronounced at a higher
 $\mu _p^*$. For moderate elasticity fluids (
 $1 < De \leq 100$),
 $T^*$ increases with
 $\mu _p^*$ at a moderate rate in figure 9(a-ii). Here, the elastic effects start dominating viscous effects, fluid starts to transition from the relaxation mode to the frozen mode, as shown in figures 4(e), 5(a-ii) and 5(b-ii). The increased
 $E_{ac}^*$ in moderate elasticity fluids compared with low elasticity fluids causes a higher ARF, which reduces
 $T^*$ as well as rate of increase in
 $T^*$ with
 $\mu _p^*$ in figure 9(a-ii). A further increase in
 $De$ leads to an increase in AED, causing a further decrease in
 $T^*$ as well as the rate of increase in
 $T^*$ with
 $\mu _p^*$, as illustrated in figure 9(a-ii). For high elasticity fluids (
 $De>100$),
 $T^*$ slowly increases with
 $\mu _p^*$ and is nearly independent of
 $De$, as shown in figure 9(a-iii). Here, elastic effects suppress viscous effects, and fluid attains the frozen state, as shown in figures 4(e), 5(a-iii) and 5(b-iii). Therefore,
 $E_{ac}^*$ and thus the ARF attain their maximum values and becomes independent of
 $De$ and
 $\mu _p^*$. This phenomenon reduces
 $T^*$ and rate of increase in
 $T^*$ with
 $\mu _p^*$ in figure 9(a-iii). In summary, the higher elasticity fluids show shorter central migration time as compared with low elasticity fluids in all range of
 $\mu _p^*$ due to transition of AED from a relaxation mode to a frozen mode.
We depict the variation of  $T^*$ with
 $\mu _s^*$ at different
 $De$ and
 $\mu _p^*$ in figures 9(b-i) and 9(b-ii). For
 $\mu _p^*=1, \ T^*$ consistently increases with
 $\mu _s^*$ and is independent of
 $De$, as shown in figure 9(b-i). This can be attributed to the viscous dissipation and consequent decrease in
 $E_{a c}^*$ with
 $\mu _s^*$ (refer to figure 6a-i). For
 $\mu _p^*=10^3, T^*$ increases with
 $\mu _s^*$ but decreases with
 $De$ for smaller
 $De$ and becomes independent of
 ${De}$ at higher
 ${De} ({De}=10^3 \ \textrm {and} \ 10^7)$, as illustrated in figure 9(b-ii). Here, the fluid response transition from the relaxation mode to the frozen mode, causing a decrease in
 $T^*$ with increasing
 $D e$ for low elasticity and moderate elasticity fluids. However, in high elasticity fluids, the
 $E_{a c}^*$ attains a maximum value and then becomes independent of
 $De$, as similar to figure 6(a). In summary, an augmentation in the solvent viscosity of a viscoelastic fluid decelerates particle migration and concurrently suppresses elastic effects, particularly at lower polymer viscosity range.
In the above analysis, we consider a fixed particle size or blockage ratio  $(\beta =a /(W / 2)=0.0375)$ and dimensionless driving voltage
 $U_{p p}^*(U_{p p}^*=U_{p p} / U_{p p}^{\min }=1.14$), which indicate the acoustic power input. We perform theoretical and experimental investigations on the effects of
 $\beta$ and
 $U_{p p}^*$ on particle migration in a viscoelastic fluid in figure 9(c). Here,
 $\beta$ is varied experimentally by varying the particle size between 5 and
 $25 \ \mathrm {\mu }\mathrm {m}$. The variation of
 $T^*$ with
 $\beta$ and
 $U_{p p}^*$ is depicted in figure 9(c) for PEO 1 MDa solution with
 $C=1.05\,\%$, with
 $\mu ^*=45.1, \mu _p^*=44.1, \mu _s^*=1, De=5.7 \times 10^4, \rho ^*=1.017$ and
 $c^*=1.005$. We find that the central migration time decreases with an increase in the blockage ratio or particle size. This decrease is primarily attributed to the rise in the ARF, evident from (2.42), where
 $T^* \propto \beta ^{-2}$, similar to the Newtonian case (Barnkob et al. Reference Barnkob, Augustsson, Laurell and Bruus2010). We find that particles migrate more rapidly towards the node at higher powers and lower
 $\mu ^*$ owing to the increase in AED and ARF. A power-law fit to the experimental data shows
 $T^* \propto U_{p p}^{*-2}$, agreeing with the Newtonian case (Barnkob et al. Reference Barnkob, Augustsson, Laurell and Bruus2010). The dependency of
 $T^*$ with
 $\beta$ and
 $U_{p p}^*$ is also studied with two other PEO
 $1\ \mathrm {MDa}$ solutions:
 $C=0.74\,\%$ with
 $\mu ^*=21.3, De= 3.7 \times 10^4$; and
 $C=1.05\,\%$ with
 $\mu ^*=45.1, De=5.7 \times 10^4 ; C=1.4\,\%$ with
 $\mu ^*=69.5, De=1.1 \times 10^5$, Here, the rate of change of
 $T^*$ increases/decreases depending upon
 $\mu ^*$ and
 $De$ of the fluid, as presented in supplemental material § 4.3.
In summary, particle migration in viscoelastic fluids within a microchannel is significantly influenced by the fluid properties and acoustic boundary layer formation. From a biological standpoint, fluids such as blood, plasma, mucus, saliva, sputum, synovial fluid, protein solution and hydrogel have relaxation times ranging from  $10^{-5}$ to
 $10^{-2}$ s (Thurston Reference Thurston1972; Rainer & Ribitsch Reference Rainer and Ribitsch1985; Stokes & Davies Reference Stokes and Davies2007; Pan et al. Reference Pan, Filobelo, Pham, Galkin, Uzunova and Vekilov2009; Li et al. Reference Li, Ren, Huang, Yao, Cuento, McCoy, Cameron, Levine and Huang2016; Chaudhuri et al. Reference Chaudhuri, Cooper-White, Janmey, Mooney and Shenoy2020), thus categorized as moderate and high elasticity fluids. Our study shows that changes in fluid elasticity or
 $De$ causes the AED transition from the dissipation state to the storage state. This transition increases the ARF and accelerates particle migration. At a fixed input power, viscoelastic fluid in a microchannel acts as an energy dissipation device at low
 $De$ (low elasticity) and as an energy storage device at higher
 $De$ (high elasticity). Therefore, our study suggests that the Newtonian fluid assumption may not be valid for bio-fluids under all operating conditions. Moreover, by carefully controlling
 $De$, it is possible to manipulate the particle migration dynamics, at a fixed power. The outcome of the present study may be crucial for designing effective microfluidic systems for bio-fluids.
6. Conclusions
We investigated the behaviour of viscoelastic fluids exposed to ultrasound fields in a microchannel. We studied the effects of viscoelastic parameters and the formation of ABLs on the channel walls, on AED and consequently the particle migration dynamics. Our findings show that, with increasing fluid elasticity or Deborah number ( $De$), viscoelastic fluids transition from an energy dissipation state (relaxation mode) to an energy storage state (frozen mode). For low elasticity fluids (
 $De \leq 1$), viscous effects dominate, leading to rapid energy dissipation. For moderate elastic fluids (
 $1 < De \leq 100$), elastic effects start to dominate, and the fluid begins to store acoustic energy. In high elasticity fluids (
 $De>100$), elastic effects become predominant, leading to higher AED that are nearly independent of polymer viscosity and
 $De$. In low elasticity fluids, polymer viscosity significantly reduces the AED, but its effect diminishes with increasing elasticity. Solvent viscosity reduces the AED in all cases but is more dominant in high elasticity fluids. Thus, a viscoelastic fluid-filled microchannel acts as an energy dissipation device at low
 $De$ and as an energy storage device at high
 $De$. By controlling the viscoelastic and acoustic parameters, fluid viscoelasticity can accelerate or decelerate a particle at a constant power input. Our experiments and theoretical analysis revealed that particle migration in viscoelastic fluids is faster than that in Newtonian fluids of comparable viscosity due to the AED transition from the relaxation to the frozen mode. In all elasticity regimes, the central migration time (
 $T^*$) increases with polymer and solvent viscosities but decreases with
 $De$. Higher solvent viscosity decelerates particle migration and suppresses elastic effects, especially at lower polymer viscosities. Considering these findings, and recognizing that bio-fluids typically exhibit moderate to high elasticity, it becomes evident that assuming a Newtonian behaviour for such fluids may not always be valid in acoustofluidics. By adjusting the
 $De$, it will be possible to effectively control particle migration dynamics in microfluidic systems for bio-fluid applications.
Supplementary material
Supplementary material are available at https://doi.org/10.1017/jfm.2024.965.
Acknowledgements
The authors appreciate the support received from CNNP, IIT Madras for the device fabrication.
Funding
A.K.S. expresses gratitude to the Department of Science & Technology (DST), Government of India, for the financial support through the Swarnajayanti Fellowship Award under grant no. DST/SJF/ETA-03/2017-18; and acknowledges the support provided by the Ministry of Education, Government of India, under IoE Phase II project.
Declaration of interests
The authors report no conflict of interest.



