Introduction
The use of personal wireless devices (smart phones, smart watches, smart glasses, etc.) operating at various frequencies has been gaining popularity. These devices have many applications such as navigation, driving assistance, video capture, and accept/reject incoming calls from a paired mobile phone. In addition to this, these devices developed for emerging technologies are expected to work with the Internet of Things (IoT) concept at 5G (fifth generation) frequencies [Reference Lee, Wang, Liao, Lin, Chi, Wong, Shinohara, Yuan and Chen1, Reference Cihangir, Panagamuwa, Whittow, Gianesello and Luxey2]. 5G frequencies in many countries have been determined, and the main band intervals identified are given in Table 1 (unlicensed band ranges are specified in bold, italic) [Reference Pujol, Manero and Jaffal3, Reference Kurka and Salazar4]. The frequencies subject to this study have been chosen so that they fall into these intervals.
The 5G frequency bands for various countries

The smart glasses are expected to replace smartphones with 5G technology in the near future [Reference Daponte, De Vito, Picariello and Riccio5, Reference Ravikumar, Metcalfe, Ravikumar and Prasad6]. Since the 5G technology and IoT will cause more connected devices to be used, the time spent with smart devices tends to increase. Therefore, the usage time of smart glasses is expected to increase as well. Because of this situation, people may get more exposed to electromagnetic radiation compared to pre-IoT era and it may be dangerous to human health if the allowed standard values determined by the International Commission on Non-Ionizing Radiation Protection (ICRNIP) [Reference Guideline7] are exceeded as it may cause undesired heating effects on the tissue [Reference Mertz8]. Hence, it is important to know the specific absorption rate (SAR) distributions for these frequencies. However, the studies considering smart glasses in the literature, summarized in Table 2, have not made any SAR distribution analysis for the future 5G frequencies. There are some studies in the literature analyzing the SAR distributions of smart glasses on the head [Reference Kaburcuk and Elsherbeni9]. However, according to the authors' knowledge, this is the first study to examine SAR distributions in the frequencies of 2.45/3.6/3.8/4.56/6 GHz for smart glasses applications. In addition, while compact antenna structures of feasible sizes applicable on glasses are generally obtained by using coupling element structure in the literature, it has been obtained by using folded dipole and defected ground structure in this study.
Comparison between smart glasses studies in the literature and the proposed work

CE, coupling element.
a −6 dB Bandwith.
b −10 dB Bandwith.
In this study, the SAR distribution of the proposed tri-band antennas radiating at Wi-Fi and 5G frequencies integrated into the eyewear device has been investigated using two different human head models. The rest of the paper is organized as follows. In ‘The feasibility study’ section, first the prototype of 3D glasses considered as the frame of the smart glasses model is designed in CST Microwave Studio program and then fabricated. After that, the SAR distributions in the human head due to the proposed antennas integrated in the frame of the 3D glasses have been examined for the cases where the antenna is embedded in the frame and is used alone. Both cases have been analyzed by using the homogeneous specific anthropomorphic mannequin (SAM) and the heterogeneous visible human (VH) head phantoms. SAR values are evaluated based on international standards [Reference Guideline7, Reference IEEE17]. In ‘Fabricated prototypes’ section, the fabrication of tri-band antenna prototypes and the production of 3D glasses are performed and these antennas have been evaluated in terms of reflection coefficients for their use in free space, in the glasses alone, and on the user's head with the glasses. Finally, in ‘Conclusion’ section, the effect of the proposed tri-band antennas on the SAR distribution and their maximum values on the head has been evaluated.
The feasibility study
In this section, design parameters and dimensions of the antennas, CST simulation results, and SAR distributions on the SAM phantom and VH phantoms are provided.
Design and analysis of antennas for eyewear devices model
In order to investigate the feasibility for different utilizations, many antennas operating at Wi-Fi and 5G frequencies are simulated and manufactured in [Reference Zhu, Antoniades and Eleftheriades18–Reference Fang, Wen, Inserra, Huang and Li21]. However, printed dipole antenna is preferred for small-sized antennas due to its many advantages (easy to fabricate, simple, good gain, low profile, etc.) [Reference Abu, Rahim, Suaidi, Ibrahim and Nor20]. In this study, two printed dipole antennas are designed for 5G data communication. It is a challenging issue to combine all 5G frequencies in one antenna. Hence, in this study, we have provided two different antennas in order to be able to analyze wider range of frequencies and their SAR distributions on the head. In order to reduce the size of the antenna, the printed dipole antenna is meandered. The meanders are employed to implement a quarter of the wavelength of a dipole antenna; obvious size reduction for a dipole antenna can thus be achieved. The idea here is to reduce the size of the antenna by folding the conductors back and forth. However, while the antenna size decreases, radiation resistance, efficiency, and bandwidth decrease as well. These changes in antenna parameters also vary depending on the length, width, and number of the meanders [Reference Bedir Yousif and Abdelrazzak22]. With the help of empirical findings, antenna parameters are checked and the most suitable antenna design is proposed for the study. In the design of prototype-1 antenna for 2.45 GHz, a dipole antenna with 12.24 cm wavelength is utilized on the patch layer. The length of antenna is reduced by folding the dipole antenna from two separate points. In order to obtain a tri-band property, the effect of the ground layer is utilized. A circular space is constructed over the ground layer to shorten the electrical length. Two additional resonance frequencies in the projected 5G frequencies are obtained by carefully adjusting the radius of the circle. The designed antenna (Fig. 1(a)) has a tri-band property in which one of the frequencies is 2.45 GHz. In prototype-2, the number of foldings is increased together with the adjustments on the electrical length of the ground layer to obtain a tri-band property (Fig. 1(b)). Since microstrip feeding is used in both prototypes, both designs are performed by using the impedance matching of the main dipole antenna prior to the folding stage. Two different meander dipole antennas, shown in Fig. 1, are designed and printed on FR-4 substrate (ɛ = 4.3, tan δ = 0.025, and height 1.3 mm) with the dimensions of 36 × 88 × 1.3 mm3 and 41.5 × 40.8 × 1.3 mm3 for prototype-1 and prototype-2, respectively.
The meander dipole antennas: (a) view of prototype-1 (left: top view, right: bottom view), (b) view of prototype-2 (left: top view, right: bottom view).

The simulation and measurement results of the reflection coefficients (S 11) of the proposed antennas are shown in Fig. 2. The dashed and solid lines show the S 11 of prototype-1 and prototype-2, respectively. It can be seen from Fig. 2 that prototype-1 provides BW ~ 50 MHz at f 1 = 2.45 GHz, BW ~ 140 MHz at f 2 = 3.8 GHz, BW ~ 400 MHz at f 3 = 6 GHz, and prototype-2 provides BW ~ 100 MHz at f 1 = 2.45 GHz, BW ~ 50 MHz at f 2 = 3.6 GHz, BW ~ 40 MHz at f 3 = 4.56 GHz.
S 11 parameter of the simulated antennas for prototype-1 and prototype-2.

Design and analysis of 3D smart glass model with antennas
In this study, polylactic acid (PLA) material which has high dielectric constant (ɛ r = 8.1) is preferred for the design of a 3D smart glass model shown in Fig. 3 in order to reduce the effects of the electromagnetic radiation from the antenna on the human head [Reference Hong and Choi23–Reference Kaburcuk and Elsherbeni25]. The electromagnetic properties and color of the PLA material are frequency dependent [Reference Hadjem, Lautru, Dale, Wong, Hanna and Wiart26]. In order to place the antenna into the 3D smart glasses model, the right leg of the smart glasses has a cavity whose dimension is 85 × 25 × 2 mm3. The inner wall thickness of the 3D glasses, close to the user, is designed as 5 mm. During the use of the 3D glasses, a 2 mm-thick exterior wall is designed to protect the antenna against impacts. All dimensions of the smart glasses model are given in Fig. 3.
Illustration of the simulated 3D glasses.

Homogeneous SAM and heterogeneous VH head phantoms provided in CST Microwave Studio Suite are used as the human head models in this study.
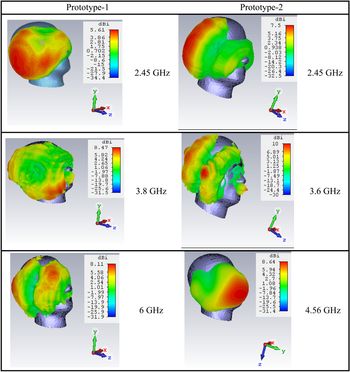
The 3D radiation patterns on the SAM head phantom obtained by placing all prototypes with glasses are shown in Fig. 4. All antennas are in the tendency to radiate in a direction perpendicular to the user's head as it is usually the case in smartphones.
3D radiation patterns on the SAM head phantom obtained by placing all prototypes with glasses.

SAR simulations
In the recent IEEE standard [Reference IEEE17], the peak spatial-average SAR has been changed from 1 to 10 g of tissue in the shape of a cube [Reference Kaburcuk27]. Hence the evaluations are provided based on SAR10 g. The limits of SAR over any 10 g of tissue are determined by international standards [Reference Guideline7, Reference IEEE17]. According to these standards, the average of SAR must be 2 W/kg over any 10 g of tissue (SAR10 g). The input power of the mobile devices can be adjusted to the appropriate level for the limiting of SAR. There are many studies [Reference Hong and Choi23, Reference Hwang and Chen24, Reference Hadjem, Lautru, Dale, Wong, Hanna and Wiart26] to obtain SAR distribution on the homogeneous SAM and heterogeneous VH head phantoms due to mobile devices. It is well known that the SAR values depend on the frequency of interest due to the fact that the electromagnetic properties of the tissues depend on the frequency, antenna types, and distance between the human head and antenna. In this study, SAR values on the human head with and without 3D smart glasses model are calculated when the input power of the antenna is set to 0.125 W [Reference Siegbahn, Bit-Babik, Keshvari, Christ, Derat, Monebhurrun, Penney, Vogel and Wittig28]. The SAM head and VH phantoms are provided in the library of CST Microwave Studio Suite. The SAM phantom and VH phantom wearing the smart glasses model with the embedded antenna in the CST simulation environment are shown in Fig. 5.
The (a) SAM phantom and (b) VH phantom wearing the smart glasses model with the embedded antenna in the CST simulation environment.

SAM phantom
The maximum SAR10 g values due to prototype-1 and prototype-2 are obtained for the SAM head phantom with and without the smart glasses and are given in Table 3. It is seen that the SAR values on the head decrease with increasing frequency. It is observed that wearing glasses causes lower SAR values. The efficiencies of the antennas also have a direct effect on the SAR values. The SAR values that exceed 2 W/kg are shown with bold and italic characters in the table. These SAR values can be reduced by decreasing the incident power.
Simulated SAR values using SAM phantom (W/kg)

The SAR10 g distributions on the horizontal cross-section of the SAM phantom are given in Fig. 6. It can be realized that the maximum SAR10 g values are decreasing when the antenna is embedded into the 3D glasses and also the SAR distributions are affected by the presence of the 3D glasses.
SAR10 g distributions on the horizontal cross-section of the SAM phantom.

VH phantom
The maximum SAR10 g values for prototype-1 and prototype-2 are obtained for the VH phantom with and without the smart glasses model and are given in Table 4. It is realized that the maximum SAR10 g values obtained for the VH phantom are lower than those obtained for the SAM phantom. The reason for these differences in SAR values would be due to the fact that SAM and VH phantom model the head in different ways. SAM phantom uses an average electrical property of a single tissue, whereas VH phantom has a layered tissue structure [Reference Kuster, Christ, Chavannes, Nikoloski and Frohlich29].
Simulated SAR values using VH phantom (W/KG)

Fabricated prototypes
In order to show the effect of the integrated antenna into the pair of eyewear devices operating at Wi-Fi and 5G frequencies on the human head, the prototypes of the 3D glasses and the embedded antennas were fabricated. The fabricated antennas are shown in Fig. 7.
The fabricated antenna of (a) prototype-1 (left: top view, right: bottom view), (b) prototype-2 (left: top view, right: bottom view).

The antennas are measured by using Agilent Technologies Network Analyzer N9928A in the frequency range of 300 kHz–26 GHz. The simulation and measurement reflection coefficients, shown in Fig. 8, for prototype-1 and prototype-2, are obtained in free space, the antenna without glasses placed next to the subject's head, and the antenna embedded in the glasses and worn by the subject. It can be realized that the reflection coefficients of the antennas are affected by the presence of the 3D glasses.
Simulation and measurement results for prototype-1 and prototype-2 antennas.

Different results between free space antenna measurements and simulations were observed both for prototype-1 and prototype-2, in terms of resonance frequency and reflection coefficients. It is believed that the difference between measurements and simulations may be due to the fact that there can be a difference between the assumed and real relative permittivity value of the substrate material.
For prototype-1 and prototype-2, when the antenna is not integrated into the 3D glasses model and placed alone next to the user's head without glasses, a shift is observed in the resonance frequencies and a few dB performance reductions are observed in the reflection coefficients, due to impedance mismatch caused by the tissues. However, when the antenna is integrated into the 3D glasses model and placed on the user's head with glasses, no change is observed in the resonance frequencies. In addition, for prototype-1, a new resonance frequency is formed (3.2 GHz). In the simulation, the SAM phantom is used as a human head model whereas a real human head is used in the measurement. The difference in resonance frequencies obtained in simulation and measurement is believed due to the fact that SAM phantom is used in the simulation and the real human head is used in the measurement.
Conclusion
In this study, SAR distributions of the projected 5G frequencies below 6 GHz and at Wi-Fi frequency (2.45 GHz) on a human head are analyzed, for eyewear device applications due to designed tri-band antennas. Two meandered dipole antennas operating at Wi-Fi and some 5G frequencies below 6 GHz are designed, simulated, and fabricated for smart glasses model. The 3D glasses model was fabricated using PLA material to investigate the possible effects of integrated antennas on the user's head.
The proposed antennas are placed into the right side of the 3D glasses. The maximum SAR10 g values in the VH and SAM phantom models are calculated based on two different antennas integrated into the eyewear devices. Thanks to the PLA material used in the fabrication of the 3D glasses, the amount of the electromagnetic radiation from the embedded antenna was reduced, and it was possible to obtain good SAR results. When the antennas are placed on the user's head without glasses, changes in resonance frequencies are observed due to the electrical properties of the tissues and even new frequencies are formed. However, when the antennas are placed on the user's head with the help of glasses, minimum changes are observed depending on the environmental factors in the antenna parameters (resonance frequency, reflection coefficient).
SAR distribution was not observed on other parts of the head away from the antenna as no current was induced on the frame used in this study due to its high dielectric value, while current distribution in different parts of the head has been observed in the studies carried out with metal glasses. However, secondary hotspots have been observed since the proposed antennas operate at three different frequencies, thus causes current distribution in three different locations along the antenna.
This study helps to analyze the SAR distributions of several frequencies of 5G and the effects of the frame of glasses in terms of SAR distribution since the frames take the role of a protective shield for the head. It is realized that the 3D glasses have helped reduce the maximum SAR values compared to the case where the glasses are not used. As expected, the values of 10 g SAR values are higher in the tissues which are closer to the antenna in the head model. When the SAR values are normalized to the incident power 0.125 W, the 10 g SAR value calculated was below the allowed standard value. It can also be stated that, it is necessary to control the incident power because it is probable to go over the allowed standard SAR values as we have seen from the simulations.
 Miraç Dilruba Geyikoğlu received the B.S. degree in electrical and electronics engineering from Ataturk University, Erzurum, Turkey, in 2013, the M.S. degree from the Ataturk University, Erzurum, Turkey, in 2015. She is still a Ph.D. student from Ataturk University, Erzurum, Turkey. Her research interest includes the areas of antenna theory, bio-electromagnetics, and hyperthermia.
 Hilal Koç Polat received the B.S. degree in electrical and electronics engineering from Ataturk University, Erzurum, Turkey, in 2013, the M.S. degree from the Ataturk University, Erzurum, Turkey, in 2015. She is still a Ph.D. student from Ataturk University, Erzurum, Turkey. She has been serving as a research assistant at the Department of Electrical and Electronics Engineering at Erzurum Technical University Erzurum, Turkey, since 2014. Her research interest includes the areas of signal processing, antenna theory, and wireless communication.
 Fatih Kaburcuk received both the M.Sc. and Ph.D. degrees in electrical engineering from Syracuse University, Syracuse, New York, USA, in 2011 and 2014, respectively. He was a visiting research scholar in the Electrical Engineering Department at Colorado School of Mines in 2014. He was with the Erzurum Technical University in Turkey from 2015 to 2019. He joined the Electrical and Electronics Engineering Department at Sivas Cumhuriyet University in June 2019 as the Assistant Professor. His research interest includes numerical methods in electromagnetics, bioelectromagnetic, and microwave systems.
 Bülent Çavuşoğlu received the B.S. degree in electrical and communication engineering from Yildiz Technical University, İstanbul, Turkey, in 1994, the M.S. degree from the Illinois Institute of Technology, Chicago, IL, USA in 1997, and the Ph.D. degree from the University of Illinois at Chicago, Chicago, in 2005, both in electrical and computer engineering. His research interest includes the areas of image/video processing, multimedia compression, multimedia communication networks, nanomolecular communication and sensors for chemical/biological molecules, and antenna theory.