

The radiocarbon record for the end of the Pleistocene and early Holocene epochs in eastern North America is sparse, imprecise, and often contradictory (Miller and Gingerich Reference Miller and Gingerich2013). Only a few sites offer a detailed radiocarbon record, and, among those, Dust Cave in northern Alabama is perhaps the best (Driskell Reference Driskell1994, Reference Driskell, Anderson and Sassaman1996; Sherwood et al. Reference Sherwood, Driskell, Randall and Meeks2004), covering about 7,000 years of generally continuous occupation from the Late Paleoindian (ca. 12,600 cal. B.P.) through Middle Archaic (ca. 6000 cal. B.P.) periods. Driskell (Reference Driskell1994), Sherwood (Reference Sherwood2001), and Sherwood et al. (Reference Sherwood, Driskell, Randall and Meeks2004) discussed Dust Cave's radiocarbon record extensively, but the 14C ages imprecisely separate some of the sequential cultural levels, especially strata attributed to the Late Paleoindian through Early Archaic periods. For example, despite the presence of eight dates from the lowest Paleoindian Beaver Lake/Quad stratum and nine dates from the overlying Dalton stratum, the analytical techniques used by the authors could not segregate these cultural units. I use Bayesian statistical modeling tools in the OxCal v4.2 program (Bronk Ramsey Reference Bronk Ramsey2009a) to increase the precision of the Dust Cave radiocarbon record and to reconstruct clear chronological separations of the site's cultural components (Sherwood et al. Reference Sherwood, Driskell, Randall and Meeks2004). The Dalton stratum is now separate from the underlying Beaver Lake/Quad and overlying Early Side Notch strata, clarifying the chronology of all three cultural units and refining the chronology of Dalton in the Southeast (Goodyear Reference Goodyear1982).
The stratigraphic complexities of caves and rockshelters are well known (e.g., Douka et al. Reference Douka, Grimaldi, Boschian, del Lucchese and Higham2012; Higham et al. Reference Higham, Jacobi, Basell, Bronk Ramsey, Chiotti and Nespoulet2011), and Dust Cave is no exception (Sherwood Reference Sherwood2001). Despite the obstacles, the excavators present a thoughtful and reasonable reconstruction of the cave's occupational history, attributing one or more sequential strata to different diagnostic projectile point types in the region (Sherwood et al. Reference Sherwood, Driskell, Randall and Meeks2004; Driskell 1996). The major cultural components, as defined by the majority of point types in a stratum or set of strata, extend from the Late Paleoindian (Quad, Beaver Lake, Dalton) through Middle Archaic (Benton) periods. The only missing major cultural component in the sequence is the Early Archaic Kirk Corner Notched, which is ubiquitous in the surrounding region (Sherwood et al. Reference Sherwood, Driskell, Randall and Meeks2004:548).
The Dust Cave Radiocarbon Dates
Dust Cave was excavated from 1989 through 2002 by the University of Alabama (Goldman-Finn and Driskell Reference Goldman-Finn and Driskell1995; Sherwood et al. Reference Sherwood, Driskell, Randall and Meeks2004). The karstic cave, untouched at the time by collectors, is adjacent to the Tennessee River near Muscle Shoals, Alabama. The complex stratigraphy was created by depositional episodes, including anthropogenic dumping, slope wash from the talus slope, plant growth during abandonment periods, influx of eolian sediments, periodic flooding from the Tennessee River and adjacent Cypress Creek, erosional episodes from the river, phreatic flow through the bottom of the cave, and human excavation, both for burials and apparently to create headspace during the later occupations. The cave contains burials, fired clay surfaces, numerous burning episodes—some anthropogenic and some natural (Sherwood Reference Sherwood2001; Sherwood et al. Reference Sherwood, Driskell, Randall and Meeks2004; Sherwood and Chapman Reference Sherwood and Chapman2005)—and various features (Homsey Reference Homsey2010).
Although I focus on its radiocarbon record, Dust Cave produced valuable faunal and botanical data, as well as information on subsistence (Hollenbach Reference Hollenbach2009; Hollenbach and Walker Reference Hollenbach, Walker, Van Derwarker and Peres2010; Homsey et al. Reference Homsey, Walker and Hollenbach2010; Walker Reference Walker2000, Reference Walker2010), sediment micromorphology (Homsey and Capo Reference Homsey and Capo2006; Sherwood Reference Sherwood2001), and synthetic studies (Driskell Reference Driskell, Anderson and Sassaman1996; Walker 2010). Dust Cave is central to discussions of the Paleoindian through Middle Archaic periods in the mid-South and greater Southeast. No other stratified site in the Southeast has generated as much fundamental scholarship, making an accurate chronology for the 7,000 years of occupation of the cave necessary.
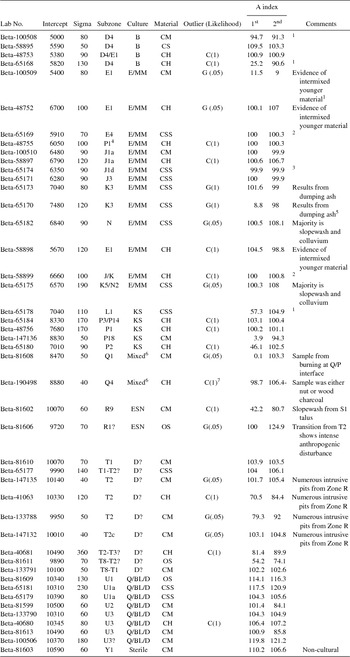
Sherwood et al. (Reference Sherwood, Driskell, Randall and Meeks2004:Table 1) report 44 14C dates from 13 strata, referred to as zones, which were further defined with secondary or tertiary subzones (Sherwood et al. Reference Sherwood, Driskell, Randall and Meeks2004:536). Eight cultural components were associated with the zones through dominance of diagnostic projectile points by depth below datum, although there was “no perfect correlation between depth and zone” (Sherwood et al. Reference Sherwood, Driskell, Randall and Meeks2004:540). Lara Homsey-Messer (Homsey Reference Homsey2004) collected an additional date, which is included in this analysis. Table 1 lists the 14C dates by zone and associated cultural component. Two dated zones (Y and Q) had no cultural association.
Data Used in Analysis.

Notes: Lab no., intercept, sigma, zone, cultural affiliation data from Sherwood et al. (Reference Sherwood, Driskell, Randall and Meeks2004:Table 1); Q = Quad, BL = Beaver Lake, D = Dalton, ESN = Early Side Notched, KS = Kirk Stemmed, E/MM = Eva/Morrow Mountain, B = Benton; CH = charcoal, CM = charred material, CS = carbon sediment, CSS = charcoal stained silt, OS = organic sediment, NC/CH = nut charcoal or wood charcoal; C, 1 = charcoal outlier protocol with likelihood 1.0; G, 1 = general outlier protocol with likelihood 1.0; G, .05 = general outlier protocol with likelihood .05.
1 = surface hearth
2 = charcoal pit
3 = scrape out
4 = intrusive pit
5 = burial
6 = no cultural affiliation
7 = sample modeled twice as no outlier and charcoal outlier
The Paleoindian levels, zones U and T, are of particular interest, because reliable dates from this period are rare east of the Mississippi River (Miller and Gingerich Reference Miller and Gingerich2013). These zones are associated with several Paleoindian point types: Cumberland, Quad, Beaver Lake, Dalton, and Hardaway side-notched (Driskell Reference Driskell, Anderson and Sassaman1996). The diagnostic points were few in number, but “based on depth, the Quad and Beaver Lake types appear earlier in the sequence relative to other diagnostic Paleoindian hafted bifaces” (Sherwood et al. Reference Sherwood, Driskell, Randall and Meeks2004:544). These two zones produced 17 14C dates, but the authors were unable to differentiate them due to overlapping calibrated ages. At the later end of the sequence, the Kirk Stemmed, Eva/Morrow Mountain, and Benton components were likewise difficult to distinguish.
Problems with differentiating the ages of cultural components stemmed from the use of summed probabilities to summarize 14C dates (Sherwood et al. Reference Sherwood, Driskell, Randall and Meeks2004:Figure 4), which produced overlapping probability densities and prevented clarification of the dates constraining the components and zones. Although standard practice at the time for characterizing a set of related dates, summed probabilities tend to make a set of 14C dates more imprecise, because the technique treats the dates as independent events (Bayliss et al. Reference Bayliss, Ramsey, van der Plicht and Whittle2007) when they should be treated as related, either by cultural component or stratum. Summed probabilities overestimate the duration of events, which makes it appear that sequential events cannot be discriminated (Bayliss et al. Reference Bayliss, Ramsey, van der Plicht and Whittle2007).
Precision and Accuracy
We strive for two things in radiocarbon analyses: accuracy, meaning that the age accurately dates the archaeological event of interest, and precision, meaning the age is precise enough to be helpful in understanding the context of the age of the event. Of the two, accuracy is most important, because, whereas an accurate but imprecise age is of some use, a precise but inaccurate date is of no use. Accuracy is usually addressed by ensuring that the samples are properly pretreated and analyzed and associated with the event, a process that is sometimes referred to as radiocarbon hygiene (Pettitt et al. Reference Pettitt, Davies, Gamble and Richards2003). Here the “archaeological event” is inferred from the frequency of diagnostic points in geological strata, which creates a likely, but unknowable, level of inaccuracy in the ages of the inferred cultural phases, because the depositional processes in the cave that produced the strata were not necessarily coincident with the phases. Because cultural components are the focus, the displacement of samples between strata assigned to different components is more of a concern than displacement within or between strata assigned to the same component. Here, accuracy was evaluated by reviewing the excavation publications (Driskell Reference Driskell1994, Reference Driskell, Anderson and Sassaman1996; Sherwood et al. Reference Sherwood, Driskell, Randall and Meeks2004) and geomorphological analyses (Homsey Reference Homsey2004; Sherwood Reference Sherwood2001).
Precision has been tackled in a number of ways, most of which are of dubious utility and tend to decrease accuracy at the expense of increasing precision (Bayliss et al. Reference Bayliss, Ramsey, van der Plicht and Whittle2007). Techniques include eliminating ages with large errors (e.g., Faught Reference Faught2008), averaging ages without regard to whether they meet the criteria for averaging (Ward and Wilson Reference Ward and Wilson1978), eyeballing a set of calibrated ages, or using the mean or median calibrated age. Whereas all these techniques can increase precision, none are methodologically justified or necessary.
Bayesian analysis provides an alternative objective and justifiable way to increase precision. First, it makes no sense to discard otherwise accurate 14C dates because the errors are large; we know the date of the event is somewhere in that range; we just need to find it. Second, averaging is usually justified only in limited situations, such as when replicate dates are taken on the same sample (Ward and Wilson Reference Ward and Wilson1978). Although commonly done (e.g., Faught Reference Faught2008), it is generally inappropriate to average material from the same hearth, different animals, same stratum, or same site, even if they are chi-square contemporaneous (Ward and Wilson Reference Ward and Wilson1978). Being chi-square contemporaneous means only that dates can be averaged, not that they should be. Third, the greatest precision is achieved by using the mean or median calibrated age, but this also produces the lowest accuracy, because the chances of the mean or median being the actual date of the event are near zero (Telford et al. Reference Telford, Heegaard and Birks2004). Finally, eyeballing a set of 14C or calibrated dates is a subjective exercise that is probably appropriate only when evaluating dates that are unrelated by deposition or cultural or geological connection. The Bayesian analysis used here increases precision by reducing the statistical scatter inherent in the 14C age errors (Bayliss et al. Reference Bayliss, Ramsey, van der Plicht and Whittle2007; Bronk Ramsey Reference Bronk Ramsey2000; Steier and Rom Reference Steier and Rom2000).
Bayesian Analysis of 14C Ages
Models (explicit or implicit) are always used to evaluate a set of 14C ages, regardless of whether individual 14C ages are evaluated as a set of independent data points, ages from the same site are averaged, or the individual ages or averages are considered as a group of related ages. OxCal employs two basic models to analyze a collection of 14C ages: phases and sequences (Bronk Ramsey Reference Bronk Ramsey2009a). The phase model is used when a set of unordered events are related (e.g., same stratum, site, or culture). The sequence model postulates that archaeological events are ordered, such as in a stratigraphic column or a sequence of cultural phases.
Ideally, a sequence model would be created from radiocarbon samples that directly relate to archaeological events, such as hearth use, tool manufacture, or food consumption (e.g., Higham et al. Reference Higham, Douka, Wood, Ramsey, Brock, Basell, Camps, Arrizabalaga, Baena, Barroso-Ruíz, Bergman, Boitard, Boscato, Caparrós, Conard, Draily, Froment, Galván, Gambassini, Garcia-Moreno, Grimaldi, Haesaerts, Holt, Iriarte-Chiapusso, Jelinek, Jordá Pardo, Maíllo-Fernández, Marom, Maroto, Menéndez, Metz, Morin, Moroni, Negrino, Panagopoulou, Peresani, Pirson, de la Rasilla, Riel-Salvatore, Ronchitelli, Santamaria, Semal, Slimak, Soler, Soler, Villaluenga, Pinhasi and Jacobi2014). However, the samples from Dust Cave are by necessity related to strata in which evidence of human activity is preserved, because little information was available on the association of specific samples to specific events. Such an approach is often used in caves and rockshelters where stratigraphy is complex or samples associated with archaeological events are rare (e.g., Douka et al. Reference Douka, Jacobs, Lane, Grün, Farr, Hunt, Inglis, Reynolds, Albert, Aubert, Cullen, Hill, Kinsley, Roberts, Tomlinson, Wulf and Barker2014). In Dust Cave, correlating samples from different units by the depth below datum was complicated due to the sloping stratigraphy and intersecting pits (Sherwood et al. Reference Sherwood, Driskell, Randall and Meeks2004:540). The slope also affected the calculation of frequency distributions of diagnostic artifacts by depth (Sherwood et al. Reference Sherwood, Driskell, Randall and Meeks2004:Figure 5). Based on these complicating factors, I decided a simpler model using samples correlated by primary zones was preferred. Thus, the model created here for Dust Cave is a sequence of depositional units (zones) that are inferred to relate to phases of cultural activity.
Bayesian methods calculate the probability of an occurrence of an event (the posterior) based on prior information (the priors) about that event (Bronk Ramsey Reference Bronk Ramsey2009a; Buck et al. Reference Buck, Cavanagh and Litton1996). In other words, the priors are used to create a model of how we expect the 14C dates to be distributed. If the data fit the model, the program will converge on the most likely result, which is represented as a posterior probability density (Bronk Ramsey Reference Bronk Ramsey2009a; Buck et al. Reference Buck, Litton and Smith1992). The likelihood is estimated in a Markov Chain Monte Carlo simulation that can run for millions of iterations of potential solutions before converging on the most likely (Higham et al. Reference Higham, Jacobi, Basell, Bronk Ramsey, Chiotti and Nespoulet2011).
The main explicit priors used in this analysis are that (1) the eight components (two non-cultural and six cultural) are sequential and ordered by the law of superposition, (2) hiatuses of unknown length occurred between phases that are separated by abrupt transitions in deposition, and (3) some 14C samples may be out of place. I also assume that all samples were properly pretreated and analyzed in the laboratory.
OxCal 4.2 provides two indices that measure the goodness of fit of data to the model and allow one to evaluate a model's quality. The first is the individual Agreement Index (Ai ), which compares the degree of overlap in the unmodeled (i.e., a single calibration) and modeled probability densities for each 14C age. An Ai of about 60 or more indicates that the particular age is not an outlier in the context of the model, i.e., it is equivalent to meeting the α ≤ .05 level of significance in traditional statistics (Bronk Ramsey Reference Bronk Ramsey2009a). The second agreement index is the Amodel index, which is a measure of the overall quality of the model, i.e., how well the data fit the model expectations. This index is computed by comparing the unmodeled and modeled probability densities of all of the 14C ages used in the model. If Amodel drops below about 60, the model may be suspect and/or too many of the individual ages may be outliers. (Both agreement indices can exceed 100.) The indices are not formal statistical measures but give an approximate indication of model quality (Bronk Ramsey Reference Bronk Ramsey2009a:356--357).
Analysis of Dates
The 45 Dust Cave 14C ages were initially run as a simple model (see Supplemental Text) of eight non-overlapping sequential phases as presented in Sherwood et al. (Reference Sherwood, Driskell, Randall and Meeks2004), using IntCal13 for the calibration (Reimer et al. Reference Reimer, Bard, Bayliss, Beck, Blackwell, Bronk Ramsey, Buck, Cheng, Edwards, Friedrich, Guilderson, Haflidason, Hajdas, Hatté, Heaton, Hoffmann, Hogg, Hughen, Kaiser, Kromer, Manning, Niu, Reimer, Richards, Scott, Southon, Staff, Turney and van der Plicht2013). This model was used to check the prior assumption that the dates were properly associated with their assigned cultural phase (Higham et al. Reference Higham, Jacobi, Basell, Bronk Ramsey, Chiotti and Nespoulet2011). Although Sherwood et al. (Reference Sherwood, Driskell, Randall and Meeks2004) and Homsey (Reference Homsey2004) assigned each sample to a subzone (Table 1), I treated the samples as belonging to a cultural phase that was made up of one or more primary zones. The dates within each cultural component were related but nonsequential, meaning that they were not considered ordered within a phase or a zone.
The simple model produced an Amodel index of 3, which represents an abject failure of the model (Table 1; OxCal code in Supplemental Text). Nine of the 45 14C ages were below an Ai of 60. The low Amodel index can result from either or both an inappropriate model or 14C ages that are not properly associated with the strata or cultural components. “Not properly associated” can mean that the sample was translocated from its original location or had an inherent age when it was deposited (or both). Because 36 of the 14C ages met the model expectations with Ai indices above 60, it is more likely that some individual ages are not properly associated (i.e., outliers) rather than that the model of sequential phases is wrong. A more sophisticated model was required to address outliers.
Often, in non-Bayesian analyses of 14C ages, outliers are identified because they do not meet the chi-square test for contemporaneity or otherwise do not meet expectations. In the broadest sense, an outlier simply does not accurately date the event of interest, either because the sample has an inherent age, meaning that it was already old at the time it became associated with the event of interest, it was displaced from its initial location, or, by chance, it is outside the expected range of variation. We would expect about 1 in 20 14C dates to fall outside α = .05 confidence levels simply by chance and occasionally to be three or more standard deviations from the norm (Bronk Ramsey Reference Bronk Ramsey2009b). Here, I focus on the first two causes.
Outliers can be handled in one of two ways: elimination or down-weighting (Dee and Bronk Ramsey Reference Dee and Ramsey2014; Bronk Ramsey Reference Bronk Ramsey2009b). It is a common practice to simply discard outliers. This is often a subjective exercise, and, if we assume that the sample was properly analyzed, it may be possible to salvage an otherwise accurate date by examining its context. Such an age is not necessarily “wrong,” although it can cause consternation in a visual assessment of a set of ages. Further, simply eliminating an age from a Bayesian model will change the distribution of the remaining ages and may turn previously appropriate ages into outliers. Salvaging dates in this analysis is a primary goal, because the dataset includes only 45 ages. OxCal down-weights samples identified as possible outliers in a model averaging approach that depends on how likely they are to be outliers and how they fit the model (Bronk Ramsey Reference Bronk Ramsey2009b:1024).
The first task in evaluating outliers is to identify the specific sample material for each date. All samples from Dust Cave are generically identified in the Sherwood et al. (Reference Sherwood, Driskell, Randall and Meeks2004:Table 1) as “charred material,” which is not specific enough to determine how they should be treated in the model. Homsey-Messer used the same generic attribution. Bayliss (Reference Bayliss2015) describes the problems that can arise when samples are not specifically described and recommends that poorly understood samples should be avoided. Fortunately, Kandace Hollenbach of the University of Tennessee, Department of Anthropology Archaeological Research Laboratory, who did much of the paleobotanical work at the site (Hollenbach Reference Hollenbach2005), and Lara Homsey-Messer (personal communication 2016) were able to track down many of the original sample types, which are listed in the sixth column of Table 1. The second task is to assign a likelihood that a sample meets the outlier criteria. Here, “certainty” warranted a likelihood of 1 (100 percent) and “possibility” a likelihood of .05 (5 percent).
Samples with an unknowable inherent age include charcoal, which can survive for eons before being deposited in association with the event of interest, wood from inner tree rings, and shell (Dee and Bronk Ramsey Reference Dee and Ramsey2014). Here, all charcoal samples were modeled with the OxCal's charcoal outlier protocol (Table 1), which assumes that charcoal samples will produce dates that are earlier than the event of interest. The protocol models an exponential distribution of the dates, with most of them close to the event and fewer of them more distant in time. The exponential tail stretches about 400 years at a 95 percent probability. I treated all charcoal samples as 100 percent likely to be outliers.
Samples that were not charcoal but possibly displaced through bioturbation or other processes were treated with OxCal's general outlier protocol, which models the sample distribution both earlier and later than the event of interest (Dee and Bronk Ramsey Reference Dee and Ramsey2014; Bronk Ramsey Reference Bronk Ramsey2009b). Here, the event of interest is the primary stratum from which the sample was taken; no specific human event is being dated, which gave me some leeway in trying to disentangle the samples. As long as the samples were constrained to a cultural phase, I was unconcerned with whether they may have been displaced among the zones or subzones in that phase.
It is important to note that the outlier evaluation did not focus on only those samples with low Ai indices in the initial model run. Every subzone that contained a sample was evaluated, and all samples in that subzone were treated with the same outlier protocols, regardless of their Ai in the initial model run. This avoids the pitfall of confirming the consequent through manipulating data to make the model better, rather than modifying the model to better fit the data. In sum, samples were treated in the following manner: (1) all charcoal samples were modeled with the charcoal protocol at a likelihood of 1.0, regardless of whether or not they also met one of the other outlier criteria; (2) subzones derived entirely from slopewash were treated with the charcoal outlier with a likelihood of 1.0 (because the sample must have an inherent age); (3) subzones derived from human dumping episodes were treated as general outliers with a likelihood of 1.0; (4) subzones that showed evidence of disturbance from subzones of another cultural phase (bioturbation or intrusion), human dumping, or intermixing with younger material, or that consisted of a majority of slopewash or colluvium, were treated with the general outlier protocol with a likelihood of .05.
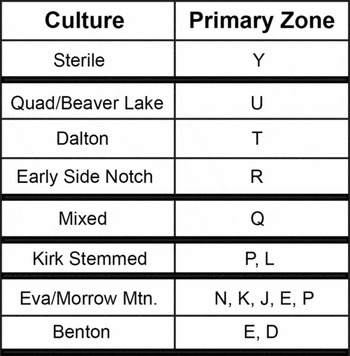
In addition to outliers, I also included “boundaries” between several cultural phases (Figure 1). Boundaries are undated events always included at the beginning and end of a sequence that bracket the 14C dates in the model, the justification being that it is highly unlikely that the earliest and latest 14C dates of a sequence are included in the set of dates being modeled. Boundaries can also be inserted between phases in a sequence when the transition between them is abrupt, indicating a hiatus of unknown length. Here boundaries were inserted between strata separating cultural components when the geomorphological analyses clearly indicated a hiatus or abrupt change in deposition (Sherwood Reference Sherwood2001).
Schematic of the cultural phases, their primary strata, and inter-phase boundaries (heavy black bars).

Although it is fair to assume that hiatuses were likely between sequential occupations of the cave, occupations were not being dated directly. Including boundaries between all cultural components could introduce inaccuracy in the results by modeling hiatuses in deposition that are not warranted by the geomorphology. I checked this reasoning by running a model with boundaries between all cultural components; the results are reported below.
The zones with 14C samples, and how they were handled in the second model, are described below. Figure 1 is a schematic of the phases, primary zones, and boundaries.
Sterile Zone Y. This culturally sterile stratum has a distinct boundary with the overlying Zone U (Sherwood Reference Sherwood2001:208).
Paleoindian Zone U. The earliest cultural zone is best associated with Beaver Lake and Quad points but also Dalton points (Sherwood et al. Reference Sherwood, Driskell, Randall and Meeks2004:544). No adjustments were made, other than to Beta-40608, which was a charcoal sample. No abrupt transition between Zones U and T was noted.
Paleoindian Zone T. This zone may be best associated with Dalton points (Sherwood et al. Reference Sherwood, Driskell, Randall and Meeks2004:544) and is so associated here. Sherwood (Reference Sherwood2001:216--218) states that “[n]umerous pit deposits and activity areas related to Zone R [the next higher, i.e., younger, component] are visible, intruding into the top of Zone T2,” which indicates that some disturbance from the younger Zone R could affect samples from Zone T2. Thus, non-charcoal samples from Zone T2 (Beta-147132, Beta-133788, Beta-147135) were modeled with the low-probability general outlier protocol. The boundary between Zones T and R was not abrupt.
Early Side Notched Zone R. Zone R was rich in Early Archaic diagnostics, unifacial tools, and debitage, and Sherwood et al. (Reference Sherwood, Driskell, Randall and Meeks2004:547--48) were confident in the cultural affiliation. Sherwood (Reference Sherwood2001:234) states “relatively intensive anthropogenic activity and disturbance mark the transition from Zone T2 to R1 and R9.” The sample from R1 (Beta-81606) was modeled with the low-probability general outlier protocol. Zone R9 was formed from slopewash and is an extension of the steep S1 talus at the front of the cave (Sherwood Reference Sherwood2001:239). Thus, the sample from R9 (Beta-81602) is treated here as secondarily deposited, and the 14C sample as displaced from its original deposition location in the talus. The timing of the deposition of S1 is not known, but it must be earlier than Zone R9. Although the sample was not wood charcoal, it was treated as a high-probability charcoal outlier because of the assumptions in that protocol (i.e., the sample is earlier but has a 95 percent chance of being within 400 years of the event). The boundary between Zone R and overlying Zone Q indicates a non-conformity (Sherwood Reference Sherwood2001:244).
Mixed Zone Q. Zone Q is problematic; its origin is unclear. It rests on the Zone R disconformity and contains Early Archaic Big Sandy, Kirk Corner Notched, and Middle Archaic Kirk Stemmed points, which indicates that it likely reworked the top of Zone R and a probable, now-missing, Kirk Corner Notched component (Sherwood et al. Reference Sherwood, Driskell, Randall and Meeks2004:548). It also had an “uncomfortable” boundary with the overlying Zone P (Sherwood Reference Sherwood2001:249). Two samples were obtained from Zone Q: Beta-81608 from a charcoal lens at the top of the zone and Beta 19498 from Zone Q4 within the zone. Sherwood (Reference Sherwood2001:249) noted that the charcoal lens “appeared to be part Zone Q at the macroscopic scale [but] microscopic observation of the upper boundary suggests that the charcoal actually rests on top of Q, with bioturbation and possible trampling obscuring the boundary.” She also infers that the cave was wetter during Zone Q times and likely periodically uninhabitable, and the lens represents a burning event that made the cave more hospitable prior to the Zone P occupation, which was the most intensive in the cave's history (Sherwood Reference Sherwood2001:251). Although this sample was assigned to Zone Q, it seems just as likely that it dates to the beginning of the deposition of the overlying, younger Zone P. Thus, I moved the sample to the overlying Zone P phase and modeled it with the low-probability general outlier protocol. This left Zone Q with one date, which means that it could not be treated as a phase; phases must have at least two dates. The sample for Beta 19498 was nut or wood charcoal, which I modeled as a charcoal outlier. Thus, Zone Q was modeled with two boundaries and a single date.
Kirk Stemmed Zone P. The boundary between Zones P and the overlying Eva/Morrow Mt. Zone N is “abrupt and uncomfortable” (Sherwood Reference Sherwood2001:276).
Kirk Stemmed Zone L. No adjustments were made to the sample from this zone.
Eva/Morrow Mountain Zone N. The majority of sediments in Zone N were derived from slopewash (Sherwood Reference Sherwood2001:279). Samples from this zone (Beta-65182, Beta-65175) were modeled with the low-probability general outlier protocols.
Eva/Morrow Mountain Zone K. Zone K3, just above Zone N, represents a rake-out “perhaps of extensive burning activity at the entrance of the cave, coupled with burning surfaces on the top of Zone N” and results from numerous dumping activities (Sherwood Reference Sherwood2001:286). Samples from Zone K3 (Beta-65170, Beta-65173) were treated with the high-probability general outlier protocols.
Eva/Morrow Mountain Zone J. No adjustment was made to the sample from this zone.
Eva/Morrow Mountain Zone E. Zone E1 has evidence of intermixed younger material (Sherwood Reference Sherwood2001:304--305). Samples from Zone E1 (Beta-48752, Beta-100509) were modeled with the low-probability general outlier protocols. No abrupt transition was noted between Zones E and D.
Benton Zone D. Although bioturbation was noted in the micromorphology (Sherwood Reference Sherwood2001:312), there was no indication that it extended beyond the zone. Thus, no adjustments were made to these samples.
Results
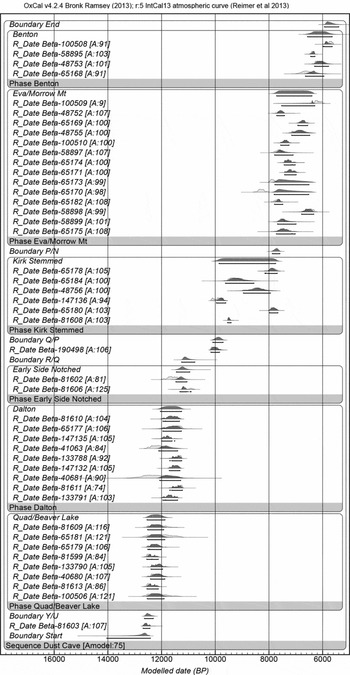
The second model iteration with outlier protocols and boundaries produced a satisfactory Amodel index of 75.3. All individual ages had Ai indices above 60 except Beta-100509 in the Eva/Morrow Mountain phase, which had an unacceptable Ai of 9 (Table 1). No details on the composition of this sample were available, but several explanations for its low index are possible. The modeled age for the sample fits neatly in the overlying Benton phase, so it could have been intermixed in Zone E1 from younger material. Or the sample may have been a bulk sample, part of which may have originated from the overlying younger stratum. Bayliss (Reference Bayliss2015:688) shows that even a small percentage of such a sample originating from an overlying stratum can importantly skew the entire sample's radiocarbon age to appear younger. Further, the sample may have been in its proper location but simply a statistical outlier. Regardless, without more information and to avoid confirming the consequent, I made no change to the model based on this result. Figure 2 shows the sequence of individual dates from oldest (bottom) grouped by cultural phase. The modeled calibrated dates (black probability density functions [PDFs]) overlie the unmodeled calibrated dates (light gray PDFs).
Multiplot of the unmodeled (gray PDFs) and modeled (black PDFs) of the second OxCal model of the Dust Cave cultural sequence. Amodel indices are listed for each sample. Bars under the modeled PDFs are the 95 percent likelihood ranges.

The Amodel index for the model testing the utility of including boundaries between all cultural components was 62.2. As suspected, the quality of the model dropped. Although including boundaries arguably increased precision of the results by creating clearer boundaries between cultural components, the accuracy of the model decreased because the boundaries did not properly model the transition between geological zones.
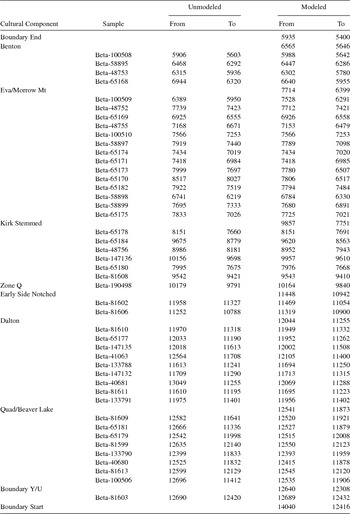
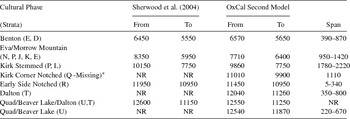
Table 2 presents the results of the second model, including unmodeled and modeled ages for each sample at the 95.4 percent likelihood. Table 3 compares the cultural component phases proposed by Sherwood et al. (Reference Sherwood, Driskell, Randall and Meeks2004:550) (and recalibrated by adding 1,950 years) with those modeled here. The OxCal results are reported at 95.4 percent likelihoods. OxCal results can be misleadingly precise, so the modeled dates were rounded to the nearest 10 years. Sherwood et al. (Reference Sherwood, Driskell, Randall and Meeks2004) were unable to differentiate Zones U and T, but the modeled results pulled those apart and are listed in the table. The start and end dates of the cultural phases overlap in the OxCal results, which represents the error in the calibrated date ranges. The start and end dates of Zone Q were estimated from the mean of the R/Q and Q/P boundaries. The Span of each cultural phase is also reported. The Span function estimates the range of the 14C dates, which will be shorter than the reported length of the cultural phase, but it gives some information on the range of variation in the estimates at 95.4 percent likelihood. The span of Zone Q was calculated as the difference between the estimated start and end dates. Sherwood (Reference Sherwood2001:245) estimated the 14C length of Zone Q to be over 1,000 radiocarbon years. My estimate of 1,050 calibrated years is close but should be treated as a rough estimate until such time as more dates from Zone Q are available. Sherwood et al. (Reference Sherwood, Driskell, Randall and Meeks2004) used the IntCal98 calibration curve (Stuiver et al. Reference Stuiver, Reimer, Bard, Beck, Burr, Hughen, Kromer, McCormac, van der Plicht and Spurk1998), which may affect some of the individual calibrated ages but not the overall model results. The IntCal13 curve is little changed for the tree-ring portion of the calibration curve from 0–12,000 years (Reimer et al. Reference Reimer, Bard, Bayliss, Beck, Blackwell, Bronk Ramsey, Buck, Cheng, Edwards, Friedrich, Guilderson, Haflidason, Hajdas, Hatté, Heaton, Hoffmann, Hogg, Hughen, Kaiser, Kromer, Manning, Niu, Reimer, Richards, Scott, Southon, Staff, Turney and van der Plicht2013).
Unmodeled Calibrated and Modeled Calibrated Dates for the Second OxCal Model.

Comparison of Cultural Component Estimates by Sherwood et al. (Reference Sherwood, Driskell, Randall and Meeks2004) and the Second OxCal Model.

Note: NR = Not Reported; dates in calibrated years B.P.
* = length and span of Zone Q estimated by the difference between the means of the boundary dates of R/Q and Q/P.
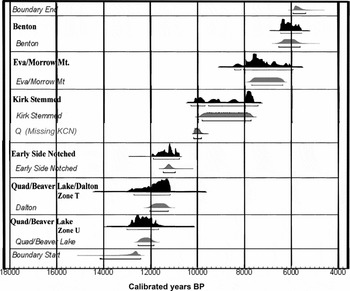
Figure 3 interleaves the sum probabilities reported by Sherwood et al. (Reference Sherwood, Driskell, Randall and Meeks2004:Figure 4; recalibrated in years B.P.; black block lettering and PDFs) with the corresponding results from the second OxCal model (gray italics and PDFs). The OxCal PDFs were created with the unspecified Date function, which produces the distribution of undated events in the phase. Each modeled PDF is approximately the maximum length of each phase. The bars below the PDFs are the 95.4 percent likelihood distributions. The PDF for Zone Q, which Sherwood et al. reported as “mixed” but did not illustrate, is represented by the single Homsey-Messer date. It likely represents a missing Kirk Corner Notched component.
Interleaved sum probabilities from Figure 4 in Sherwood et al. (Reference Sherwood, Driskell, Randall and Meeks2004; black PDFs) and cultural phase PDFs from the second OxCal model (light gray PDFs). The bars under the PDFs represent the 95.4 percent likelihood ranges.

Conclusion
Bayesian analyses have great utility in sorting out confusing sets of uncalibrated and calibrated dates, increasing precision without sacrificing accuracy and minimizing subjectivity. However, the effort takes more than simply “running numbers” and uncritically accepting the results. As with the Dust Cave record, closely examining samples and their context often requires tracking down and digging through unpublished data. Understanding context takes careful and close attention to unraveling the complex histories of caves and rockshelters. Unfortunately, most dedicated calibration programs will produce results (such as averaged dates or summed probabilities), regardless of their appropriateness. Hopefully, the days of subjectively eyeballing 14C or calibrated dates are near an end. Meeting the standards for careful sample collection and reporting sample composition recently described by Bayliss (Reference Bayliss2015) would go a long way toward producing precise and accurate chronologies in the Southeast and elsewhere.
The Dust Cave results presented here breathe new life into a valuable but sometimes frustrating and confusing record, and it is now the most precise and accurate long-chronology in the Southeast. The results establish more precise estimates of cultural phases in the Southeast, especially in the Paleoindian and Early Archaic period and will supplement that relatively sparse record. This now is the only well-dated late Paleoindian Beaver Lake/Quad component in the East and puts a new perspective on age of the Dalton phase. The Early Side Notch component can now be compared to other well-dated components in the Southeast to give us a better understanding of the spread of notching at the start of the Holocene epoch (Carter and Dunbar Reference Carter, Dunbar and David2006; Goodwin et al. Reference Goodwin, Barse and Pevny2013; Stafford and Cantin Reference Stafford, Cantin, Emerson, McElrath and Fortier2009). The same effort should be put into other radiocarbon sequences that were excavated several decades ago, such as Mummy Cave (Husted and Edgar Reference Husted and Edgar2002), Meadowcroft (Adovasio et al. Reference Adovasio, Donahue and Stuckenrath1990), Ice House Bottom (Chapman Reference Chapman1973), Modoc Rock Shelter (Ahler Reference Ahler1993), and St. Albans (Broyles Reference Broyles1966, 1971). Although it would almost always be beneficial to redate sites or collect more samples, this is not always possible. The method used here can improve the chronologies at older sites without new data, although the fine stratigraphic details and interpretations at Dust Cave may not be available for these sites. Through increasingly precise chronologies, we can better see the complexities of cultural historical connections and transitions.
This work should not be considered the final word on the Dust Cave sequence; it is not perfect. Importantly, the need to correlate cultural components with geological strata means that the span of the components is likely overestimated to an unknown degree. The model could be improved with better information on the samples (Bayliss Reference Bayliss2015). Zone Q is particularly unsatisfying. As with any chronology, more strategically chosen samples in a particular stratum or reassessing stratigraphy and cultural associations could refine or change some of the results presented here. However, the sequence published in Sherwood et al. (Reference Sherwood, Driskell, Randall and Meeks2004) has been used by archaeologists working in the eastern woodlands for over a decade to inform their work and provides our best understanding of late Paleoindian through Middle Archaic chronology in the East. Until that sequence is modified, this analysis can be used to better understand the published Dust Cave chronology.
Acknowledgments
I thank Kandi Hollenback, Boyce Driskell, Sarah Sherwood, and Lara Homsey-Messer for their efforts to track down the sample details. Three anonymous reviewers and Sarah Sherwood provided invaluable comments on the earlier draft. Sarah was particularly helpful and generous with her time and comments about the details of the stratigraphy. The commentary on the OxCal Google group was indispensable for informative discussions and help with questions about coding and interpretation (https://groups.google.com/forum/?hl=en-GB&fromgroups=#!forum/oxcal). The Spanish abstract was prepared by Lesley Blancas and checked by Andrés Izeta.
Supplemental Materials
Supplemental materials are linked to the online version of the paper, accessible via the SAA member login at https://doi.org/10.1017/aaq.2016.19.
Supplemental Text. Code used for Bayesian modeling.