1 INTRODUCTION
Velocity is an important state parameter of a moving vehicle. Precise determination of velocity is essential in many dynamic applications such as airborne gravimetry, automatic guidance, unmanned aerial vehicle control, and Inertial Navigation System (INS) calibration. Three-dimensional velocity information can be obtained quickly, inexpensively, and accurately using Global Positioning System (GPS) technology. Classically, there are three principal methods for the determination of velocity using a stand-alone GPS receiver: the Position Derivation (PD) method, in which velocity is determined using the first-order derivation of positions, Raw Doppler (RD) method, in which velocity is derived directly from the RD measurements, and the carrier-phase-Derived Doppler (DD) measurement method. The PD method is usually inaccurate because high-precision positional information cannot be achieved using a stand-alone receiver in real time. Therefore, the RD and DD methods are the favoured options in practical applications.
A series of studies (He et al., Reference He, Yang and Sun2002; Reference He, Yang, Sun and M2003; Serrano et al., Reference Serrano, Kim and Langley2004a; Reference Serrano, Kim, Langley, Itani and Ueno2004b; Wang et al., Reference Wang, Zhang and Huang2008) have indicated that velocity obtained from RD measurements can achieve accuracy of the order of centimetres per second, whereas velocity obtained from DD measurements can achieve accuracy of the order of millimetres per second. High-precision velocity results obtained by the DD method have been applied in GPS seismology studies (Zhang and Guo Reference Zhang and Guo2013; Shan et al., Reference Shan, Liu, Zhao, Zhang and Qin2013; Li et al., Reference Li, Li, Fang, Shi and Zhao2015), which confirmed that the velocity time series derived from DD measurements were in good agreement with those obtained from seismic sensors. Therefore, a single GPS receiver could be used as a velocity sensor to monitor earthquakes in real time. Additionally, the Time-Differenced Carrier Phase (TDCP) algorithm, which differences consecutive carrier phases, has been proven to attain accuracies of the order of millimetres per second (Van Graas and Soloviev Reference Van Graas and Soloviev2004; Ding and Wang Reference Ding and Wang2011; Freda et al., Reference Freda, Angrisano, Gaglione and Troisi2015). Wendel et al. (Reference Wendel, Meister, Moenikes and Trommer2006) and Soon et al. (Reference Soon, Scheding, Lee, Lee and Durrant-Whyte2008) applied the TDCP method to an integrated INS/GPS system and demonstrated an improvement in the accuracies of velocity and attitude.
Previous studies on velocity estimation have centred largely on GPS, while there has been little research considering the BeiDou navigation satellite system (BDS). Some studies have addressed BDS positioning rather than the determination of velocity or acceleration. Therefore, this study focused on BDS velocity estimation using a stand-alone receiver and the RD, DD, and TDCP methods. Furthermore, the frequency, positioning accuracy, and geometrical distance between the satellites and the earth are different for the GPS and BDS constellations. Thus, we analysed the principal errors associated with the three velocity determination methods when applied to BDS. Static and kinematic tests were executed to assess the accuracy of the velocity determined using the three techniques with BDS observations. Currently, the BDS constellation consists of five Geostationary Orbit (GEO), five Inclined Geosynchronous Orbit (IGSO), and four Medium Earth Orbit (MEO) satellites. Thus, we analysed the contributions of BDS GEO, IGSO and MEO satellites on these three velocity determinations in static and dynamic conditions. In the kinematic experiments, the differences between the DD and TDCP methods were analysed in detail.
2 EXPERIMENTAL SECTION
2.1 BDS Velocity Estimation With RD Method
2.1.1 Mathematical Model
The Doppler shift observation equation on frequency i(i = 1, 2, 3) can be written as follows (Zhang, Reference Zhang2007):
 $$\lambda_i D^s_{r\comma i}\lpar t\rpar = \dot{\rho}^s_r \lpar t\rpar + c \cdot \delta \dot{t}_r \lpar t\rpar - c \delta \dot{t}^{\, s} \lpar t-\tau^s_r\rpar + \dot{T}^{\, s}_r \lpar t\rpar - \dot{I}^s_{r\comma i}\lpar t\rpar + d\dot{M}^s_r + d\dot{R}_{{sagnac}} - d\dot{R}^s_r + \varepsilon^s_r$$
 $$\dot{\rho}^s_r \lpar t\rpar = \vec{e}^{\, s}_r \cdot [ \dot{\vec{r}}^{\, s} \lpar t-\tau^s_r\rpar - \dot{\vec{r}}_r\lpar t\rpar \rsqb$$
 $$\vec{e}^s_r = {\displaystyle{\vec{r}^{\, s}\lpar t-\tau^s_r\rpar -\vec{r}_r\lpar t\rpar } \over {\rho^s_r\lpar t\rpar }}$$
where the upper dot represents the first derivative with respect to time, c is the speed of light, λ
i
is the wavelength of the i-th carrier phase,
 $D^{s}_{r\comma i}$
represents the Doppler measurements corresponding to the carrier phase,
 $\vec{r}_{r}$
and
 $\dot{\vec{r}}_{r}$
represent the receiver position and velocity vectors, respectively,
 $\vec{r}^{s}$
and
 $\dot{\vec{r}}^{s}$
represent the satellite position and velocity vectors, respectively,
 ${d}{\dot{t}_{r}}$
and
 ${d}{\dot{t}^{s}}$
represent the receiver clock drift and the BDS satellite clock drift, respectively,
 $\dot{T}$
and
 $\dot{I}$
represent the rates of tropospheric delay and ionospheric delay, respectively,
 ${d}{\dot{M}^{s}_{r}}$
is the rate of the multipath effect,
 ${d}{\dot{R}_{sagnac}}$
is the Sagnac correction for the Doppler shift observations,
 ${d}{\dot{R}_{r}^{s}}$
is the relativistic correction for the Doppler shift measurements,
 $\varepsilon^{s}_{r}$
is the noise of the measurements,
 $\dot{\rho}^{s}_{r}$
is the theoretical Doppler shift related to a receiver-to-satellite range-rate with relativistic biases and satellite orbital eccentricity and
 $\vec{e}^{s}_{r}$
is the receiver-to-satellite line-of-sight unit vector. We suppose all the errors and biases can be modelled well and corrected, except for the receiver clock drift. When there are four or more valid satellites, the unknowns
 $\dot{\vec{r}}_{r}\lpar t\rpar $
and
 $c\delta{\dot{t}_{r}\lpar t\rpar }$
can be estimated using the least squares method.
2.1.2 Error Analysis
The major sources of error in the RD method are satellite position, velocity, clock, and clock rate errors and the relativistic effect, propagation effects in the ionosphere and troposphere, receiver position and clock rate errors, and the multipath effect.
2.1.2.1 Satellite Position and Clock Error
The satellite position can be calculated with broadcast ephemeris using the algorithm provided by ICD-COMPASS-B1I. The orbital error mainly influences the precision of the line-of-sight unit vector (Wang et al., Reference Wang, Zhang and Huang2008), and the satellite clock error affects the calculation of the signal transition time that finally leads to orbital error. Suppose the satellite clock error from the broadcast ephemeris is 20 ns and the satellite velocity is 3·2 km/s (Li et al., Reference Li, Li, Fang, Shi and Zhao2015), the satellite position error caused by the satellite clock error would be
 $6{\cdot}4 \times 10^{-5} m$
, which is negligible. From Equations (1), (2) and (3), the impact of the satellite's position error can be approximated as:
 $$\lambda \delta D= {\displaystyle{\dot{\vec{r}}_r - \dot{\vec{r}}^{\, s}} \over {\rho}} \cdot \delta \vec{r}^{\, s}$$
where δ D is the Doppler shift error caused by the satellite orbital error
 $\delta{\vec{r}^{s}}$
. BDS comprises three kinds of satellite constellations; GEO, IGSO, and MEO. For the MEO satellites, which are similar to GPS satellites, if we suppose ρ is approximately 20,000 km,
 $\dot{\vec{r}}^{s}$
is 3·2 km/s, and
 $\delta{\vec{r}}^{s}$
is 10 m, then δD will finally attain a value of up to 1·6 mm/s. Compared with the MEO satellites, the GEO and IGSO satellites present longer receiver-to-satellite lengths and slower velocities. Therefore, the influence of the estimated velocity for these two types of satellite is smaller than that of the MEO satellites for the same level of orbital error. Actually, the orbital errors are all within 5 m and the satellite clock errors are approximately 15 ns for the BDS satellites (Pan and Cai Reference Pan and Cai2014). Thus, the effect of satellite position and clock error on the velocity estimation using the RD method is of the order of a few millimetres per second.
2.1.2.2 Satellite Velocity Error
Similar to the satellite position error, the satellite velocity error affects the station velocity determination through the line-of-sight unit vector. The satellite velocity calculated from the broadcast ephemeris using the position differential algorithm can attain accuracy better than 0·1 mm/s (Liu and Guo Reference Liu and Guo2014); hence, it can be considered negligible for velocity estimations.
2.1.2.3 Satellite Clock Rate And Relativistic Effect
The frequency stability of the atomic clocks in the satellites of the BDS can reach 10−12–10−13, which will affect the velocity by up to 0·3 mm/s. After correction using the clock rate and drift parameters from the broadcast ephemeris, the residual satellite clock rate has little effect on velocity. It should be noted that because of the orbital eccentricity of the satellites of the BDS, the relativistic effect on the satellite clock rate can be as large as 0·01 ns/s, which must be corrected.
2.1.2.4 Station Position Error
Because of the large range between the satellite and the receiver, the observation model is insensitive to station error. Studies have shown that errors caused by inaccurate station coordinates can be negligible if the positioning accuracy is within 10 m (Serrano et al., Reference Serrano, Kim, Langley, Itani and Ueno2004b). Currently, the three-dimensional standard point positioning accuracy of the BDS is better than 10 m (Chen et al., Reference Chen, Hu and Wang2015).
2.1.2.5 Atmospheric Delay Rate and Multipath
The atmospheric delay rate, which includes the ionospheric and tropospheric delay rates that are dependent on regional atmospheric conditions and satellite elevation can change in magnitude by the order of centimetres per second (Wang et al., Reference Wang, Zhang and Huang2008). Normally, atmospheric delay changes slowly and most of the atmospheric delay can be eliminated over short intervals, i.e., periods of 1 s or shorter, and therefore it is no longer considered. The residual atmospheric delay rate and multipath effect are treated as noise.
2.2 BDS Velocity Estimation with DD Method
2.2.1 Mathematical Model
The carrier phase is the numerical integration of Doppler shift measurements. Thus, we can obtain the Doppler shift measurements from the derived carrier phase. Studies have shown that RD measurements are much noisier than DD measurements (Szarmes et al., Reference Szarmes, Ryan and Lachapelle1997). The RD shift is measured over a very small interval of time, whereas the DD shift is computed over a longer period. Thus, random noise associated with the DD measurements is averaged and reduced (Szarmes et al., Reference Szarmes, Ryan and Lachapelle1997; Serrano et al., Reference Serrano, Kim, Langley, Itani and Ueno2004b). The DD measurements are usually derived from the first-order central difference approximation of the carrier phase. The computation formula is as follows (Szarmes et al., Reference Szarmes, Ryan and Lachapelle1997):
 $$D^s_{r\comma i} \lpar t\rpar = \dot{\varphi}^s_{r\comma i}\lpar t\rpar = {\displaystyle{\varphi^s_{r\comma i}\lpar t+ \Delta t\rpar -\varphi^s_{r\comma i}\lpar t-\Delta t\rpar } \over {2\Delta t}}$$
where
 $\dot{\varphi}^{s}_{r\comma i}\lpar t\rpar $
is the DD measurements at epoch t, Δ t is the time interval of the observational data, and
 $\varphi^{s}_{r\comma i} \lpar t + \Delta t\rpar $
and
 $\varphi^{s}_{r\comma i}\lpar t - \Delta t\rpar $
are the carrier phase values of the
 $t\, +\, \Delta t$
and
 $t\, -\, \Delta t$
epochs. Then, we substitute Equation (5) into Equation (1) to estimate the velocity.
2.2.2 Error Analysis
The major sources of error of the DD method are common with the RD method, as described in Section 2.1.2, except for the Doppler measurements error.
2.2.2.1 The DD Measurements Error
The uncertainty of DD measurements can be derived from the law of error propagation. If we suppose the accuracy of the carrier-phase observation
 $\delta \lambda$
is 2 mm and the data interval is 1 s, the accuracy of DD measurements will be
 $\delta \lambda \cdot \sqrt{2}/2$
. Thus, the effect on velocity estimation would be <2 mm/s using the DD measurements.
2.3 BDS Velocity Estimation with TDCP Method
2.3.1 Mathematical Model
The measurement model of the carrier phase can be expressed as:
 $$\lambda \varphi = \rho + c \delta t_r - c\delta t^s + \lambda N- I + T + \varepsilon$$
where ε is the wavelength, φ is the measured carrier phase in cycles, ρ is the geometric receiver–satellite range, c is the speed of light, δt r and δt s are the receiver clock bias and satellite clock bias, respectively, N is the integer ambiguity, and I and T are ionospheric and tropospheric errors, respectively. The term ε includes the multipath and receiver noise.
TDCP measurements are the time difference of successive carrier phases to the same satellite at small sampling intervals (≤1 Hz). The constant integer ambiguities are eliminated, as are most of the common mode errors such as satellite clock bias, ephemeris error, tropospheric error, and ionospheric error, which vary slowly within a small sampling rate. The difference between the carrier-phase measurements at two successive epochs t j and t j−1 is given by:
 $$\lambda \Delta \varphi = \Delta \rho + c\Delta \delta t_r - c\Delta \delta t^{\, s} - \Delta I + \Delta T + \Delta \varepsilon$$
where Δ represents the differencing operation. For example, Δρ is the change in the geometric range between the two epochs and other terms are defined accordingly, as in Equation (6). The receiver–satellite range Δρ can be formulated, as follows, using the approach of Van Graas and Soloviev (Reference Van Graas and Soloviev2004):
 $$\Delta \rho = [ \vec{e}\lpar t_j\rpar \cdot \vec{r}_r\lpar t_{j-1}\rpar \rsqb -[ \vec{e}\lpar t_{j-1}\rpar \cdot \vec{r}_r\lpar t_{j-1}\rpar \rsqb - [ \vec{e}\lpar t_j\rpar \cdot \vec{r}^{\, s}\lpar t_j\rpar \rsqb - [ \vec{e}\lpar t_{j-1}\rpar \cdot \vec{r}^{\, s}\lpar t_{j-1}\rpar \rsqb -[ \vec{e}\lpar t_j\rpar \cdot \Delta \vec{r}_r\rsqb $$
where
 $\Delta{\vec{r}_{r}}$
is the displacement vector between epochs t
j
and t
j−1. The velocity between epochs t
j
and t
j−1 can be obtained easily after
 $\Delta{\vec{r}_{r}}$
is estimated using the least squares method.
2.3.2 Error Analysis
2.3.2.1 Satellite Position And Receiver Position Error
The work of Van Graas and Soloviev (Reference Van Graas and Soloviev2004) confirmed that when the receiver position error is within 10 m, its influence on velocity determination would be negligible. The satellite position error and receiver position error have the same significance on the line-of-sight unit vector, and therefore the satellite position error could also be negligible.
2.3.2.2 Satellite Clock Error
As shown in Equation (8), the difference in the satellite clock
 $\Delta \delta t^{s}$
between two successive epochs has considerable effect on velocity estimation. The influence of
 $\lambda\Delta\varphi$
can be up to 30 cm if the uncertainty of
 $\Delta \delta t^{s}$
is 0·1 ns. Therefore, the satellite clock error must be corrected.
2.3.2.3 Atmospheric Delay Rate and Multipath
The errors associated with the atmospheric delay rate and multipath are similar to the RD method.
2.3.2.4 Carrier Phase Error
Generally, the accuracy of the carrier phase is 2 mm. The influence of the carrier-phase error on velocity estimation is of the order of millimetres per second when there is no cycle slip. Hence, the cycle slip detection and repair method (Cai et al., Reference Cai, Liu, Xia and Dai2013) must first be applied to the raw carrier-phase measurements.
3 EXPERIMENTAL RESULTS AND ANALYSIS
In this section static and kinematic experiments were performed to assess the accuracies of the three methods for BDS velocity determination. In addition, contributions of BDS GEO, IGSO and MEO satellites on these three velocity determinations are analysed in detail.
3.1 Static Experiments
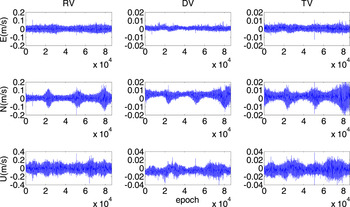
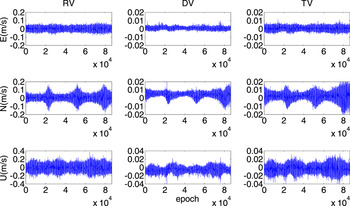
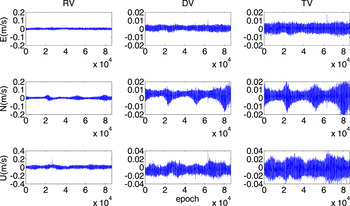
In the static tests, we analysed 1 Hz BDS data from 13 Hong Kong (HK) Continuously Operating Reference System (CORS) stations on Day Of Year (DOY) 290 in 2015 (receiver types are listed in Table 1). The data were collected over periods of 24 h. To analyse the influence of receiver type on velocity determination, we classified the velocity results according to receiver type. The velocity results were converted to East (E), North (N), and Up (U) components. Then we compared the results with zero-truth values to assess the precision of the velocity estimations. The velocity results based on the data from the HKSC, HKMW, HKKS stations, equipped with different receivers, are presented in Figures 1, 2 and 3, respectively. Parameters RV, DV, and TV represent the velocities obtained from the RD, DD, and TDCP methods, respectively. Table 2 shows the Root Mean Square (RMS) statistics of the 24 h velocity series for these three stations.
E (upper), N (middle), and U (lower) components of the 24-h velocity series at station HKSC.

E (upper), N (middle), and U (lower) components of the 24-h velocity series at station HKMW.

E (upper), N (middle), and U (lower) components of the 24-h velocity series at station HKKS.

BDS receiver types and manufacturers at selected sites.

RMS statistics of velocity error at stations HKSC, HKMW, and HKKS.

As shown in Figure 1, the accuracy of RV in the E, N, and U directions is of the order of centimetres per second, whereas the precision of DV and TV is of the order of several millimetres per second. In addition, it can be seen that the RV results in the U component are much noisier than the E and N directions and the DV and TV results. Similar characteristics can be seen in Figures 2 and 3. However, the amplitudes of the RV results in the three figures show different ranges, which indicate that the RV accuracy is affected by receiver type.
In Table 2, the RMS statistics of RV in the E, N, and U directions differ between receivers. For the Trimble NetR9 receiver, the accuracies of the E and N components are of the order of millimetres per second, whereas the velocity precisions of the Leica GR25 and GRX1200 + GNSS receivers are of the order of centimetres per second. However, similar accuracy of velocity determination is attainable with the DV and TV methods, irrespective of receiver type. The RMS values of the velocity series for these two methods reach 1–2 mm/s in the E component, 4–5 mm/s in the N component, and 7–8 mm/s in the U component. These figures prove that the DV and TV methods are superior to the RV method for BDS velocity determination.
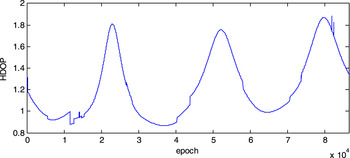
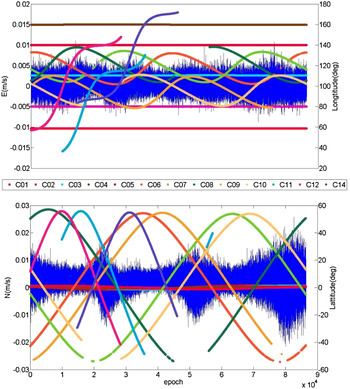
Further analysis revealed that the time series of RV, DV, and TV in the E component almost tended toward a white noise series, while three peaks were presented in the N component. In Figure 4, the variations of Horizontal Dilution Of Precision (HDOP) values of the BDS are visibly consistent with the amplitudes of the N component. To investigate the reasons for this phenomenon, the longitude and latitude of the ground traces of the satellites of the BDS on DOY 290 are detailed in the upper and lower panels of Figure 5. The upper panel illustrates that three peaks occur during the period when few satellites appear in the north region in relation to the receiver. In contrast, because the GEO satellites (C01–C05) are distributed well with respect to the receiver in the longitudinal direction (and motionless over the equator), the highest velocity precision with the BDS is in the E component.
HDOP values of the satellites of the BDS with respect to station HKMW.

Longitude and latitude of ground traces for satellites of the BDS: (upper) E and (lower) N components.

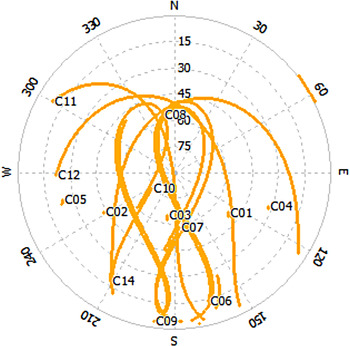
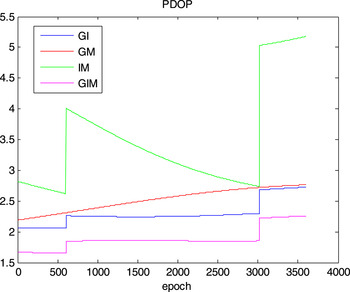
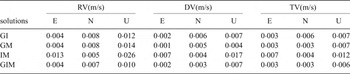
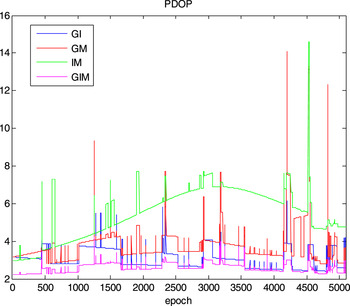
In order to quantify and analyse different contributions of BDS GEO, IGSO, and MEO satellites on the three velocity determinations, we use different combinations of BDS satellites to obtain velocity, respectively. The solutions are listed in Table 3. All of the aforementioned sites are used for the result analysis. In the meanwhile, station HKKS is analysed in detail, as the sites in HK have similar observation conditions for BDS (shown in Figure 6). It is noted that we select the observation of schedule UTC 4:00-5:00 for statistical analysis, during which all the BDS satellites are well tracked. The statistical results are listed in Table 4. Figure 7 demonstrates Position Dilution Of Precision (PDOP) values of different velocity estimation solutions.
Sky-plot of station HKKS for BDS.

PDOP values of different velocity estimation solutions in static mode. (GI: GEO + IGSO, GM: GEO + MEO, IM: IGSO + MEO, GIM: GEO + IGSO + MEO).

Velocity determination solutions and their abbreviations.

RMS statistics of velocity error at stations HKKS using different combinations of BDS satellites.

From Table 4, for RV, the results of velocity estimation solutions with all BDS satellites are the best. The velocity accuracy significantly decreases, particularly in the E and U components, once observations of GEO satellites are not used for velocity estimation (IM solution). Specifically, the degradations are about 0·09 m/s in the E component, and 0·016 m/s in the U component. Similar phenomena can be found in DV and TV. To investigate the reasons for this phenomenon, the PDOP values of four solutions are detailed in Figure 7. It is because the satellites' geometry condition seriously declined when excluding GEO satellites, which resulted in a significant decrease in velocity precision. Conclusively, the largest contribution among three kinds of BDS satellites are GEO satellites. Due to the GEO satellites being stationary and distributed on the equator (shown in Figure 5), their impact on velocity precision in the N direction is not significant.
3.2 Vehicle-Borne Kinematic Experiment
To test the performance of the velocity estimations with the BDS in real-time kinematic mode, we performed a low dynamic experiment. Furthermore, we executed different velocity determination solutions (as shown in Table 3) to assess the contributions of BDS GEO, IGSO, and MEO satellites in kinematic conditions. The BDS data, sampled at 1 Hz on DOY 172 in 2013 (02:35–04:00 UTC), were collected in Wuhan using a vehicle-borne Trimble NetR9 receiver. The car was also equipped with high-precision INS equipment. The results of the BDS velocity estimations using the three methods mentioned above were all compared with the results of the INS. Because the INS data were sampled at 200 Hz, we first interpolated the velocity derived from the INS based on the receiver data-collection time. It should be noted that the velocity from the TDCP method was the averaged velocity during Δt. Because this was almost equivalent to the instantaneous velocity at moment Δt/2, we interpolated the INS velocity according to moment Δt/2.
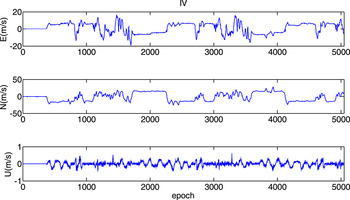
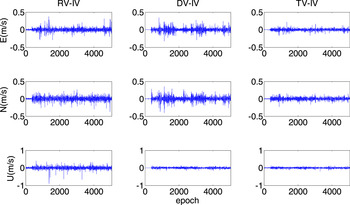
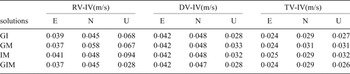
Figure 8 shows the velocity series of the INS on the E, N, and U components, which were regarded as reference values in this experiment. The parameter IV represents the velocity obtained from the INS, and the differences between RV and IV, DV and IV, and TV and IV with B solution are illustrated in Figure 9. It was established that the RMS values of the differences between RV and IV, DV and IV, and TV and IV are of the order of centimetres per second in the E, N, and U components (as shown in the last line of Table 5). The velocity accuracy of TV in the three directions is much greater than that of DV. We omitted a comparison of the RV and IV results with the values derived from the RV method because of the significant impact of receiver type. However, the RMS values of the difference series of the U component for the three methods are much smaller than for the E and N components; the converse of the static tests.
E (upper), N (middle), and U (lower) components of INS velocity series.

Differences in E (upper), N (middle), and U (lower) components between the RV and IV, DV and IV, and TV and IV for GIM solution.

RMS statistics of the differences between the RV and IV, DV and IV, and TV and IV using different combinations of BDS satellites.

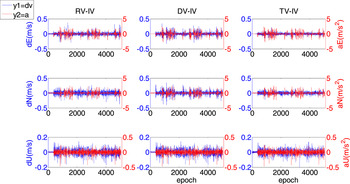
We found the differences series of the E and N components, shown in Figure 9, present a systematic characteristic, whereas the values of the U component present a random characteristic. Research (Ryan et al., Reference Ryan, Lachapelle and Cannon1997) has revealed that the RV error and acceleration or acceleration rate of the vehicle have the following relation:
 $\delta v = a \cdot A\lpar t\rpar $
, where δv is the velocity error, A(t) is the acceleration or acceleration rate of the vehicle, and a is a proportional coefficient that differs from receiver to receiver. As shown in Figure 10, the variations of the acceleration values in three directions are clearly consistent with the features of the differences between DV and IV, as well as between RV and IV and TV and IV (Figure 9). The precisions of the velocity determinations based on these three methods are degraded by sudden acceleration of the vehicle. The U component of the acceleration of the vehicle is almost equal to zero; thus, the velocity error of the U component is much smaller than the E and N components.
Correlation of three kinds of velocity error and the vehicle acceleration in E (upper), N (middle), and U (lower) components for GIM solution.

As is known, IV uses an accelerometer to obtain the acceleration of the vehicle and the velocity is obtained following an integral calculation. Therefore the dynamic condition (such as acceleration) of the vehicle has little influence on vehicle velocity. In fact, DV is the averaged velocity during 2Δt and TV is the averaged velocity during Δt. When the vehicle's dynamic conditions change dramatically, the differences between the averaged and the instantaneous velocities are enhanced. This is the reason why the TV method demonstrates better performance than the DV technique in dynamic conditions (as shown in Figure 9 and Table 5).
From Table 5, for the three kinds of velocity, we find that the results of velocity determination solutions with all BDS satellites are the best; consistent with results of static experiments. However, the contributions of BDS GEO, IGSO, and MEO satellites in kinematic mode is not as obvious as the static tests. The main reason is that the satellites' geometry condition in kinematic conditions is much poorer than that in static mode. (as shown in Figure 11).
PDOP values of different velocity estimation solutions in kinematic mode. (GI: GEO + IGSO, GM: GEO + MEO, IM: IGSO + MEO, GIM: GEO + IGSO + MEO)

4 CONCLUSIONS
In this study, we investigated BDS velocity determination using a stand-alone receiver and the RD, DD, and TDCP methods. In addition, we analysed the performance of velocity estimation using different combinations of BDS satellites in static and kinematic cases. The principal conclusions are as follows.
In the static tests, the velocity precision of RV on the E, N, and U components was of the order of centimetres per second, whereas it was of the order of millimetres per second for DV and TV. It was established that the DD and TDCP methods for velocity estimation with the BDS could be used for studies of seismology or tsunamis. Because of the irregular distribution of the satellites of the BDS, three peaks exist for the N component in the 24 h velocity series of the three methods. Moreover, the satellites' geometry condition seriously declined when excluding observations of GEO satellites, which resulted in significantly decreased velocity accuracy, particularly in the east and vertical components.
In the kinematic tests, in which the velocity derived from high-precision INS equipment was considered a reference value, the RMS of DV and TV was of the order of centimetres per second. In addition, the TV results in the E, N, and U directions were much more precise than the DV results. Among the three methods, the TDCP method was proven the most effective in dynamic conditions. Moreover, the precisions of the velocity determinations using these three methods were degraded by sudden acceleration of the vehicle.
ACKNOWLEDGMENTS
The authors would like to thank the Hong Kong Geodetic Survey Services for providing the BDS data, and the IGS MGEX for providing the BDS broadcast ephemeris. The authors gratefully acknowledge the reviewers for their constructive comments on the manuscript.