I. INTRODUCTION
Due to the high specific strength, excellent biocompatibility, and corrosion resistance, pure titanium has been extensively used in aerospace, biomedical, and chemical industries. Reference Zeng, Zhang and Jonsson1,Reference Tao, Wu, Leong and Fang2 Generally, pure Ti metal can exist in two crystalline structures, namely α-phase (hexagonal close-packed, HCP) and β-phase (body centered cubic) crystal structures. Reference Lonardelli, Gey, Wenk, Humbert, Vogel and Lutterotti3–Reference Kotkunde, Deole, Gupta, Singh and Aditya5 Conventionally rolled commercial pure titanium (CP-Ti) sheets tend to exhibit on texture analysis double peaks of basal poles tilted at ±35° in the transverse direction (TD), denoted as TD-split texture, which result in a large planar anisotropy and in depletion of sheet formability. Reference Kim, Yoo and Lee6,Reference Kima, Yoo, Jeong, Kim, Choe and Lee7 It is therefore important to control the rolling texture to achieve CP-Ti sheets with enhanced formability.
Improving the stretch formability by modifying texture has been widely investigated on magnesium alloy, which is also with HCP structure. Through weakening the basal texture, it does benefit to the activation of slips and coordinate the deformation along thickness direction. Reference Zhang, Cheng, Fan, Xu and Dong8–Reference Huang, Suzuki, Watazu, Shigematsu and Saito10 However, texture component is much more different. Huang et al. Reference Huang, Suzuki and Chino11 indicated that a dramatic change orientation of CP-Ti sheet, from conventional TD-split texture to a basal texture, was achieved through different speed rolling (DSR) procedures which were carried out above 573 K, leading to an enhanced stretch formability. Gurao et al. Reference Gurao, Sethuraman and Suwas12 reported that the texture and mechanical properties of CP-Ti sheets were seriously affected by the rolling paths, namely unidirectional rolling (UDR), two-step cross rolling, multistep cross rolling, and reverse rolling (RR). The cross rolled samples show near basal texture compared to the basal transverse texture observed in UDR and RR samples. Abarbekoh et al. Reference Nasiri-Abarbekoh, Ekrami, Ziaei-Moayyed and Shohani13 investigated the effect of rolling reduction on the anisotropy of mechanical properties of commercially pure titanium, showing that the increase of rolling reduction up to 50% led to the formation of a strong-basal texture that results in an isotropic mechanical response. Milner et al. Reference Milner, Abu-Farha, Kurfess and Hammond14 indicated that the texture evolved from TD-split texture to primarily basal texture after performing termed isolated shear rolling on commercial pure titanium sheets at 673 K. The stretch formability was improved and the anisotropy decreased greatly. Therefore, a basal texture formed by different modes of rolling did benefit to decrease the anisotropy of CP-Ti sheet. However, it was highlighted that the basal texture formed in previous researches was also thermally unstable.
It is also worth considering that Zhang et al. Reference Zhang, Huang, Wang, Roven and Pan15 researched the effects of different rolling routes on the microstructure and properties of AZ31. It was revealed that three-direction rolling was an effective way to enhance the stretch formability. Thus, to decrease the mechanical anisotropy and improve the formability of CP-Ti sheet as well, three directions combining with DSR was conducted in this experiment.
II. EXPERIMENTAL PROCEDURE
Commercially available hot-rolled CP2-Ti sheets with a thickness of 1.2 mm are used as the starting materials and cut into square samples with dimensions of 80 mm × 80 mm. The samples are heated in a furnace at 673 K for 30 min. Then UDR, DSR with various rolling routes are conducted and each rolling pass reduction is 0.1 mm. UDR is unidirectional rolling, CR is cross rolling (CR), and TDR is three-direction rolling (TDR) where the rolling direction (RD) is changed by 45° around the normal direction (ND) after each CR. And DSCR is the CR combining DSR, DSTDR is TDR combing with DSR. During DSR, the rotation speed ratio is 1.5 between upper and lower roll. All the rolling experiments were carried out by 6 passes and after each rolling pass the rolled samples were reheated in furnace for 5 min to 673 K again. Eventually, the sheets were reduced to a thickness of about 0.6 mm. After rolling, all the sheets were subjected to final annealing at 933 K for 2 h.
Tensile specimens are taken from various rolled Ti sheet along RD, 45° and TD. The gauge length is 30 mm × 5 mm in length and width. Uniaxial tensile tests were carried out on a CMT6305-300KN electronic universal testing machine (Sansi Company, Shenzhen, China) with a strain rate of 1 × 10⁻³ s−1 at room temperature. Besides, Erishen specimens are cut into a square of 50 mm × 50 mm from the rolled sheet as well. Then, Erishen tests are conducted at room temperature. The punch speed is set as 3 mm/min and blank-holder force is 10 KN.
The microstructure was examined by electron backscatter diffraction (EBSD) analysis using an HKL Chanel 5 System equipped in a scanning electron microscope (JEOL GSM-7800F FEG SEM, JEOL Ltd., Tokyo, Japan). The (0002) pole figure was obtained by an x-ray diffractometer (Rigaku D/max-2500 PC, Rigaku Corporation, Tokyo, Japan). In following paragraphs, RD, ND, and TD represent the rolling, the normal and the transverse directions of as-rolled sheets, respectively.
III. RESULTS AND DISCUSSIONS
A. Normal rolling
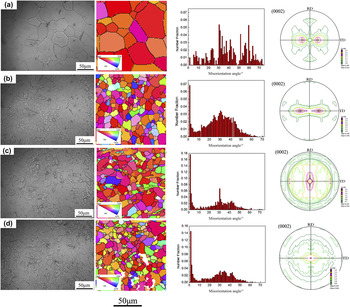
Figure 1 shows the EBSD maps and misorientation distributions as well as (0002) pole figures observed by X-ray diffraction (XRD) on various rolled Ti sheet. It can be seen that the grains are refined greatly after rolling. Grain size of as-received, UDR, CR, and TDR is 37.3, 11.4, 10.7, and 6.7 μm, respectively. The misorientation distributions are scattered in as-received specimens. Due to the larger grain size, EBSD data on as-received specimens is limited. Thus, the optical microstructure is added. And misorientation distribution is emphasis discussed on various rolled specimens. After UDR, TD tilted texture is still kept in Ti sheet, while the number fraction of low-angle grain boundaries increases. Besides, all the figures [Figs. 1(b)–1(d)] show a strong peak in the low-angle regime (<5°) and a diffused population of peaks at higher angles after various routes rolling. And the correlated misorientation angle distributions present a spike around 30° in the rolled CP-Ti samples. The near-30° spike was observed by other authors in recrystallized structure of HCP metals and was attributed to continuous dynamic recrystallization (DRX). Reference Gottstein and Al Samman16,Reference Zhu, Bacroix, Chauveau, Chaubet and Castelnau17
EBSD maps and (0002) pole figures observed by XRD on various routes normal rolling: (a) as-received, (b) UDR, (c) CR, (d) TDR.

Besides, it finds that (0002) basal texture changes greatly after various routes rolling. As-received Ti sheet shows a TD-spilt ±30° basal texture with intensity of 2.614. After UDR, the texture tilts to TD about 40° and intensity has a slightly drop. In CR specimen, a basal texture is generated, besides, it is much more diverging and tilts to RD at the same time. The intensity is 1.654. While the pole density is located in the center of (0002) pole and most of grains rotate to ND which results in a typical fiber basal texture after three directional rolling, as shown in Fig. 2(d). Huang et al. Reference Huang, Suzuki and Chino11 considered that the formation of fiber texture of pure Ti sheet needs a thermal activation besides the intense shear deformation, and the activity of basal slips plays an important role. Shi et al. Reference Shi, Takayama, Umetsu, Kato, Watanabe and Inoue18 introduced shear strain by friction roll surface processing at room temperature, only the TD-spilt texture was obtained which proved this statement. While, it is also consistent with Huang's results in this investigation. After UDR in specimens A, it is still TD tilted texture though the temperature is higher than 473 K. Glavicic et al. Reference Glavicic, Salem and Semiatin19 reported that prismatic slip is the dominant deformation mechanisms in titanium sheet, however, the CRSS is similar with prismatic slip when temperature is above 473 K. Zhang et al. Reference Zhang, Huang, Roven, Wang and Pan20 reported that the direction of tensile and compressive stress on the sheet is alternatively changing during CR and TDR, especially in TDR. The changing of stress may promote the activation of basal slips during rolling process which results in the ND-rotation of c-axis of grains, especially in TDR, as shown in Fig. 2(d). It means that not only induced shear deformation but also changed strain path combining with thermal activation can promote the fiber basal texture. The more the path directions change, the more an enhanced fiber texture is easily generated.
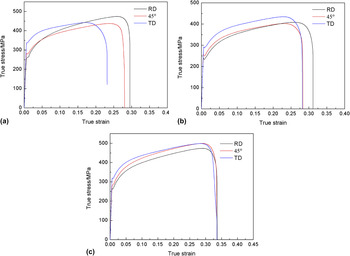
True tensile stress versus strain curves of various rolled titanium sheet at room temperature: (a) UDR, (b) CR, (c) TDR.

1. Mechanical properties
Figure 2 shows true tensile stress versus strain curves of various rolled titanium sheets at room temperature. The mechanical properties, i.e., the ultimate tensile strength (UTS), 0.2% proof stress (YS), fracture elongation (FE), Lankford value (r-value), and strain-hardening exponent value (n-value), are summarized in Table I. Comparing with UDR sheets, samples after CR and TDR show a decrease of yield strength. The highest YS is obtained along TD and lowest along RD. Yield strength differences between RD and TD decreases from 70 MPa at UDR to 54 MPa and 50 Mpa at CR and TDR, respectively. In CR and TDR sheets, it exhibits relatively decreasing yield anisotropy in comparison to UDR. The decreasing YS may be related to the rotated grains. Huang et al. Reference Huang, Suzuki and Chino11 reported that the decreased inclination angle of split peaks texture did benefit to the activation of prismatic slip. The Schmid factor of prismatic slip increases as the enhancement of fiber basal texture. As well known, grain refinement has a function of strengthening. However, the texture effect may play a more important role. Thus, the softening effect induced by fiber texture results in the decreasing of YS in CR and TDR sheet. However, grain refinement may play a stronger role when the size is refined to a critical value. And YS increases in TDR specimens comparing with CR titanium sheet. Furthermore, the enhancement of fracture elongation can also be attributed to tilted texture.
Mechanical properties of various routes rolled Ti sheets during normal rolling.

From Table I, strain-hardening exponent value (n-value) decreases a little along RD which increases along 45° and TD both in CR and TDR sheets. Average n-values are defined as:
 $\bar n = ({n_{{\rm{RD}}}} + {n_{{\rm{TD}}}} + 2{n_{45^\circ }})/4$
. It can be seen that
 $\bar n$
increases in CR and TDR specimens comparing with UDR. Huang et al.
Reference Huang, Suzukia, Chino and Mabuchi21
indicated that n-value increases after high temperature rolling which is owed to inclination texture being more conducive to slips in magnesium alloy. Maybe it is the similar reason that the improved n-value is owing to the rotated fiber texture which is favorable to prism slips on titanium sheet. As well known, n-value is a criterion that materials can sustain the work hardening during deformation.
Reference Zhang, Huang, Wang and Li22
A higher n-value does benefit to the continuous deformation.
Lankford value (r-value) increases in CR and TDR sheets comparing with UDR at three directions. The average of r-value which is defined by
 $\bar r = ({r_{{\rm{RD}}}} + {r_{{\rm{TD}}}} + 2{r_{45^\circ }})/4$
in UDR, CR, and TDR specimens is 1.77, 3.24, and 3.78, respectively. It expresses an increasing trend. During stretch stamping process, the thickness deformation cannot be coordinated in as-received specimens with a TD-spilt texture. However, after CR and TDR, a fiber basal texture is generated, as shown in Fig. 1. Huang et al.
Reference Huang, Suzuki and Chino11
reported that the decreasing inclination angle of the split peaks on pure titanium sheet resulted in the increase of r-value. Maybe it is because that prism slips are favored under tension for strong basal texture, however cannot accommodate the thickness deformation, thus r-value increases. A lager r-value prevents the thickness reduction during plane deformation which does benefit to the stretch formability of magnesium alloy sheet.
Reference Nasiri-Abarbekoh, Abbasi, Ekrami and Ziaei-Moayyed23
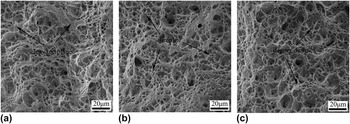
Figure 3 shows the SEM images of tensile fracture surfaces of various routes rolling sheet at room temperature. It can be seen that some cleavage plane and some dimples occur in UDR sheet. In CR sheets, the cleavages decrease and all of dimples distribute on the surface. After TDR process, the dimples become much deeper, as the arrows shown in Fig. 3. All of the characterizations indicate that the plasticity can be improved by rolling along CR and TDR.
Overview SEM images of the tensile fracture surface of (a) UDR (b) CR, (c) TDR samples.

Figure 4 shows Erichsen values (IE) of various Routes rolled sheets at room temperature. After rolling along UDR, CR, and TDR, IE-value increases from 9.3 mm to 11.03 and 11.2 mm, respectively. This result indicates that changing direction of tensile and compressive stress alternately is an effective way in improving the stretch formability of the CP2-Ti sheets. Liu et al. Reference Liu and Chou24 indicated that a larger r-value contributes to an increase in the bulge limit of the CP-Ti sheets due to a prolonged yield locus along an axis of balanced biaxial tension. Moreover, an increased r-value generally leads to a high limiting drawing ratio which will also promote an improvement in deep drawing formability. Reference Murayama, Obara and Ikeda25 Therefore, a larger r-value does benefit for the improvement in stretch formability. Besides, a lager n-value also does benefit for the improvement of formability of Ti sheet. As reported by Huang et al., Reference Huang, Suzuki, Watazu, Shigematsu and Saito26 the lager the n-value, the more strain hardening will be sustained and the deformation can be continuous much more. After rolling along CR and TDR, n-value is much higher than UDR which plays an important role to the improvement of formability of Titanium sheet.
IEs of CP2-Ti sheets processed by: (a) UDR (b) CR, (c) TDR.

B. Different speed rolling
1. Microstructure
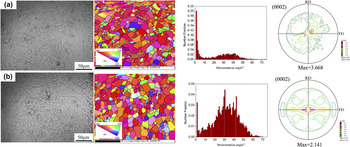
Figure 5 shows EBSD maps and misorientation distributions as well as (0002) pole figures observed by XRD of various routes different speed rolled titanium sheet. It can be seen that grains are refined greatly after cross (DSCR) and three directions (DSTDR) combining DSR. Besides, the volume fraction of low-angle boundaries increases more in DSCR specimens comparing with CR Ti sheet. After DSTDR process, the average misorientation angle is about 32° and the basal fiber texture is generated which is similar with TDR specimens.
EBSD maps and (0002) pole figures observed by XRD on various routes different speed rolled titanium sheet: (a) DSCR, (b) DSTDR.

From (0002) pole figures, as-received samples express a TD double peak texture, however, it rotates about 45° after DSCR and a fiber basal texture is generated after DSTDR process. It is reported that the fiber basal texture induced by DSR lacks thermal stability during annealing which rotates to be double peak TD texture again after annealing. Reference Huang, Suzuki and Chino11 This is consistent with the phenomenon and the reason is not clear which may be related to the recrystallization nucleation and grain growth behaviors during annealing process. Reference Huang, Suzuki, Yuasa and Chino27 However, TD tilted texture rotates to RD when the stress direction changes. The rotated orientation is benefit to the activation of prismatic slips and basal slips. While after DSTDR subsequent annealing process, the fiber basal texture is kept. And the intensity decreases much more. In previous statement, a fiber texture is always generated by a shear deformation as well as thermal activation, which is unstable during annealing. Reference Huang, Suzuki and Chino11 Except this, it can be also formed when the tensile and compressive stress changes alternately without shear deformation at a higher temperature, as shown in CR and TDR specimens. However, the fiber basal texture remaining in DSTDR specimens may be related to the complex deformation. During DSTDR process, the shear deformation is introduced. Besides, the stress changes frequently which results in the shear deformation much more homogeneous in the whole sheet. Maybe it is the reason why the fiber basal texture existed after DSTDR process. The basal fiber texture is not only related to the shear deformation and thermal activation but also strain paths.
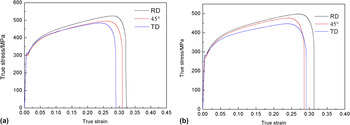
Figure 6 shows true tensile stress versus strain curves of various rolled titanium sheets at room temperature and the detailed data are summarized in Table II. It can be seen that the yield strength increases both in DSCR and DSTDR comparing with CR and TDR specimens, respectively. It may be related to the grain refinement. After DSCR and DSTDR process, the grain size is refined to 8.2 μm and 6.2 μm, respectively. Besides, grain size refinement may play a more important role than texture softening effects. According to Hall–Petch relationship,
Reference Wang, Yin, Sun, Xiao and Sun28
YS increases as well. Yield strength differences between RD and TD decreases much more from 70 MPa to 13.5 MPa and 11.7 MPa in DSCR and DSTDR specimens, respectively. While, it is 54 and 50 MPa in CR and TDR Ti sheet, which have a great drop. It means that the yield anisotropy can be reduced when a shear deformation is induced with a changed strain path. n-value increases at three directions in UDR, DSCR, and DSTDR, sequentially. Average n-values are defined as:
 $\bar n = ({n_{{\rm{RD}}}} + {n_{{\rm{TD}}}} + 2{n_{45^\circ }})/4$
. It is 0.339 and 0.355, which increases largely comparing with CR and TDR, respectively. This is related to the rotated basal texture, as stated in previous part. While, the average r-value is 3.67 and 4.29, respectively. This is mainly because the rotated texture is much more diverging which is beneficial to the activation of prismatic slips. Therefore a larger r-value is obtained, especially in DSTDR specimens with a fiber basal texture.
True tensile stress versus strain curves of various rolled titanium sheet at room temperature: (a) DSCR, (b) DSTDR.

Mechanical properties of various routes rolled titanium sheet during DSR.

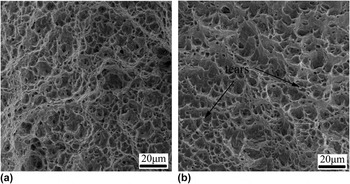
The tensile fracture surface of various routes different speed rolled titanium sheet is shown in Fig. 7. UDR specimens express a brittle fracture with some cleavage plane, as shown in Fig. 4(a). After DSCR, the cleavage plane disappears and much more dimples occur in the surface. Comparing with CR, the fraction of dimples in DSCR specimens increase largely. However, the dimples are much deeper than DSCR as well as TDR sheet. Besides, some tears appear in DSTDR specimens, as shown in Fig. 7(b). Thus, DSTDR specimens present a much better plasticity.
Overview SEM images of the tensile fracture surface of (a) DSCR, (b) DSTDR samples.

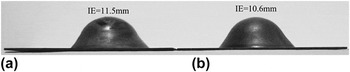
The IE of various routes different speed rolled titanium sheet are shown in Fig. 8. IE-values are improved largely in DSCR and DSTDR specimens comparing with UDR Ti sheet. The stretch formability is enhanced when shear deformation is introduced and strain path changes. The improvement of formability on titanium sheet should be related to the rotated textures. A double peak texture does not favor prism slips. However, it is beneficial to its activation when grains rotate from TD to ND or RD. From Fig. 7, (0002) basal texture rotates about 45° to RD after DSCR process while a fiber texture is generated in DSTDR specimens. Thus, the thickness deformation can be accommodated more which is beneficial to the improvement of stretch formability of titanium sheet. Besides, a larger r-value and n-value also plays an important role to the enhancement of formability.
IEs of CP2-Ti sheets processed by: (a) DSTDR (b) DSCR.

The magnitude of the planar anisotropy Δr is typically defined as:
 $\Delta r = {{{r_{{\rm{RD}}}} + {r_{{\rm{TD}}}} - 2{r_{45^\circ }}} \over 2}$
.
Reference Yi, Bohlen, Heinemann and Letzig29
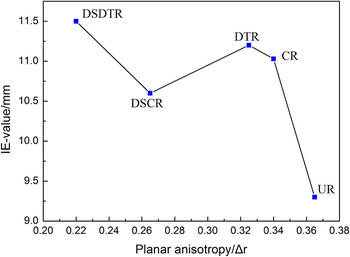
The relationships between IE-value with planar anisotropy are shown in Fig. 9. Δr decreases after various routes rolling, especially when the shear deformation is introduced. Adamus et al.
Reference Adamus and Lacki30
reported that a smaller Δr retrained the ear phenomenon which is beneficial to improve the stretch formability. However, according to Fig. 9, it can be seen that IE-value is lower in DSCR specimens comparing with CR and DTR specimens even though Δr is much smaller. This indicated that there is no clear linear relation between Δr and IE in titanium sheet.
The relationship of IE-value with planar anisotropy/Δr after various routes rolling.

IV. CONCLUSIONS
UDR, CR as well as three directional normal (TDR) and DSR are conducted at 673 K. After UDR, (0002) pole remains the TD double peak texture. The grains rotate from TD to ND and a fiber basal texture is generated after CR and TDR. Due to the rotation of grains, the prism slips are favored, r-value increases, and stretch formability is enhanced. However, the TD double peak texture remained and rotates 45° to RD in DSCR specimens while the fiber basal texture is formed in DSTDR sheet. This may happen because that the shear deformation is much more uniform when the tensile and compressive stress changes frequently. Due to the rotation of grains, IE-values improves more.
ACKNOWLEDGMENTS
This work is supported by National Natural Science Foundation of China (51504162), National Natural Science Foundation of China (51375328) and (51405500), Shanxi Province Science Foundation for Youths (2016021063), Chongqing Basic Frontier Research Program “Design, Manufacture and Performance Evolution of Light Alloy Automotive Components” (cstc2013jcyjC60001), Pre-research Foundation (9140A17040114KG01242), Fundamental Research Funds by Taiyuan University of Technology (tyut-rc201523a) and (2015QN011), and Research Project Supported by Shanxi Scholarship council of China (2015036).