





Introduction
Stereotactic body radiation therapy (SBRT) refers to a stereotactic radiotherapy procedure for treating extracranial tumours with ultrahigh doses per fraction (6–30 Gy), in a hypo-fractionated regimen of five or fewer fractions. Reference Khan and Gibbons1,Reference Benedict, Yenice and Followill2 Since the treatment involves large doses per fraction, the conformation of high doses to the target is critical to minimize normal tissue toxicity and rapid fall-off of doses away from the target. Therefore, the practice of SBRT requires a high level of accuracy in dose delivery and conformity of dose distribution. This can be achieved by integrating modern technology into all phases of the treatment process, i.e., imaging, simulation, immobilization, treatment planning and treatment delivery.
Lung cancer is one of the most common cancers and is responsible for 1 in 7 new cases of cancer. 3 Approximately 80% of lung cancer patients have NSCLC, and about 20% have an early-stage disease with the primary tumour in the lung and no nodal involvement or metastases. SBRT has emerged as an effective treatment option for medically inoperable early-stage NSCLC. SBRT treatment is designed based on the radiation therapy oncology group (RTOG) protocol which is developed by the American College of Radiology (ACR). RTOG 0813 is on seamless phase I/II study of stereotactic lung radiotherapy for early-stage, centrally located, non-small cell lung cancer in medically inoperable patients. 4 RTOG 0915 is a randomized phase II study comparing two stereotactic body radiation therapy schedules for medically inoperable patients with stage I peripheral non-small cell lung cancer.Reference Videtic, Singh and Chang 5
SBRT treatments are usually delivered by quantifying the tumour movement during normal respiration using four-dimensional CT (4DCT). Reference Underberg, Lagerwaard, Cuijpers, Slotman, Van Sörnsen De Koste and Senan6 The internal target volume (ITV) will be contoured on the maximum intensity projection (MIP) image selecting all or different phases of the respiratory cycle depending on whether patient is treated in the gated versus non-gated condition. With the gating technique, the irradiation is limited to a specific respiratory phase during which the target motions are minimal and the ITV will be generated in the MIP image generated using these selected phases.Reference Prunaretty, Boisselier and Aillères 7
The aim of this study is to compare the differences in ITV and PTV volumes between free breathing (MIP_ALL) versus gated treatments (MIP_30–70) in SBRT lung treatments. Also this study intends to analyse the difference in dosimetric parameters of planning target volume (PTV) and organ at risks (OARs) while planning SBRT treatments in free breathing versus gated treatments.
Methods and Materials
Patient selection and CT acquisition
CT images of 25 lung SBRT patients who have already completed their treatments in our centre during the period 1 January 2019 to 31 January 2022 were used for this study. All the scans were acquired using a GE Optima 580W CT scanner (GE Health Care, Chicago, IL). Wing board incorporated with a vaclok was used to immobilize the patients with their arms on the handle of the wing board to maintain setup reproducibility. All the patients were given a coaching prior to CT simulation to ensure that their breathing pattern is stable so that the same pattern will be reproduced during treatments also. Two sets of CT, a 4DCT and a planning CT, were taken for each patient. GE’s Advantage 4D software was used to bin the 4DCT images into 10 respiratory phases (bins) after reconstruction with each representing 10% of the respiratory cycle. These images were then exported to eclipse treatment planning system (TPS) V-15·0·06 (Varian Medical Systems, Palo Alto, USA) for contouring and treatment planning. The ITV and PTV were drawn on the MIP images generated from the acquired 4DCT scans and then copied to the planning CT for treatment planning. The clinical treatment plans of these patients were created for ITV delineated in MIP images (MIP_ALL) generated using all phases of the patient’s breathing cycle. For the study, SBRT plans of these patients were re-planned with ITV delineated in MIP images (MIP 30–70) generated by selecting 30–70% phases of the patient’s breathing cycle. The phase selection was done individually for each CT (patient) by observing the movement of the tumour with respiration by playing the 4DCT in the movie mode in the contouring module of the Eclipse TPS. We noticed that the 30 to 70% phase window which includes the end-expiration (exhalation) portion of the breathing cycle was the most stable and reproducible period of respiration as reported by Yang S et al. Reference Yang, Su and Liu25 PTV was generated by adding a 5 mm margin to ITV and dose to PTV, and the critical organs involved were compared based on RTOG 0915/0813 protocols (Figure 1).
ITV and PTV drawn in MIP_ALL image (A) and MIP_30–70 image (B) in axial (1), coronal (2) and sagittal (3) views for a representative patient.

Figure 1. Long description
Panel A: Cross-sectional images showing internal structures with labeled regions and contours. Panel B: Cross-sectional images showing internal structures with labeled regions and contours.
Treatment planning
Treatment planning was done in planning CT after copying the ITV and PTV drawn in respective MIP images to the planning CT. All other critical structures were contoured in the planning CT itself. The beam arrangements, planning parameters and prescription doses were kept the same for dosimetric comparison. Eclipse TPS was used for treatment planning. Multiple arcs with co-planar/non-co-planar geometry using 6FFF beams of dose rate 1400 MU/min were used for treatment delivery, and actual treatments were delivered without gating in the Varian TrueBeam Linear Accelerator equipped with 60 pairs of high-definition multi-leaf collimators (MLC). The plans were optimized using Photon Optimizer algorithm V-15·6·1 keeping the dose constraints same as for the clinical plans. Acuros XB algorithm (V-15·6·05) with grid size 1·25 mm was used for dose calculation in all plans. The plans were named as RA-MIP_ALL and RA_MIP_30–70 for the dosimetric analysis and comparison. Cumulative DVHs were used to analyse and compare the doses received by PTV and critical structures for both RA MIP_ALL plans and RA MIP_30–70 plans and the differences between the two plans were compared for its significance. Of the twenty-five patients treated, fifteen patients were planned for 48 Gy in 12 Fractions, six patients were planned for 54 Gy in 3 Fractions, and four patients were planned for 50 Gy in 5 Fractions

Dosimetric parameters evaluated for PTV
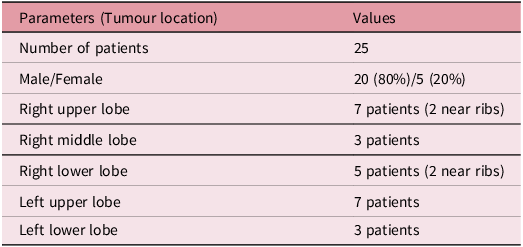
The dose parameters analysed and compared for PTV included PTV volume (VPTV), conformity index (CI), homogeneity index (HI), gradient index (GI), gradient measure (GM), mean dose to PTV (Dmean), volume of PTV receiving 100% dose (V100%), volume of PTV receiving 95% dose (V95%) in cubic centimetre (cc), dose received by 2%, 98% and 50% (D2%, D98% and D50%) in grey (Gy) were tabulated for both plans (Table 1).
Patient characteristics and tumour location in selected cases

Table 1. Long description
A table with two columns and seven rows, including a header row. The columns are labeled ‘Parameters (Tumour location)’ and ‘Values’. The table details the characteristics of 25 patients, including gender distribution and tumor locations in different lung lobes. Row 1: Number of patients, 25. Row 2: Male/Female, 20 (80 percent)/5 (20 percent). Row 3: Right upper lobe, 7 patients (2 near ribs). Row 4: Right middle lobe, 3 patients. Row 5: Right lower lobe, 5 patients (2 near ribs). Row 6: Left upper lobe, 7 patients. Row 7: Left lower lobe, 3 patients.
Percentage volume difference of PTV:
The volume of PTV (VPTV) in both MIP_ALL images and MIP_30–70 images was used to determine percentage volume difference. It is defined as follows:
 $Percentage\;Volume\;Difference = {{{{{\left( {{V_{PTV}}} \right)}_{ALL}} - {{\left( {{V_{PTV}}} \right)}_{30 - 70}}\;}}\over{{{{\left( {{V_{PTV}}} \right)}_{ALL}}}}} \times 100$
where (VPTV)ALL is volume of PTV in MIP_ALL image and (VPTV)30–70 is the volume of PTV in MIP_30–70 image.
Conformity Index (CI):
It is defined by the RTOG as the ratio between the volume covered by the prescription isodose (PIV) and the target volume designated as PTV and presented by the equation Reference Yaparpalvi, Garg and Shen8 ;
 $CI ={{{PIV}}\over{{PTV}}}$
CI equals to 1 corresponds to the ideal dose coverage or high conformity. The CI >1 indicates that irradiated volume exceeds target volume. And if CI < 1, it means that the target volume is partially irradiated. As per RTOG protocols for SBRT lung, CI of PTV should be ideally less than 1·2, irrespective of the PTV volume.
Homogeneity Index (HI):
 $HI ={{{{D_{2\% }} - {D_{98\% }}}}\over{{{D_p}}}}$
where D2% is the dose received by 2% of the target volume, D98% is the dose received by 98% of the target volume and Dp corresponds to the prescribed dose of the target. Reference Kataria, Sharma, Subramani, Karrthick and Bisht9 Ideally, HI should be zero.
R50%
RTOG recommends R50% as a measure of dose fall-off beyond the tumour. It is defined as the ratio of 50% of prescription isodose volume to the target volume (VPTV). 4,Reference Videtic, Hu and Singh10
 ${R_{50\% }} ={{{Volume\;of\;50\% \;of\;PIV}}\over{{{V_{PTV}}}}}$
The ideal values of R50% for different PTV volumes are given in RTOG 0813/0915 protocols. 4,Reference Videtic, Hu and Singh10
Gradient measure (GM):
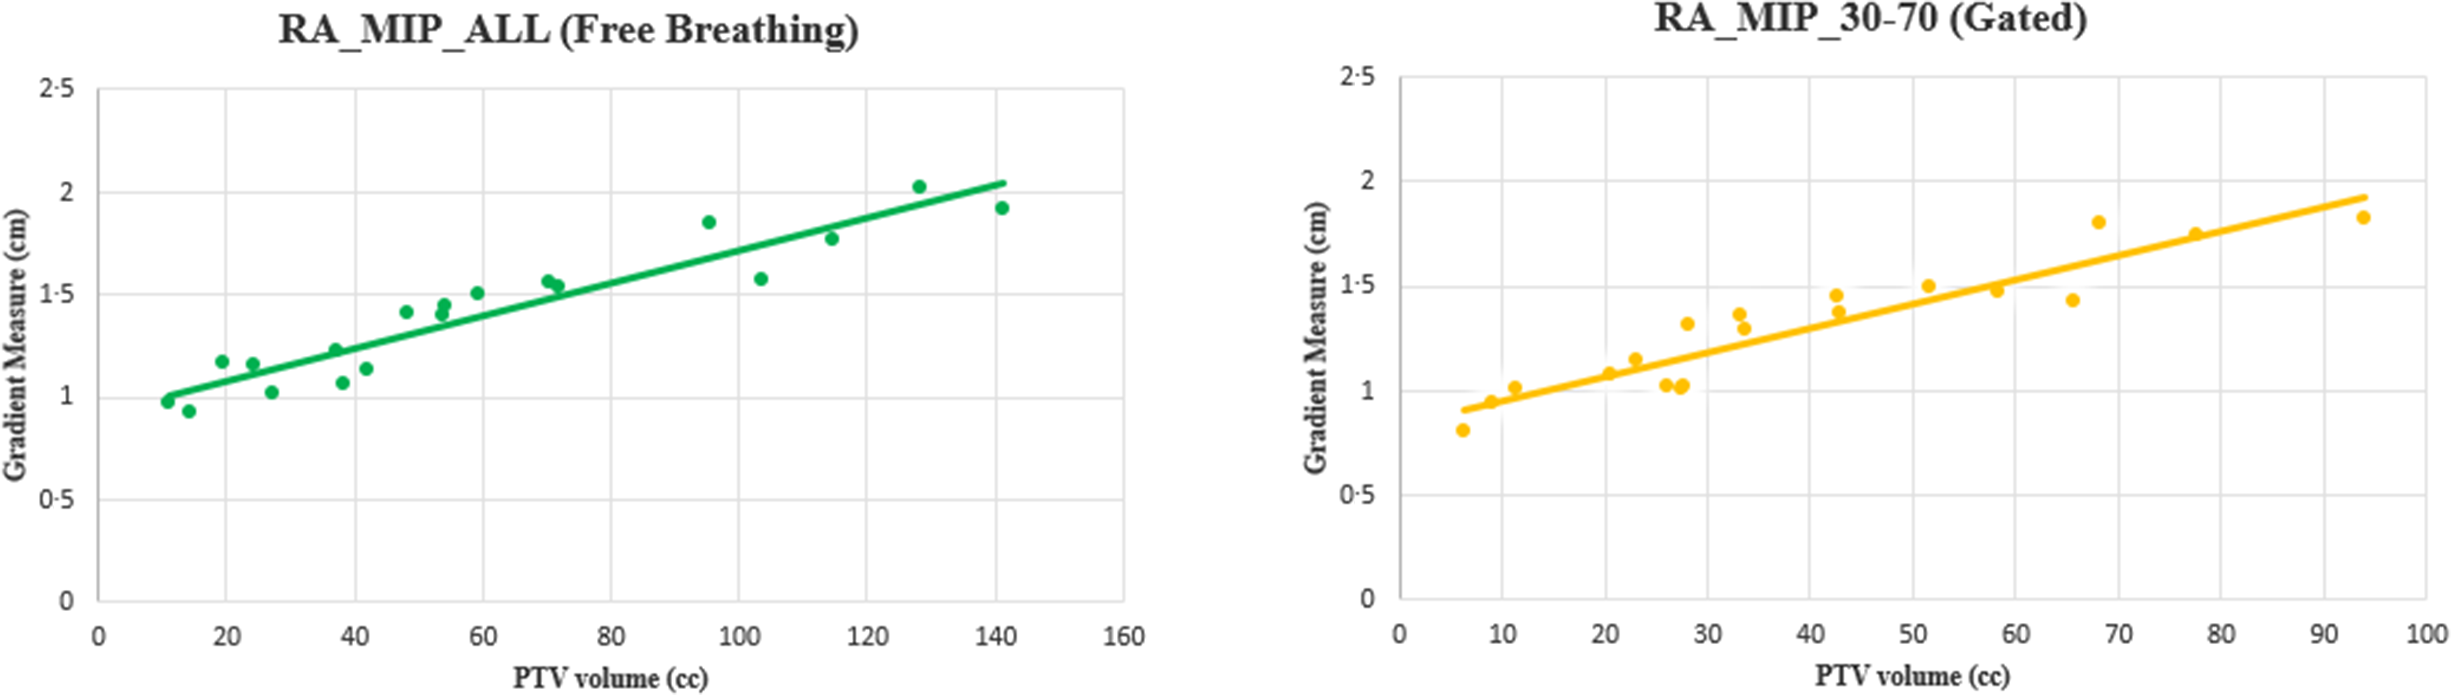
GM is defined as the difference, in centimetres, between the equivalent sphere radii of the 50 and 100% prescription isodose volume. Reference Hoffman, Dragojević, Hoisak, Hoopes and Manger11 Similar to R50%, this metric has value in assessing the high dose fall-off. Dependence of clinically achievable GM on PTV size for lung SBRT has also been established through this study. The GM values were obtained from the DVHs.
D 2cm (%):
Maximum dose (in % of dose prescribed) @ 2 cm from PTV in any direction. The ideal values of D2cm (%) for different PTV volumes are given in RTOG 0813/0915 protocols. 4,Reference Videtic, Hu and Singh10
Dosimetric parameters compared for OARs
The dose parameters analysed for the OARs included mean dose to lung (Dmean), volume of normal lung receiving 20 Gy, 10 Gy and 5 Gy (V20, V10 and V5), mean dose to oesophagus (Dmean), mean dose to heart (Dmean) and maximum dose to spine (Dmax). Dose received by 15 cc of heart (D15cc), dose received by 5 cc of oesophagus (D5cc), dose received by 1cc of spine (D1cc), dose received by 4 cc of bronchus (D4cc) and dose received by 1 cc of ribs (D1cc) were also evaluated according to RTOG. Among 25 patients, 7 patients had tumour located at the left upper lobe which included great vessels and skin as critical organs. In such cases, dose received by 10 cc of great vessels and that of skin (D10cc) were also evaluated for both plans (Figure 2).
Isodose levels showing 107% (red), 100% (green), 95% (orange) and 25% (cyan) of prescribed dose for MIP_ALL plan (A) and MIP_30–70 plan (B) with axial (1), coronal (2) and sagittal (3) views for a representative patient.

Statistical analysis
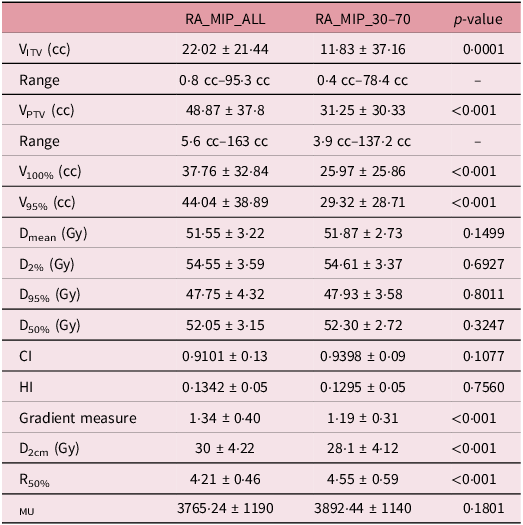
The SPSS software package (version 20·0; SPSS Inc., Chicago, IL, USA) was used to analyse the data statistically. Two-tailed paired t-test was performed to see any difference between planned doses to ITV and the critical structures for the gated versus non-gated plans. p < 0·05 was considered to be statistically significant (Table 2).
Evaluated volumes of ITV and PTV and dose parameters of PTV in RA_MIP_ALL and RA_MIP_30–70 plans

Table 2. Long description
The table compares evaluated volumes of ITV and PTV and dose parameters of PTV in RA_MIP_ALL and RA_MIP_30-70 plans. It has 12 rows and 4 columns. The columns are labeled RA_MIP_ALL, RA_MIP_30-70, and p-value. The rows are labeled with different parameters: VITV (cc), Range, VPTV (cc), Range, V100% (cc), V95% (cc), Dmean (Gy), D2% (Gy), D95% (Gy), D50% (Gy), CI, HI, Gradient measure, D2cm (Gy), R50%, and MU. Each row provides specific values for these parameters in the RA_MIP_ALL and RA_MIP_30-70 plans, along with the corresponding p-values. Notable trends include significant differences in VITV, VPTV, V100%, V95%, Gradient measure, D2cm, and R50% between the two plans, as indicated by the p-values.
Results: The ITV volume ranged from 0·8 cc–95·3 cc for RA_MIP_ALL (mean = 22·024) and 0·4 cc–78·4 cc for RA_MIP_30–70 plan (mean = 11·83). The PTV volume ranged from 5·6 cc–162·5 cc for RA_MIP_ALL (mean =4·86) and 3·9 cc–137·2 cc for RA_MIP_30–70 (mean = 31·25). The results showed a considerable difference in ITV volume (mean) and hence the PTV volume (mean) between the two plans (p-value = 0·0001). The reduction in the PTV volume was defined in terms of percentage volume difference using the formulae mentioned above. The average percentage volume difference of PTV between the two plans was found to be 34% with a standard deviation of ±15·01.
The V100% and V95% showed significant differences when plans were generated for ITV created with selected phases of breathing cycle (p-values: <0·001). A significant reduction in the PTV volume receiving 100% dose was observed when plans were generated in RA_MIP 30–70 images. There was no significant difference in the mean dose received by the PTV in both the cases (p-value: 0·1499). Similarly, the other dose parameters such as D2% (Gy), D95% (Gy) and D50% (Gy) with regard to PTV were found to have no significant difference between RA MIP_ALL plans and RA MIP_30–70 plans. The CI and HI were comparable in both the plans (CI: 0·9101 Vs 0·9398 and HI: 0·1342 Vs 0·1296). The conformity and homogeneity values were better for RA_MIP_30–70 plans compared to RA_MIP_ALL plans. Isodose distributions for both the RA_MIP_ALL and RA_MIP_30–70 plans were comparable in terms of target coverage. While mean PTV dose remained consistent between techniques (p = 0·1499), other key dosimetric parameters showed distinct trends. No significant differences were observed in D2% (Gy), D95% (Gy) and D50% (Gy) between the two groups. Gated plans (RA_MIP_30–70) showed significantly smaller absolute volumes of V100 and V95% directly reflecting the reduction in PTV size. CI and HI indices were comparable, with slightly improved values observed in gated plans (CI: 0·91 vs. 0·94; HI: 0·1342 vs. 0·1295). Overall, these findings confirm that the gated technique achieves equivalent target irradiation while utilizing a significantly smaller treatment volume.
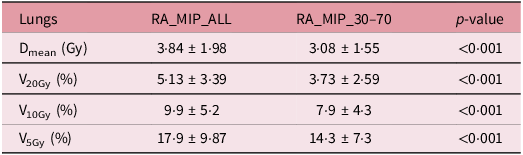
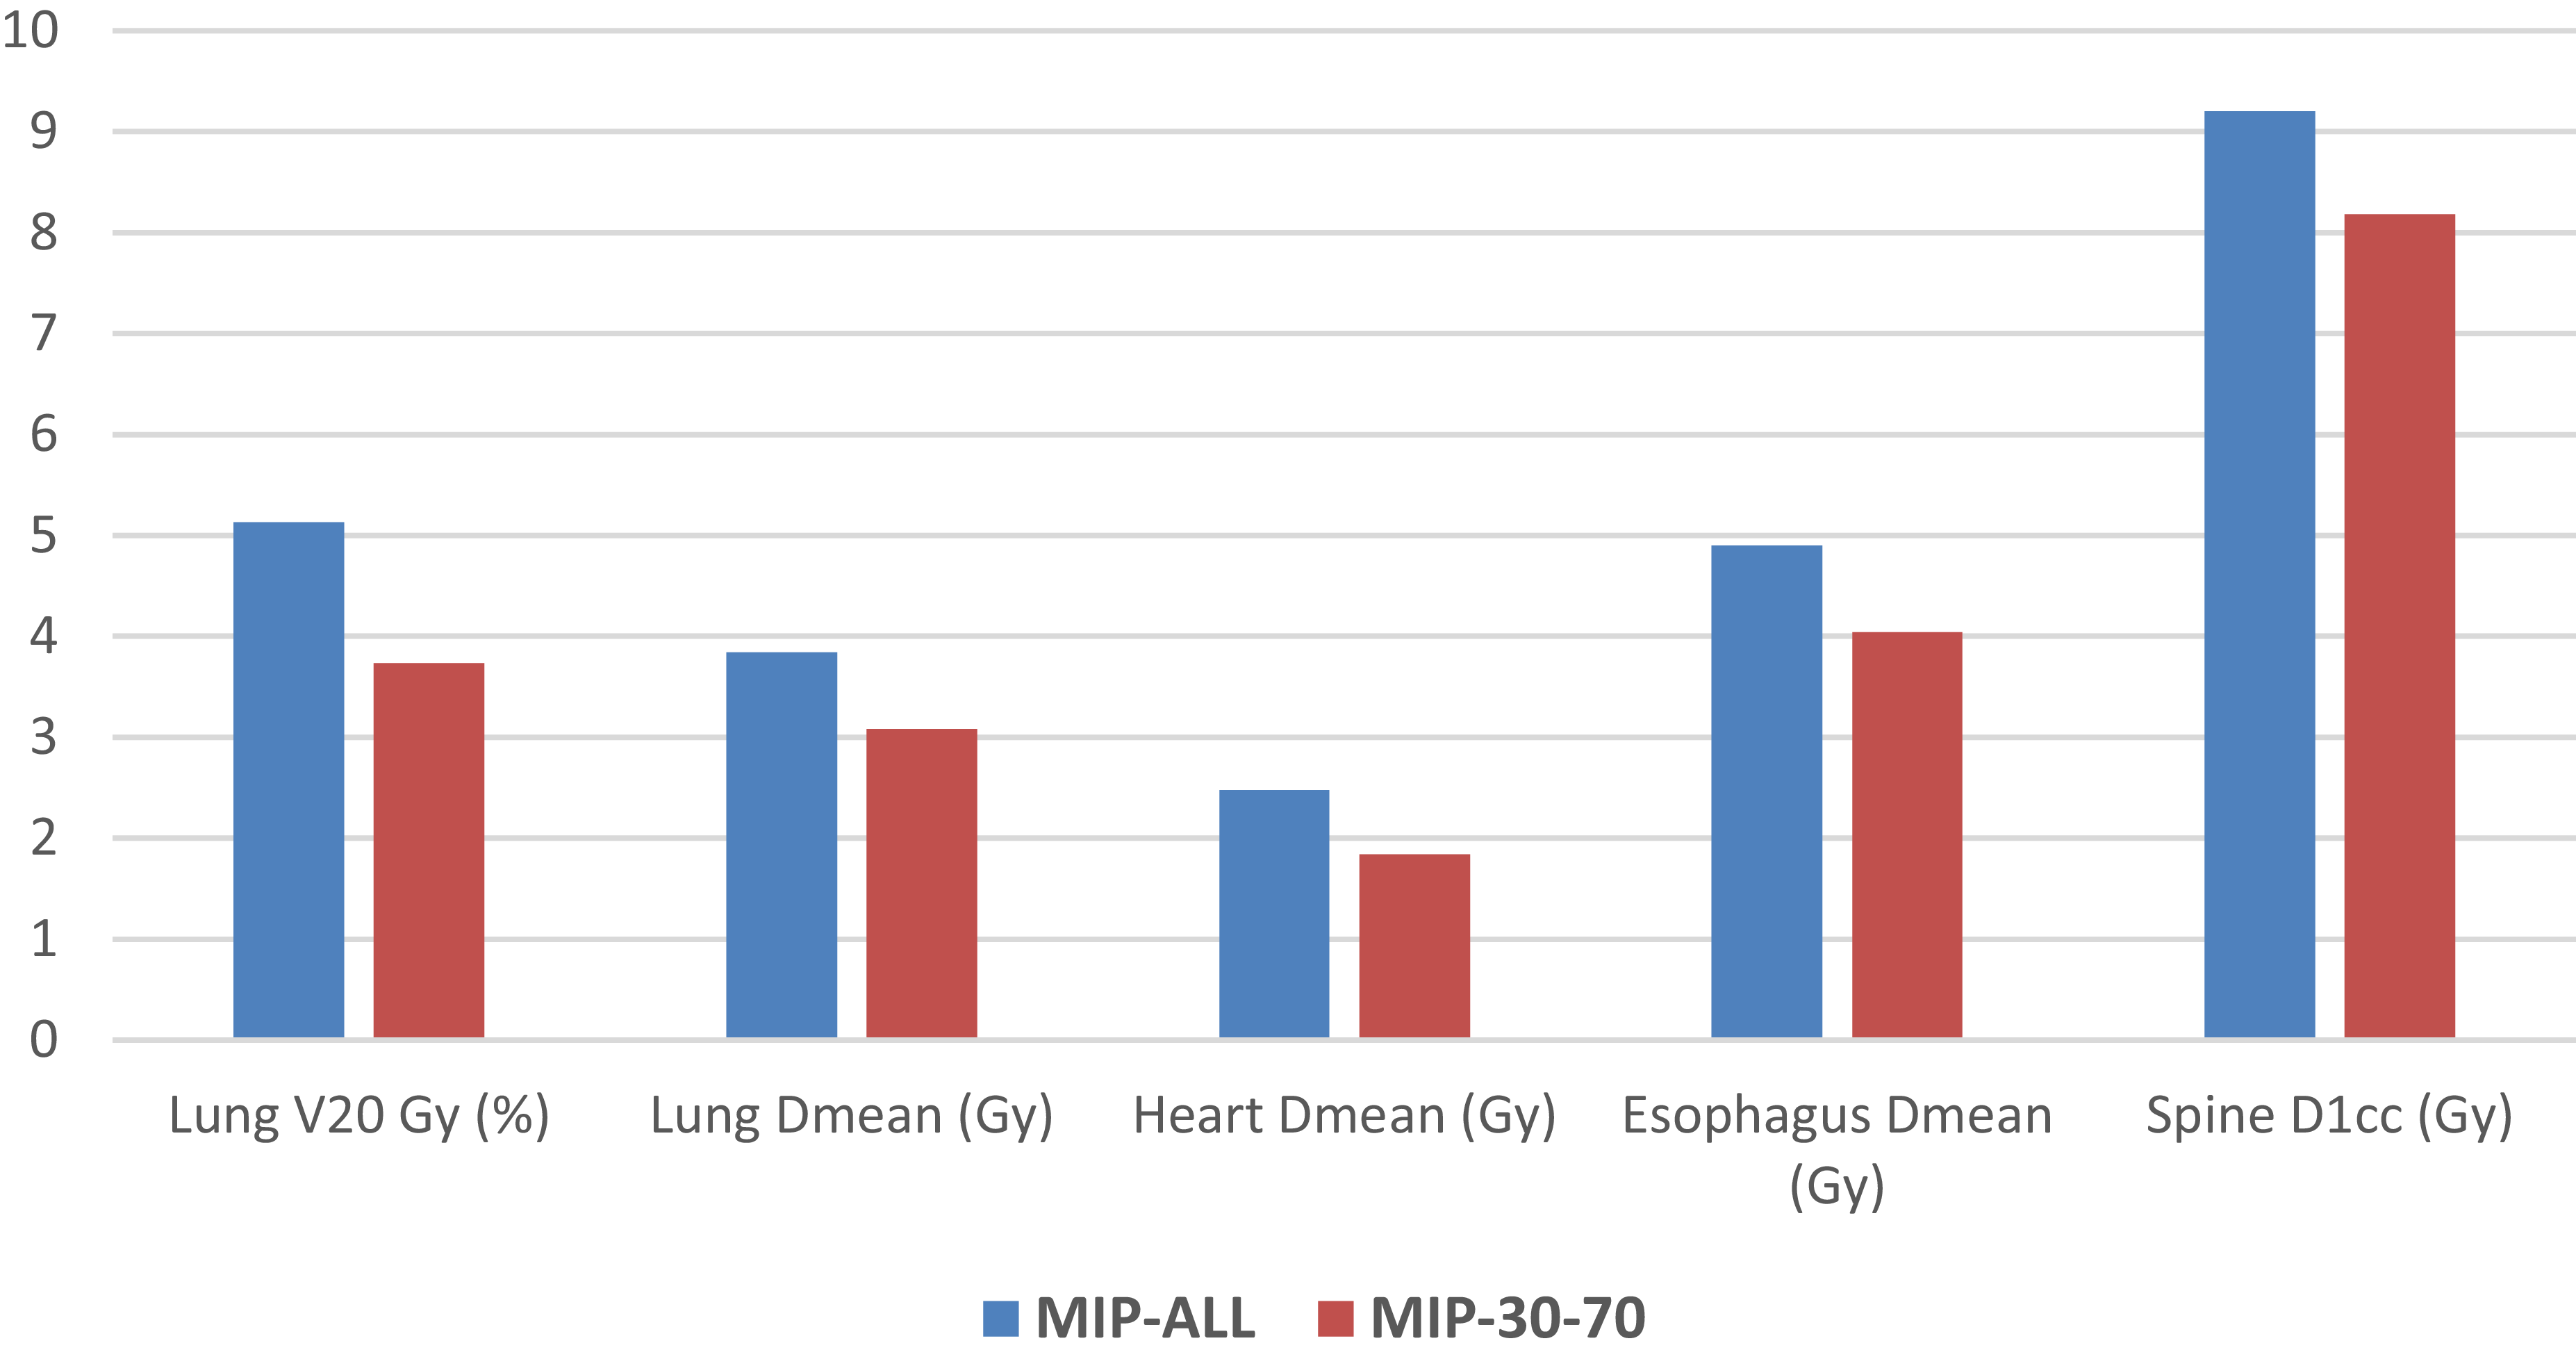
Gated plans significantly improved lung sparing across all key matrics. The mean lung dose (Dmean) was reduced by 0·75 Gy for gated technique (p-value < 0·001) with a corresponding decrease in the fractional volumes of normal lung receiving 20 Gy, 10 Gy and 5 Gy. While both techniques met the RTOG 0915 constraints (V20Gy <10%), the gated approach (RA_MIP_30–70) provided a significantly lower mean V20Gy compared to the non-gated approach (3·73 Vs 5·132%, p <0·001). Notably, the magnitude of V20Gy reduction was less pronounced in patients with upper-lobe tumours, where minimal tumour motion resulted in comparable dosimetric outcomes between both planning strategies.
The number of monitor units (MU) calculated in both plans was found to have no significant difference (mean MU in RA_MIP_ALL: 3765 ± 1190 v/s mean MU in RA_MIP_30–70: 3892 ± 1141, p-value: 0·1801).
Discussion
Several motion management techniques are used clinically for lung SBRT treatments including free-breathing gating, Reference Rao, Wu and Cao27 deep inspiration breath hold Reference Hanley, Debois and Mah28 and deep expiration breath hold. Reference Berson, Emery and Rodriquez29 In our study, we compared gated versus non-gated treatments using the free-breathing technique selecting 30–70% phase window. The core finding of this study is that phase-based gating (30–70%) significantly reduces the PTV volume by utilizing the MIP_30–70 rather than the full-motion ITV MIP_ALL. While both techniques achieved comparable target coverage, the gated approach offers a superior safety profile for healthy tissue in agreement with those reported by Prunaretty et al Reference Prunaretty, Boisselier and Aillères13 and Underberg et al. Reference Underberg, Lagerwaard, Slotman, Cuijpers and Senan14
V20Gy is a predictor of early lung toxicity or pneumonitis; the lower the V20Gy, the lower the risk. As per RTOG, its value should be less than 10%. Our data showed an absolute reduction of 0·75 Gy in MLD and 1·4% in V20Gy as the lung volume during end exhale phases is lesser than the lung volume during free-breathing cycle. Similar results were reported by Xhaferllari et al. Reference Xhaferllari, Chen, MacFarlane, Yu and Gaede19 Also, these findings align with the findings by Wu et al., who reported similar absolute differences of 0·6 Gy (MLD) and 1·2% (V20Gy) in gated plans. Reference Wu, Li, Shekhar, Suntharalingam and D’Souza16 While these numerical shifts may appear modest, they are clinically pivotal for patients with borderline pulmonary function or those with interstitial lung disease, where even marginal sparing can reduce the risk of Grade 2 radiation pneumonitis. Reference Jang, Huh, Park, Yang and Youn Cho12,Reference Baker, Han and Sarangkasiri17,Reference Barriger, Forquer and Brabham18,Reference Rouabhi, Gross, Bayouth and Xia21 In contrast to our results, the study by Kim et al. Reference Kim, Wu and Zhao20 showed an increase in dose to ribs and bronchial tree in gated technique and concluded that there was no benefit seen in gating for those OARs close to the tumour. All the cases that have been considered for this study had tumours far away from the spine. So the volume reduction in gated plan did not cause any difference in dose to spine. There were only 5 patients that were contoured with skin and great vessels. Thus, the reduction in dose to these structures in gated plans was not significant enough to have a conclusion on it.
The relationship between GM and PTV volume was found to be linear (Figure 3), in agreement with the results reported by Hoffman et al. Reference Hoffman, Dragojević, Hoisak, Hoopes and Manger15 The GM and PTV volume relationship offers lung SBRT treatment planners to evaluate GM of their plan. The results can be used prospectively during treatment planning to report GM of a plan (Table 3). R50% values were high in RA_MIP_30–70 plans (4·21 ± 0·46 Vs 4·55 ± 0·59) because of the high surface area to volume ratio of PTV as reported by Desai et al. Reference Desai, Johnson and Cordrey23
Evaluated volume and dose parameters of lungs

Table 3. Long description
The table presents evaluated volume and dose parameters of lungs across two conditions: RA_MIP_ALL and RA_MIP_30-70. It has four rows and four columns. The columns are labeled RA_MIP_ALL, RA_MIP_30-70, and p-value. The rows are labeled D_mean (Gy), V_20Gy (%), V_10Gy (%), and V_5Gy (%). Row 1: D_mean (Gy), 3.84 1.98, 3.08 1.55, <0.001. Row 2: V_20Gy (%), 5.13 3.39, 3.73 2.59, <0.001. Row 3: V_10Gy (%), 9.9 5.2, 7.9 4.3, <0.001. Row 4: V_5Gy (%), 17.9 9.87, 14.3 7.3, <0.001.
Graph between PTV and gradient measure for RA_MIP_ALL and RA_MIP_30–70 plans.

A critical consideration in lung SBRT is whether the dosimetric gain of gating justifies the clinical resources required. Tumour motion is highly dependent on anatomical location; lesions in the lower lobes near the diaphragm typically exhibit displacement >10 mm, whereas upper-lobe tumours move significantly less. Consequently, the benefit of gating is most pronounced in lower-lobe cases, where the ITV-to-PTV expansion in a non-gated plan would otherwise encompass a large volume of healthy lung. For upper-lobe tumours and tumours attached to ribs with minimal motion, the dosimetric sparing provided by gating may be negligible, and a non-gated approach may be preferable to maximize delivery efficiency. As suggested by Jang et al., Reference Jang, Huh, Park, Yang and Youn Cho12 this underscores the need for an individualized motion management strategy rather than a ‘one-size-fits-all’ approach (Figure 4).
Bar diagram showing dose to OARs in RA_MIP_30–70 plans and RA_MIP_ALL plans.

Another study highlights that gated SBRT has significantly higher dosimetric precision than non-gated SBRT, especially for smaller tumours and those in the lower lung lobes. Reference Yang, Su and Liu25 The study analysed by Underberg et al reported that respiration-gated radiotherapy can reduce the risk of pulmonary toxicity but the benefits are more evident for tumours of the middle and lower lobes. Reference Underberg, van Sörnsen de Koste, Lagerwaard, Vincent, Slotman and Senan26 Simon et al compared deep inspiration breath-hold technique and gated technique in lung treatments to evaluate the advantages of these two methods. Reference Simon, Giraud, Servois and Rosenwald24 They reported that breath-hold approach is more significant in reducing lung toxicity compared to standard approach, and the toxicity reduction was mainly due to the lung total volume increase. However, they concluded that reduction of safety margins for PTV was similar for both methods (Table 4).
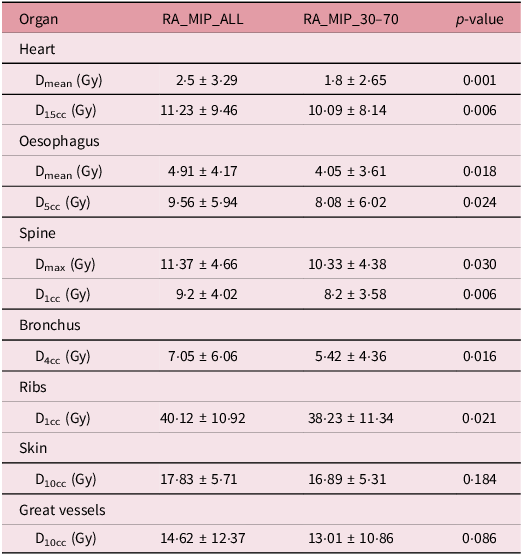
Evaluated dose parameters for other OARs

Table 4. Long description
A table comparing dose parameters for various organs. The table has 8 rows and 4 columns. The columns are labeled RA_MIP_ALL, RA_MIP_30_70, and p-value. The rows are labeled with different organs and dose parameters. Row 1: Heart, D mean (Gy), 2.5-5 3.29, 1.8-2 2.65, 0.001. Row 2: Heart, D 15 cc (Gy), 11.23 9.46, 10.09 8.14, 0.006. Row 3: Oesophagus, D mean (Gy), 4.91 4.17, 4.05 3.61, 0.018. Row 4: Oesophagus, D 5 cc (Gy), 9.56 5.94, 8.08 6.02, 0.024. Row 5: Spine, D max (Gy), 11.37 4.66, 10.33 4.38, 0.030. Row 6: Spine, D 1 cc (Gy), 9.2 4.02, 8.2 3.58, 0.006. Row 7: Bronchus, D 4 cc (Gy), 7.05 6.06, 5.42 4.36, 0.016. Row 8: Ribs, D 1 cc (Gy), 40.12 10.92, 38.23 11.34, 0.021. Row 9: Skin, D 10 cc (Gy), 17.83 5.71, 16.89 5.31, 0.184. Row 10: Great vessels, D 10 cc (Gy), 14.62 12.37, 13.01 10.86, 0.086.
In this study, gated treatments increased the total treatment time of the patient by 60% since the monitor units were utilized in only 40% of the duty cycle of the respiratory cycle. The treatment time for the gated technique was found to be 2.5 times more compared to that of non-gated technique. Similar results were reported by Xhaferllari et al and Fox et al. Reference Xhaferllari, Chen, MacFarlane, Yu and Gaede19,Reference Fox, Simon, Elder, Riffenburgh and Johnstone22 However, faster delivery techniques such as VMAT and FFF beams of higher dose rates could reduce gated treatment times considerably. Longer sessions increase the likelihood of patient fatigue and involuntary movement. Hence, the use of 4D-CBCT and potential integration of surface-guided radiation therapy (SGRT) are essential for verifying that the breathing pattern remains consistent with the planning 4D-CT. This study has limitations common to retrospective, single-centre analyses. Additionally, planning was performed on a static average CT even though contouring utilized MIP images from the 4DCT images; therefore, the ‘dose blurring’ effect and the interplay between the leaf motion and tumour motion were not explicitly modelled. Future prospective studies utilizing 4D dose accumulation and larger, multi-centre cohorts are needed to confirm the long-term clinical outcomes of these dosimetric advantages.
Conclusion
Phase selection in 4DCT for lung SBRT treatments allows for a significant reduction in ITV and PTV volume, while maintaining similar PTV coverage, and lower doses to critical organs. Gated treatments become more relevant for patients with large respiratory motion, tumours in the lower lobes and tumours close to critical structures. The linear relationship identified between GM and PTV volume provides a valuable prospective tool for SBRT treatment planning. Longer treatment times in gated treatments necessitate the need for faster delivery methods and advanced imaging techniques. Ultimately, our findings suggest an individualized motion management strategy for patients based on the anatomical location of tumours and the respiratory pattern. While respiratory gating offers clear dosimetric benefits for lower-lobe tumours, these must be weighed against treatment efficiency. The integration of advanced technologies, such as FFF beams and SGRT, can help maintain clinical precision without compromising throughput.
Financial support
This study did not receive any specific granting from funding agencies in the public, commercial or for not-for-profit sectors.
Competing interests
The authors declare no conflicts of interest.



 Open access

