1 Introduction
The phenomenon of vortex-induced vibration (VIV) is ubiquitous and is relevant to various applications in offshore, underwater, automobile, aerospace and wind engineering. The relatively large motion and the mean drag force due to the VIV phenomenon can be hazardous and cause severe damage to a submerged structure (Bearman Reference Bearman2011). During the VIV phenomenon, the frequency of vortex shedding locks onto the oscillation frequency of the body, which is termed ‘lock-in’. The lock-in is a self-excited process, which is identified with the equivalence of the frequency of vortex shedding and the oscillation frequency of the body (Khalak & Williamson Reference Khalak and Williamson1999; Yao & Jaiman Reference Yao and Jaiman2017b).
1.1 Control of vortex-induced vibration
Control of VIV is of paramount importance to many engineering applications and poses a great deal of physical complexity due to the richness of vorticity dynamics and the coupled fluid–structure interaction. Control can be achieved by using active feedback control techniques, such as blowing and suction, or passive techniques. As described in Blevins & Scanlan (Reference Blevins and Scanlan1977), passive techniques can be generally categorized into four groups, which are avoiding resonance, streamlining the cross-section, increasing damping, and adding a vortex suppression device. A systematic understanding of the VIV suppression can facilitate more effective design of control devices.
Until now, experimental and numerical methods have been the most popular and rigorous approaches to understand the frequency lock-in and VIV phenomenon. These studies have primarily explored the effects of mass ratio, Reynolds number and structural damping on the lock-in regime. For this purpose, the flow past a single elastically mounted cylinder has served as a generic VIV model for both numerical and experimental investigations. As a next step in the fundamental analysis of the VIV physics of a single cylinder, investigations based on the full-order model (FOM) for multiple cylinders (Liu & Jaiman Reference Liu and Jaiman2016; Mysa, Kaboudian & Jaiman Reference Mysa, Kaboudian and Jaiman2016) and suppression devices (Law & Jaiman Reference Law and Jaiman2017) have recently been reported in the literature. Appendages such as fairings, helical strakes, splitter plates and control cylinders are generally considered as vortex suppression devices. Neutrally buoyant fairing devices are found to be effective in minimizing VIV by preventing the interaction of shear layers with the near wake and extending the shear layers further downstream to avoid alternate periodic vortex shedding. Recently, a novel device termed as a ‘connected-C’ has been designed by Law & Jaiman (Reference Law and Jaiman2017) based on the principle of shear layer reattachment, which was demonstrated to have a similar performance to a conventional fairing. The primary challenges concerning the adaptation of suppression devices are optimal placement and geometric variations.
Several experimental and numerical techniques have been used for optimal design and placement of suppression devices. Baarholm et al. (Reference Baarholm, Skaugset, Lie and Braaten2015) carried out experimental investigations on various designs of fairings and found the short-crab-claw configuration to be effective and robust in both VIV suppression and reduction of drag force. The experimental study conducted by Allen et al. (Reference Allen, Lee and Henning2008) showed that, while helical strakes suffered from higher drag force, fairings reduced the drag force significantly. Kim & Chang (Reference Kim and Chang1995) and Mittal & Raghuvanshi (Reference Mittal and Raghuvanshi2001) performed direct numerical simulations to find a suitable optimal position for a control cylinder to be placed in the wake of the main cylinder that resulted in the suppression of vortex shedding. A systematic theoretical analysis has been developed for the same problem by Marquet, Sipp & Jacquin (Reference Marquet, Sipp and Jacquin2008). Recently, shape optimization of fairings has been undertaken by integrating computational fluid dynamics with a genetic algorithm to obtain a high-performance riser fairing and by parametrizing the riser profile via Bézier curves (Chen et al. Reference Chen, Liu, Liu and Lou2018). The control points were chosen as design variables and the lift coefficient was selected as the objective function to obtain the optimum fairing profile.
High-fidelity full-order simulations provide detailed physical insight and quantitative information such as force trends, vorticity distribution, flow patterns, frequency characteristics and phase relations. Despite these benefits of the full-order analysis, when it comes to the development of control strategy and parametric optimization, the cost associated with full-order modelling is exceptionally high even with the current state-of-the-art supercomputers. Owing to the complexity of flow–structure interaction (FSI) problems, these direct experimental and numerical investigations also pose difficulty in addressing the underlying physical mechanisms of the frequency lock-in during VIV.
1.2 Stability analysis via model reduction
In the context of these limitations of the detailed full-order analysis, model order reduction (dimensionality reduction) serves as an attractive alternative to address the aforementioned shortcomings. Specifically, to address the problem of developing effective control strategies, a stability analysis is required via an efficient model reduction process. The important first step in this approach is to obtain a reduced-order model (ROM) of the original nonlinear system. There are generally two main approaches to obtain a ROM. The first one uses the Galerkin projection of the full-order system onto a small subspace spanned by mode vectors. Proper orthogonal decomposition (POD), balanced truncation and dynamic mode decomposition (DMD) are some of the methods by which the mode vector can be obtained. A comprehensive review of various model reduction techniques is presented in Rowley & Dawson (Reference Rowley and Dawson2017) and Taira et al. (Reference Taira, Brunton, Dawson, Rowley, Colonius, McKeon, Schmidt, Gordeyev, Theofilis and Ukeiley2017).
The second approach is a purely data-driven model, which is widely used in the system identification community. This data-driven approach deals only with input–output data while considering the original system to be a black-box model for generating datasets. A dynamical relationship between input and output data is realized in a state-space formulation to construct a ROM. The eigensystem realization algorithm (ERA) is a system identification approach (Juang & Pappa Reference Juang and Pappa1985) that can be employed to construct a minimal realization of the system that tracks the evolution of system output when subjected to an impulsive input. Mathematically equivalent to the balanced POD (Ma, Ahuja & Rowley Reference Ma, Ahuja and Rowley2011), the ROM resulting from the ERA is a linear projection of the original system on the set of modes possessing the most observable and controllable flow structures. Recently, the ERA-based ROM has been used for stability analysis and flow control problems by the fluid mechanics community in various instances (Ma et al. Reference Ma, Ahuja and Rowley2011; Flinois, Morgans & Schmid Reference Flinois, Morgans and Schmid2015; Flinois & Morgans Reference Flinois and Morgans2016; Yao & Jaiman Reference Yao and Jaiman2017a). The work presented by Yao & Jaiman (Reference Yao and Jaiman2017b) attempts to construct a unified description of frequency lock-in for elastically mounted cylinders. The ERA-based ROM technique was used to extract generalized stability properties of the fluid–structure system of two-dimensional bluff bodies. The effects of Reynolds number and mass ratio and also the geometry of the bluff body were analysed by performing the stability analysis of a coupled system. A unified phase diagram to characterize the effects of geometry on the VIV stability regimes was discovered.
1.3 Contribution and organization
The novelty of the work presented in this paper lies in the ability to understand the mechanism behind the passive suppression of VIV using a data-driven stability analysis via the ERA-based ROM. To the best of the authors’ knowledge, the stability analysis of passive suppression devices has not been explored in the literature. The modal analysis of cylinder–appendage systems via POD is another novel aspect of the present work. In particular, the contributions of the present work are driven by the following research questions: (i) What are the salient differences in the stability characteristics of a freely vibrating plain cylinder when compared to the cylinder–appendage system? (ii) What is the essential ingredient that characterizes the suppression of VIV via passive means? (iii) How do the wake features interact in the presence of suppression devices? (iv) How do the wake mode (WM) and structure mode (SM) predicted by the stability analysis behave in conjunction with the interaction of wake features? In addition to addressing the above fundamental research questions, a novel stability function is introduced which is of practical importance. To answer the aforementioned research questions, three representative appendage configurations, namely fairing, connected-C and splitter plate, are considered in the present study. The stability analysis via an ERA-based ROM will be carried out on the above cylinder–appendage configurations and a detailed comparison with a plain cylinder will be presented. FOM results will also be reported to corroborate the findings from the stability analysis via the ERA-based ROM. Modal decomposition of the wake features through the POD technique is carried out in addition to the stability analysis to gain a detailed physical insight into the fundamental suppression mechanism.
The article is organized as follows. Section 2 deals with the numerical methodology, detailing the FOM formulation and model reduction technique for the coupled FSI system. Section 3 presents the problem set-up and the numerical verification of the ERA-based ROM on the laminar wake behind a cylinder–fairing system. Section 4 discusses the results of stability analysis, the modal decomposition and the effect of other appendages and characteristic dimension. Concluding remarks are presented in the final section.
2 Numerical methodology
This section deals with the numerical formulations used for the high-dimensional FOM followed by the implementation of ERA to develop the ROM model for the coupled FSI problem. The numerical methodology presented in this section follows closely that outlined in Yao & Jaiman (Reference Yao and Jaiman2017b).
2.1 Full-order model formulation
In the present work, a numerical scheme employing the Petrov–Galerkin finite element method and semi-discrete time stepping is adopted (Jaiman, Guan & Miyanawala Reference Jaiman, Guan and Miyanawala2016a; Jaiman, Pillalamarri & Guan Reference Jaiman, Pillalamarri and Guan2016b). The incompressible Navier–Stokes equations are used in the arbitrary Lagrangian–Eulerian (ALE) reference frame and formulated in the following form:
 $$\begin{eqnarray}\displaystyle & \displaystyle \unicode[STIX]{x1D70C}^{f}\left(\frac{\unicode[STIX]{x2202}\boldsymbol{u}^{f}}{\unicode[STIX]{x2202}t}\bigg|_{\widehat{x}}+\left(\boldsymbol{u}^{f}-\boldsymbol{w}\right)\boldsymbol{\cdot }\unicode[STIX]{x1D735}\boldsymbol{u}^{f}\right)=\unicode[STIX]{x1D735}\boldsymbol{\cdot }\unicode[STIX]{x1D748}^{f}+\boldsymbol{b}^{f}\quad \text{on}~\unicode[STIX]{x1D6FA}^{f}(t), & \displaystyle\end{eqnarray}$$
 $$\begin{eqnarray}\displaystyle & \displaystyle \unicode[STIX]{x1D735}\boldsymbol{\cdot }\boldsymbol{u}^{f}=0\quad \text{on}~\unicode[STIX]{x1D6FA}^{f}(t), & \displaystyle\end{eqnarray}$$
where  $\boldsymbol{u}^{f}=\boldsymbol{u}^{f}(\boldsymbol{x},t)$ and
 $\boldsymbol{w}=\boldsymbol{w}(\boldsymbol{x},t)$ are the fluid and mesh velocities, respectively. In (2.1) the partial time derivative with respect to the ALE referential coordinate
 $\widehat{x}$ is constant. Here
 $\boldsymbol{b}^{f}$ represents the body force per unit mass and
 $\unicode[STIX]{x1D748}^{f}$ is the Cauchy stress tensor for a Newtonian fluid, which is defined as
 $$\begin{eqnarray}\unicode[STIX]{x1D748}^{f}=-p\unicode[STIX]{x1D644}+\unicode[STIX]{x1D707}^{f}\left(\unicode[STIX]{x1D735}\boldsymbol{u}^{f}+(\unicode[STIX]{x1D735}\boldsymbol{u}^{f})^{\text{T}}\right),\end{eqnarray}$$
where  $p$,
 $\unicode[STIX]{x1D707}^{f}$ and
 $\unicode[STIX]{x1D644}$ are the hydrodynamic pressure, the dynamic viscosity of the fluid and the identity tensor, respectively. A rigid-body structure submerged in the fluid experiences unsteady fluid forces and consequently may undergo flow-induced vibrations if the body is mounted elastically. To simulate the translational motion of a rigid body about its centre of mass, the equation along the Cartesian axes is given by
 $$\begin{eqnarray}\boldsymbol{m}\boldsymbol{\cdot }\frac{\unicode[STIX]{x2202}\boldsymbol{u}^{s}}{\unicode[STIX]{x2202}t}+\boldsymbol{c}\boldsymbol{\cdot }\boldsymbol{u}^{s}+\boldsymbol{k}\boldsymbol{\cdot }\left(\unicode[STIX]{x1D753}^{s}(\boldsymbol{z}_{0},t)-\boldsymbol{z}_{0}\right)=\boldsymbol{F}^{s}+\boldsymbol{b}^{s}\quad \text{on }\unicode[STIX]{x1D6FA}^{s},\end{eqnarray}$$
where  $\boldsymbol{m}$,
 $\boldsymbol{c}$,
 $\boldsymbol{k}$,
 $\boldsymbol{F}^{s}$ and
 $\boldsymbol{b}^{s}$ are the mass, damping coefficient and stiffness coefficient vectors for the translational motions, the fluid traction and the body forces on the rigid body, respectively. Here
 $\unicode[STIX]{x1D6FA}^{s}$ represents the domain occupied by the rigid body and
 $\boldsymbol{u}^{s}(t)$ represents the velocity of the immersed rigid body. The fluid and the structural equations are coupled by the continuity of velocity and traction along the fluid–structure interface.
The new position of the rigid body is updated through a position vector  $\unicode[STIX]{x1D753}^{s}$, which maps the initial position
 $\boldsymbol{z}_{0}$ of the rigid body to its new position at time
 $t$. Let
 $\unicode[STIX]{x1D6FE}$ be the Lagrangian point on
 $\unicode[STIX]{x1D6E4}$, and its corresponding mapping position vector to the new position after the motion of the rigid body is
 $\unicode[STIX]{x1D719}(\unicode[STIX]{x1D6FE},t)$ at time
 $t$. Since the position and flow field around the moving rigid body are updated continuously, the no-slip and traction continuity conditions should be satisfied on the fluid–body interface
 $\unicode[STIX]{x1D6E4}$:
 $$\begin{eqnarray}\displaystyle & \displaystyle \boldsymbol{u}^{f}(\unicode[STIX]{x1D753}^{s}(\boldsymbol{z}_{0},t),t)=\boldsymbol{u}^{s}(\boldsymbol{z}_{0},t), & \displaystyle\end{eqnarray}$$
 $$\begin{eqnarray}\displaystyle & \displaystyle \int _{\unicode[STIX]{x1D719}(\unicode[STIX]{x1D6FE},t)}\unicode[STIX]{x1D748}^{f}(\boldsymbol{x},t)\boldsymbol{\cdot }\boldsymbol{n}\,\text{d}\unicode[STIX]{x1D6E4}+\int _{\unicode[STIX]{x1D6FE}}\boldsymbol{F}^{s}\,\text{d}\unicode[STIX]{x1D6E4}=0\quad \forall ~\unicode[STIX]{x1D6FE}\in \unicode[STIX]{x1D6E4}, & \displaystyle\end{eqnarray}$$
where  $\boldsymbol{n}$ is the outer normal to the fluid–body interface. The characterization of the moving fluid–body interface is constructed by means of the ALE technique (Donea Reference Donea1983). The movement of the internal ALE nodes is constructed by solving a continuum hyperelastic model for the fluid mesh such that the mesh quality does not deteriorate as the displacement of the body increases. For the spatial and material mapping problem, we use classical neo-Hookean material properties for the ALE variational formulation (Kuhl, Askes & Steinmann Reference Kuhl, Askes and Steinmann2004), which does not entail any additional user-defined re-meshing parameter. The weak variational form of (2.1) is discretized in space using
 $\mathbb{P}_{2}/\mathbb{P}_{1}$ isoparametric finite elements for the fluid velocity and pressure. The second-order backward-differencing scheme is used for the time discretization of the Navier–Stokes system (Liu, Jaiman & Gurugubelli Reference Liu, Jaiman and Gurugubelli2014). A partitioned staggered scheme is considered for the full-order simulations of fluid–structure interaction (Jaiman et al. Reference Jaiman, Geubelle, Loth and Jiao2011). The above coupled variational formulation completes the presentation of the FOM for high-fidelity simulation. The employed in-house FSI solver has been extensively validated in Liu & Jaiman (Reference Liu and Jaiman2016) and Mysa et al. (Reference Mysa, Kaboudian and Jaiman2016).
2.2 Model reduction via the eigensystem realization algorithm
The basic premise of the ROM is to represent the high-dimensional nonlinear dynamics governed by the Navier–Stokes equation via a low-dimensional model. We consider this model to be invariant in time and with multiple inputs and multiple outputs. It can be represented in the state-space form at discrete time as
 $$\begin{eqnarray}\left.\begin{array}{@{}c@{}}\boldsymbol{X}(k+1)=\unicode[STIX]{x1D63C}\boldsymbol{X}(k)+\unicode[STIX]{x1D63D}\boldsymbol{U}(k),\\ \boldsymbol{Y}(k)=\unicode[STIX]{x1D63E}\boldsymbol{X}(k)+\unicode[STIX]{x1D63F}\boldsymbol{U}(k),\end{array}\right\}\end{eqnarray}$$
where  $\boldsymbol{X}$ is an
 $n$-dimensional state vector,
 $\boldsymbol{U}$ denotes a
 $q$-dimensional input vector and
 $\boldsymbol{Y}$ is a
 $p$-dimensional output vector. The integer
 $k$ is the sample indicator in a discrete time setting with a specified sampling period. The matrix
 $\unicode[STIX]{x1D63C}$ characterizes the dynamics of the system. The problem of identifying the system matrices
 $(\unicode[STIX]{x1D63C},\unicode[STIX]{x1D63D},\unicode[STIX]{x1D63E},\unicode[STIX]{x1D63F})$ is part of the ERA. For any given impulse response
 $\boldsymbol{Y}$, the ERA realizes the system by constructing the system matrices such that the response
 $\boldsymbol{Y}$ is reproduced by the state-variable equations. The algorithm consists of the following main steps:
(i) Record the impulse response of the system using numerical solvers or experiments for a finite time horizon. The length of this impulse response should be sufficient to capture the linear dynamics of the system. Upon appropriate scaling to unit impulse, the response will be in the following form:
(2.8)where $$\begin{eqnarray}\left(\unicode[STIX]{x1D63E}\unicode[STIX]{x1D63D},\;\unicode[STIX]{x1D63E}\unicode[STIX]{x1D63C}\unicode[STIX]{x1D63D},\;\unicode[STIX]{x1D63E}\unicode[STIX]{x1D63C}^{2}\unicode[STIX]{x1D63D},\ldots ,\;\unicode[STIX]{x1D63E}\unicode[STIX]{x1D63C}^{L_{i}-1}\unicode[STIX]{x1D63D}\;\right),\end{eqnarray}$$$L_{i}$ is the length of the impulse response and the terms $\unicode[STIX]{x1D63E}\unicode[STIX]{x1D63C}^{k}\unicode[STIX]{x1D63D}$ are generally referred to as Markov parameters of the system.
(ii) Construct a generalized Hankel matrix
$\unicode[STIX]{x1D643}$ of size $(r+1,s+1)$: (2.9)$$\begin{eqnarray}\unicode[STIX]{x1D643}=\left[\begin{array}{@{}cccc@{}}\unicode[STIX]{x1D63E}\unicode[STIX]{x1D63D} & \unicode[STIX]{x1D63E}\unicode[STIX]{x1D63C}\unicode[STIX]{x1D63D} & \ldots & \unicode[STIX]{x1D63E}\unicode[STIX]{x1D63C}^{s-1}\unicode[STIX]{x1D63D}\\ \unicode[STIX]{x1D63E}\unicode[STIX]{x1D63C}\unicode[STIX]{x1D63D} & \unicode[STIX]{x1D63E}\unicode[STIX]{x1D63C}^{2}\unicode[STIX]{x1D63D} & \ldots & \unicode[STIX]{x1D63E}\unicode[STIX]{x1D63C}^{s}\unicode[STIX]{x1D63D}\\ \vdots & \vdots & \ddots & \vdots \\ \unicode[STIX]{x1D63E}\unicode[STIX]{x1D63C}^{r-1}\unicode[STIX]{x1D63D} & \unicode[STIX]{x1D63E}\unicode[STIX]{x1D63C}^{r}\unicode[STIX]{x1D63D} & \ldots & \unicode[STIX]{x1D63E}\unicode[STIX]{x1D63C}^{r+s}\unicode[STIX]{x1D63D}\end{array}\right].\end{eqnarray}$$(iii) Compute the singular value decomposition (SVD) of
$\unicode[STIX]{x1D643}$: (2.10)where the diagonal matrix$$\begin{eqnarray}\unicode[STIX]{x1D643}=\boldsymbol{ U}\unicode[STIX]{x1D72E}\boldsymbol{ V}^{\ast }=\left[\boldsymbol{U}_{1}\quad \boldsymbol{U}_{2}\right]\left[\begin{array}{@{}cc@{}}\unicode[STIX]{x1D72E}_{1} & 0\\ 0 & \unicode[STIX]{x1D72E}_{2}\end{array}\right]\left[\begin{array}{@{}c@{}}\boldsymbol{V}_{1}^{\ast }\\ \boldsymbol{ V}_{2}^{\ast }\end{array}\right]\approx \boldsymbol{U}_{1}\unicode[STIX]{x1D72E}_{1}\boldsymbol{V}_{1}^{\ast },\end{eqnarray}$$$\unicode[STIX]{x1D72E}$ is invertible and contains the Hankel singular values (HSVs). The block matrix $\unicode[STIX]{x1D72E}_{2}$ contains elements with negligible values and therefore it can be truncated to estimate $\unicode[STIX]{x1D643}\approx \boldsymbol{U}_{1}\unicode[STIX]{x1D72E}_{1}\boldsymbol{V}_{1}^{\ast }$.(iv) The reduced system matrices
$(\unicode[STIX]{x1D63C}_{r},\unicode[STIX]{x1D63D}_{r},\unicode[STIX]{x1D63E}_{r},\unicode[STIX]{x1D63F}_{r})$ are calculated as: (2.11)where$$\begin{eqnarray}\left.\begin{array}{@{}c@{}}\unicode[STIX]{x1D63C}_{r}=\unicode[STIX]{x1D72E}_{1}^{-1/2}\boldsymbol{U}_{1}^{\ast }\unicode[STIX]{x1D643}^{\prime }\boldsymbol{V}_{1}\unicode[STIX]{x1D72E}_{1}^{-1/2},\\ \unicode[STIX]{x1D63D}_{r}=\unicode[STIX]{x1D72E}_{1}^{1/2}\boldsymbol{V}_{1}^{\ast }\boldsymbol{E}_{m},\\ \unicode[STIX]{x1D63E}_{r}=\boldsymbol{E}_{t}^{\ast }\boldsymbol{U}_{1}\unicode[STIX]{x1D72E}_{1}^{1/2},\\ \unicode[STIX]{x1D63F}_{r}=\boldsymbol{Y}(1),\end{array}\right\}\end{eqnarray}$$(2.12)with$$\begin{eqnarray}\unicode[STIX]{x1D643}^{\prime }=\left[\begin{array}{@{}cccc@{}}\unicode[STIX]{x1D63E}\unicode[STIX]{x1D63C}\unicode[STIX]{x1D63D} & \unicode[STIX]{x1D63E}\unicode[STIX]{x1D63C}^{1}\unicode[STIX]{x1D63D} & \ldots & \unicode[STIX]{x1D63E}\unicode[STIX]{x1D63C}^{s}\unicode[STIX]{x1D63D}\\ \unicode[STIX]{x1D63E}\unicode[STIX]{x1D63C}^{2}\unicode[STIX]{x1D63D} & \unicode[STIX]{x1D63E}\unicode[STIX]{x1D63C}^{3}\unicode[STIX]{x1D63D} & \ldots & \unicode[STIX]{x1D63E}\unicode[STIX]{x1D63C}^{s+1}\unicode[STIX]{x1D63D}\\ \vdots & \vdots & \ddots & \vdots \\ \unicode[STIX]{x1D63E}\unicode[STIX]{x1D63C}^{r}\unicode[STIX]{x1D63D} & \unicode[STIX]{x1D63E}\unicode[STIX]{x1D63C}^{r+1}\unicode[STIX]{x1D63D} & \ldots & \unicode[STIX]{x1D63E}\unicode[STIX]{x1D63C}^{r+s+1}\unicode[STIX]{x1D63D}\end{array}\right],\end{eqnarray}$$$\boldsymbol{E}_{m}$ and $\boldsymbol{E}_{t}$ defined for mathematical convenience and given by $\boldsymbol{E}_{m}^{\ast }=\left[\begin{array}{@{}cc@{}}\unicode[STIX]{x1D644}_{q} & 0\end{array}\right]_{q\times (s+1)q}$ and $\boldsymbol{E}_{t}^{\ast }=\left[\begin{array}{@{}cc@{}}\unicode[STIX]{x1D644}_{p} & 0\end{array}\right]_{p\times (r+1)p}$, and $\unicode[STIX]{x1D644}_{p}$ and $\unicode[STIX]{x1D644}_{q}$ are identity matrices.






In the current work, we focus on the construction of the ROM for a single input and single output model. However, the above procedure is quite general and can be applied to multiple inputs and multiple outputs models. Using the above algorithm, a linear ROM corresponding to the fluid part of the FSI problem can be developed. The Hankel matrix is obtained by recording the lift force coefficient  $(C_{l})$ subjected to an impulse input of transverse displacement
 $\boldsymbol{Y}$. Following the above procedure, the fluid ROM constructed will be of the form
 $$\begin{eqnarray}\left.\begin{array}{@{}c@{}}\boldsymbol{X}_{f}(k+1)=\unicode[STIX]{x1D63C}_{f}\boldsymbol{X}_{f}(k)+\unicode[STIX]{x1D63D}_{f}\boldsymbol{Y}(k),\\ C_{l}(k)=\unicode[STIX]{x1D63E}_{f}\boldsymbol{X}_{f}(k)+\unicode[STIX]{x1D63F}_{f}\boldsymbol{Y}(k),\end{array}\right\}\end{eqnarray}$$
where the subscript  $f$ is used to indicate the fluid part of the FSI system.
2.3 Reduced-order model for flow–structure interaction problem
The non-dimensional structural equation for a transversely vibrating cylinder with one degree of freedom can be written as
 $$\begin{eqnarray}\ddot{Y} +4\unicode[STIX]{x1D701}\unicode[STIX]{x03C0}f_{s}{\dot{Y}}+(2\unicode[STIX]{x03C0}f_{s})^{2}Y=\frac{2}{\unicode[STIX]{x03C0}m^{\ast }}C_{l},\end{eqnarray}$$
where  $Y$ is the transverse displacement,
 $C_{l}$ is the lift coefficient,
 $m^{\ast }$ and
 $\unicode[STIX]{x1D701}$ are the mass ratio and the damping coefficient, respectively,
 $f_{s}$ is the reduced natural frequency, which is defined as
 $f_{s}=f_{n}D/U=1/U_{r}$, with
 $U_{r}$ the reduced velocity, the mass ratio
 $m^{\ast }$ is defined in (3.1), and
 $f_{n}$ indicates the natural frequency of the cylinder-alone system in vacuum. The above equation can be written in the state-space form as
 $$\begin{eqnarray}\dot{\boldsymbol{X}_{s}}=\unicode[STIX]{x1D63C}_{s}\boldsymbol{X}_{s}+\unicode[STIX]{x1D63D}_{s}C_{l},\end{eqnarray}$$
where  $\boldsymbol{X}_{s}$ is a state vector and
 $\unicode[STIX]{x1D63C}_{s}$ and
 $\unicode[STIX]{x1D63D}_{s}$ are the state matrices given by
 $$\begin{eqnarray}\unicode[STIX]{x1D63C}_{s}=\left[\begin{array}{@{}cc@{}}0 & 1\\ -(2\unicode[STIX]{x03C0}f_{s})^{2} & -4\unicode[STIX]{x1D701}\unicode[STIX]{x03C0}f_{s}\end{array}\right],\quad \unicode[STIX]{x1D63D}_{s}=\left[\begin{array}{@{}c@{}}0\\ {\displaystyle \frac{2}{\unicode[STIX]{x03C0}m^{\ast }}}\end{array}\right],\quad \boldsymbol{X}_{s}=\left[\begin{array}{@{}c@{}}Y\\ {\dot{Y}}\end{array}\right].\end{eqnarray}$$
The subscript notation  $s$ is used to indicate the structure part of the FSI system. The continuous state-space equation can be converted to the discrete form and is given by
 $$\begin{eqnarray}\left.\begin{array}{@{}c@{}}\boldsymbol{X}_{s}(k+1)=\unicode[STIX]{x1D63C}_{sd}\boldsymbol{X}_{s}(k)+\unicode[STIX]{x1D63D}_{sd}C_{l}(k),\\ Y(k)=\unicode[STIX]{x1D63E}_{sd}\boldsymbol{X}_{s}(k),\end{array}\right\}\end{eqnarray}$$
where  $\unicode[STIX]{x1D63C}_{sd}=\text{e}^{\unicode[STIX]{x1D63C}_{s}\unicode[STIX]{x0394}t}$,
 $\unicode[STIX]{x1D63D}_{sd}=\unicode[STIX]{x1D63C}_{s}^{-1}(\text{e}^{\unicode[STIX]{x1D63C}_{s}\unicode[STIX]{x0394}t}-\unicode[STIX]{x1D644})\unicode[STIX]{x1D63D}_{s}$,
 $\unicode[STIX]{x0394}t$ is the constant sampling time,
 $\unicode[STIX]{x1D644}$ is the identity matrix and
 $\unicode[STIX]{x1D63E}_{sd}=\left[\begin{array}{@{}cc@{}}1 & 0\end{array}\right]$. The discrete state-space form of the non-dimensional structural equation (2.17) is coupled with the fluid ROM (2.13) to give rise to a linear ROM for the coupled FSI problem:
 $$\begin{eqnarray}\boldsymbol{X}_{fs}(k+1)=\unicode[STIX]{x1D63C}_{fs}\boldsymbol{X}_{fs}(k),\quad \unicode[STIX]{x1D63C}_{fs}=\left[\begin{array}{@{}cc@{}}\unicode[STIX]{x1D63C}_{sd}+\unicode[STIX]{x1D63D}_{sd}\unicode[STIX]{x1D63F}_{f}\unicode[STIX]{x1D63E}_{sd} & \unicode[STIX]{x1D63D}_{sd}\unicode[STIX]{x1D63E}_{f}\\ \unicode[STIX]{x1D63D}_{f}\unicode[STIX]{x1D63E}_{sd} & \unicode[STIX]{x1D63C}_{f}\end{array}\right],\end{eqnarray}$$
where  $\boldsymbol{X}_{fs}=\left[\begin{array}{@{}cc@{}}\boldsymbol{X}_{s} & \boldsymbol{X}_{f}\end{array}\right]^{\text{T}}$ and
 $\unicode[STIX]{x1D63C}_{fs}$ denotes the coupled fluid–structure matrix in discrete state-space form. The eigenvalues of the coupled fluid–structure matrix
 $\unicode[STIX]{x1D63C}_{fs}$ contain information about the stability of the system. The growth rate is defined as the real part of the most unstable eigenvalue
 $\unicode[STIX]{x1D70E}=\text{Re}(\unicode[STIX]{x1D706})$ and the corresponding frequency is defined by
 $f=\text{Im}(\unicode[STIX]{x1D706}/2\unicode[STIX]{x03C0})$. With the help of the growth rate, one can assess the stability characteristics of the system for different structural parameters such as
 $m^{\ast }$,
 $\unicode[STIX]{x1D701}$,
 $f_{s}$ and geometric variations.
The numerical formulation in the above two sections describes the high-dimensional (full-order) and low-dimensional (reduced-order) models used in the current work. While the high-dimensional model will provide detailed insights into the vorticity dynamics and VIV, the goal of the ERA-based ROM is to capture essential dynamical stability properties of the coupled linearized system dynamics. The ROM resulting from the ERA provides a projection of the original system on the set of modes through a set of impulse responses from the input–output dynamics of VIV. As mentioned earlier, we have chosen the problem of passive suppression of VIV in the current work. The mechanism behind the passive suppression of VIV is examined via ERA-based stability analysis and a detailed analysis of the coupled dynamical behaviour is presented in § 4. Together with the POD analysis, the trends of eigenvalues are considered to gain insights about the suppression mechanism via a physically realizable framework. The ERA-based ROM employed herein has been extensively verified for cylinder vortex dynamics and VIV in Yao & Jaiman (Reference Yao and Jaiman2017a,Reference Yao and Jaimanb). In the next section, we present some additional verification of the ERA-based ROM with more appropriate cases pertaining to the passive suppression of VIV.
3 Verification
This section deals with the problem set-up and the verification of the ERA-based ROM for a two-dimensional laminar flow at low Reynolds numbers.
3.1 Problem definition
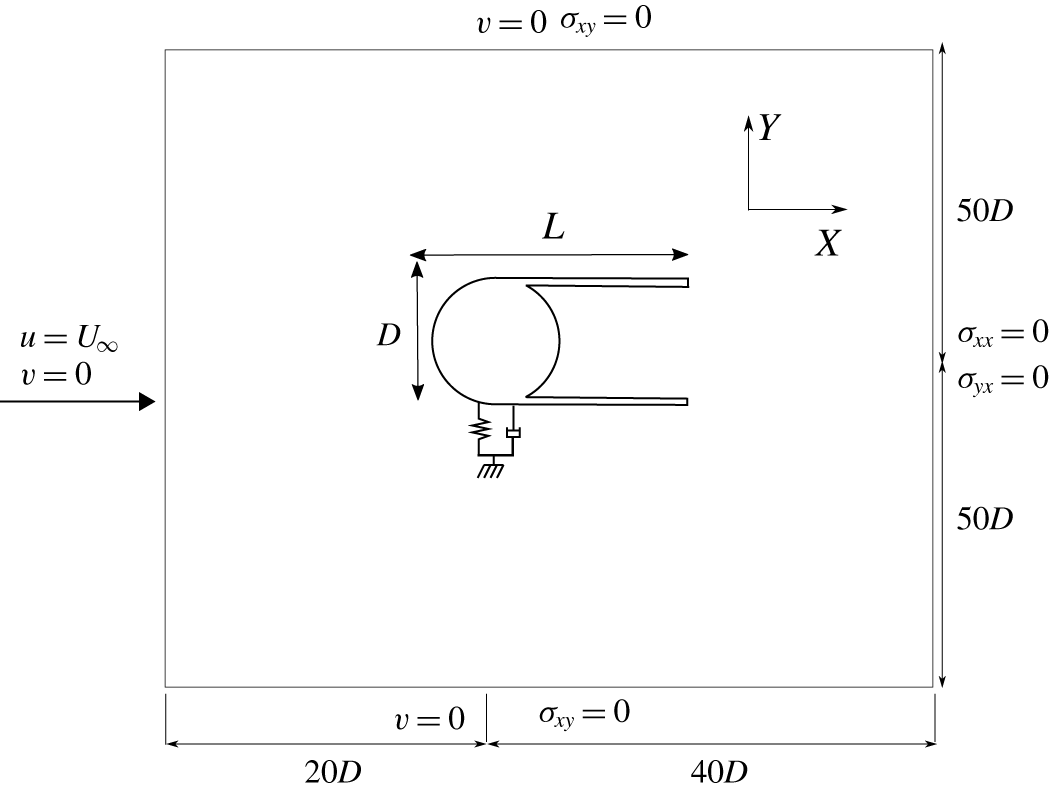
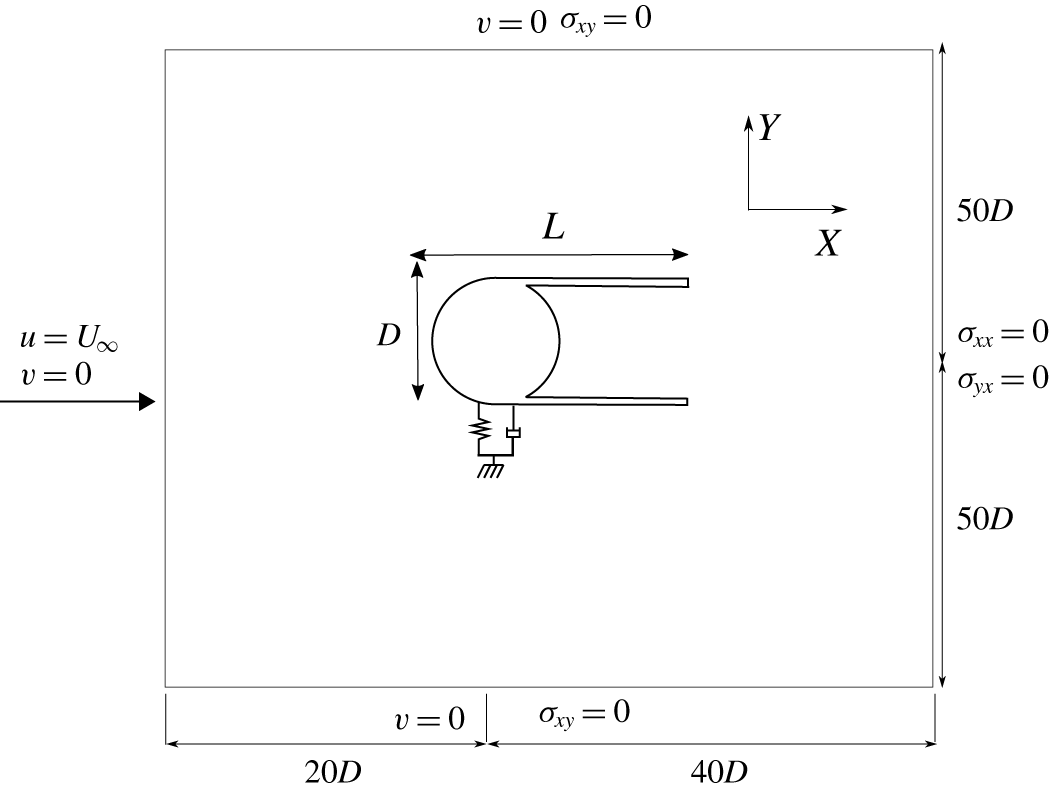
The schematic diagram of the set-up used in the current study for an elastically mounted cylinder with various suppression devices is displayed in figure 1. The coordinate origin is located at the geometric centre of the circular part of the bluff body, and  $x$ and
 $y$ denote the streamwise and transverse directions, respectively. A stream of incompressible fluid enters into the domain from an inlet boundary at a horizontal velocity
 $(u,v)=(U,0)$, where
 $u$ and
 $v$ denote the streamwise and transverse velocities, respectively. A cylinder with mass
 $m$ and diameter
 $D$ is mounted on a linear spring with stiffness
 $k$ and damping coefficient
 $c$ in the transverse direction. The cylinder body is attached with different passive suppression devices, which are introduced further in later sections. The characteristic longitudinal length
 $L$ of all the devices is measured from the front of the cylinder to the end of the device. In the current section, a fairing is used as the suppression device, and its characteristic longitudinal length is set to
 $L=2.0D$. The fins in the fairing are slightly curved towards each other. The opening
 $a$ of the fairing is kept constant and set to
 $0.95D$ throughout the study. Details about the other passive suppression devices are discussed in later sections. The total mass
 $m$ of the body includes the cylinder with appendage mass.
All the suppression devices are attached to the cylinder, and there is no relative motion between the appendage and the cylinder. The cylinder–appendage system is free to vibrate in the transverse direction. The inlet boundary is located  $20D$ away from the centre of the cylinder and the outlet boundary at
 $40D$. The blockage ratio is maintained to be 1 % with sides located at
 $50D$ from the centre of the cylinder. A no-slip wall condition is implemented on the surfaces of the cylinder and the suppression devices. The top and bottom boundaries are considered with a slip wall condition. All the positions and length scales are normalized by the characteristic cylinder diameter
 $D$, velocities with free-stream velocity
 $U$ and frequencies with
 $U/D$. The key dimensionless VIV parameters of the cylinder–appendage system considered in the current study are mass ratio
 $(m^{\ast })$, reduced velocity
 $(U_{r})$ and Reynolds number
 $(Re)$ and they are defined as follows:
 $$\begin{eqnarray}m^{\ast }=\frac{4m}{\unicode[STIX]{x03C0}\unicode[STIX]{x1D70C}_{f}D^{2}L},\quad U_{r}=\frac{U}{f_{n}D},\quad Re=\frac{\unicode[STIX]{x1D70C}^{f}UD}{\unicode[STIX]{x1D707}^{f}},\end{eqnarray}$$
where  $f_{n}$ is the natural frequency measured in vacuum. The value of
 $U$ is considered to be 1 throughout the numerical study. The Reynolds number
 $Re$ and the reduced velocity
 $U_{r}$ are varied by changing the values of dynamic viscosity
 $\unicode[STIX]{x1D707}_{f}$ and the natural frequency
 $f_{n}$. The damping is set to be zero in all the numerical simulations and therefore damping ratio is not considered among the key dimensionless parameters.
Schematic diagram of a representative bluff body consisting of an elastically mounted cylinder with fairings subjected to a uniform horizontal flow. Computational and boundary conditions are shown.
3.2 Stability analysis
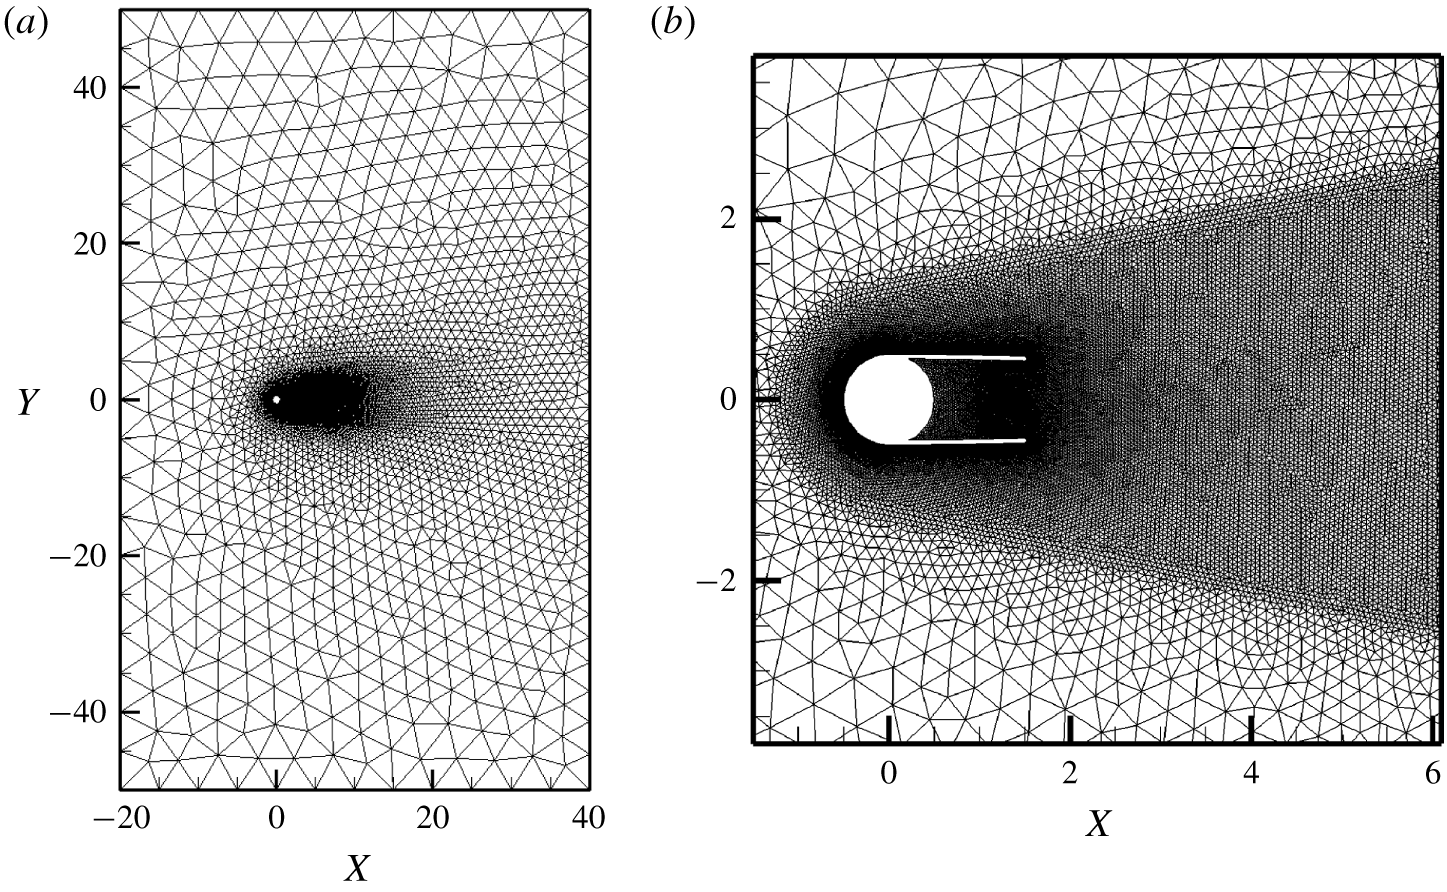
Finite element mesh with  $\mathbb{P}_{2}/\mathbb{P}_{1}$ discretization: (a) full domain discretization and (b) close-up view in the vicinity of the cylinder–fairing system.
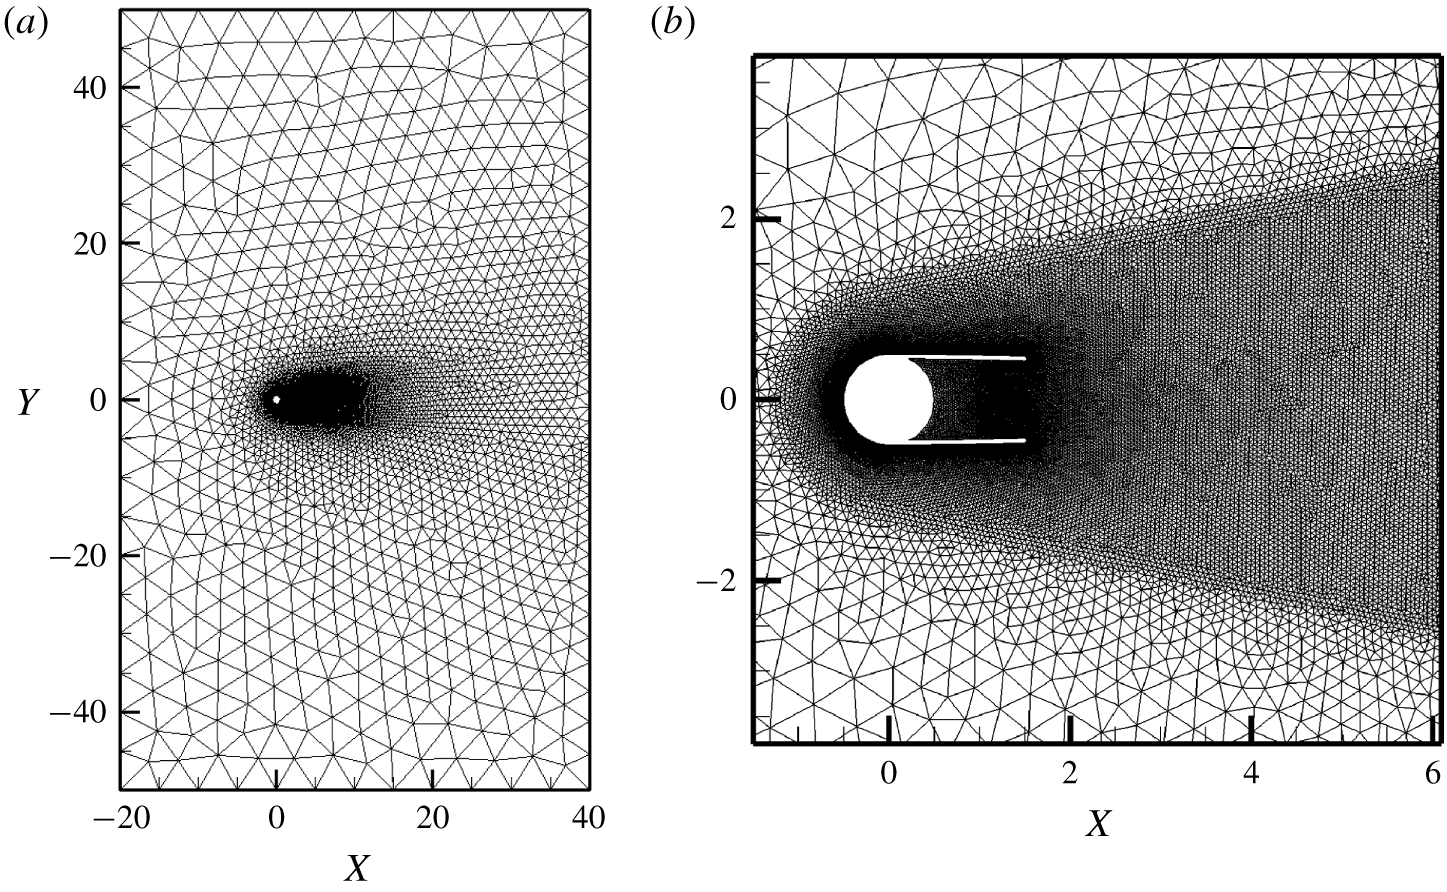
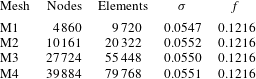
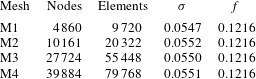
The reliability of the ERA-based ROM is verified by assessing the stability of the laminar wake behind a two-dimensional circular cylinder–appendage system. The appendage is considered to be a fairing for the analysis presented in this section. Four mesh configurations are considered for the mesh convergence study. The quality of the mesh convergence is determined by the prediction of the growth rate  $\unicode[STIX]{x1D70E}$ and the frequency
 $f$ of the fluid ROM for the flow past a cylinder with a fairing system at
 $Re=100$. The results of this study are tabulated in table 1. The difference between M3 and M4 is found to be less than 1 %. Therefore, mesh M3 with
 $27\,724$ nodes and
 $55\,448$ elements is considered to be sufficiently refined for the current study and is depicted in figure 2. Based on the methodology described in the previous section, the process of constructing the ROM for the coupled FSI system contains the following vital components:
Mesh convergence study: comparison of growth rate and frequency for different mesh configurations for the flow past a stationary circular cylinder at  $Re=100$.
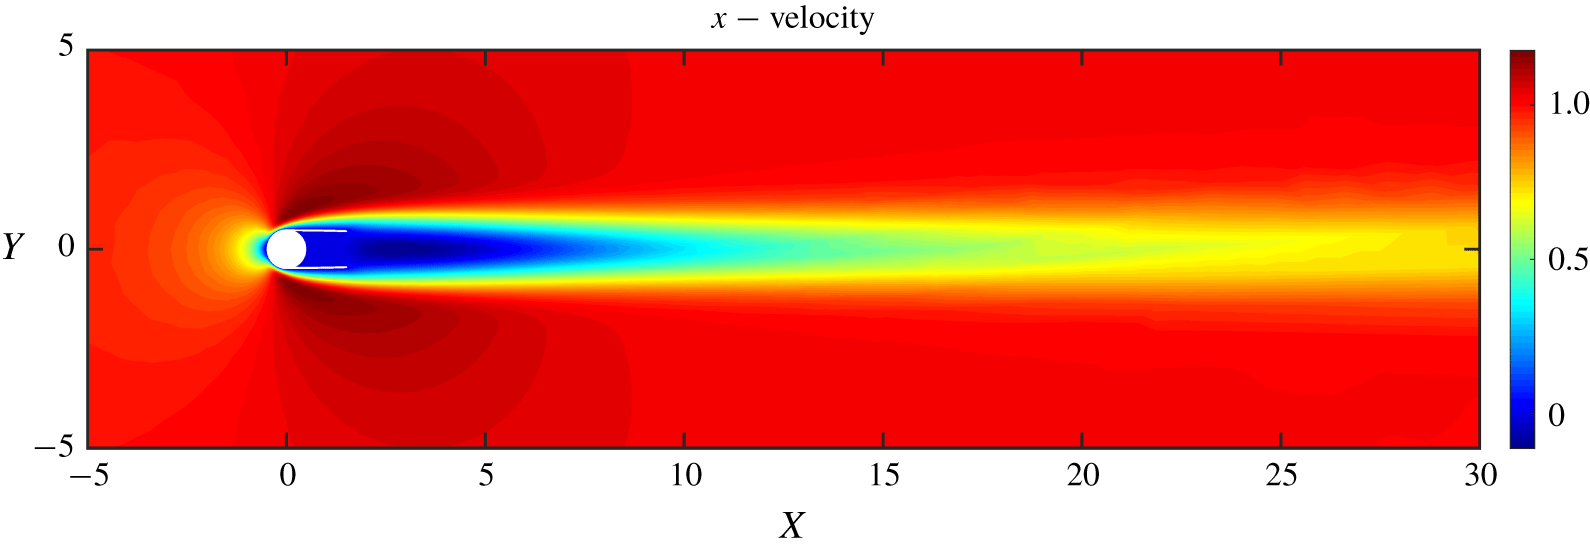
(i) Base flow. The base flow is computed via fixed-point iteration by dropping the time-dependent term in (2.1). This base flow can be considered as an equilibrium position of the FSI system. We essentially disturb this equilibrium position and study the growth of the disturbance and then assess whether the system is stable or unstable.
(ii) Impulse response. The disturbance to the base flow is provided via an impulse input of the transverse displacement
$Y$. The response is recorded for a sufficient horizon. A small amplitude of the order of $10^{-3}$ or $10^{-4}$ is applied such that the flow evolves linearly for a relatively long time. The linearity of the impulse is verified by comparing the response with different inputs. To ensure that the unstable modes start to dominate the essential dynamics of the input-output relationship, an adequate number of cycles is required to capture the linear dynamics of the system. However, an excessively long simulation time should be avoided before the nonlinearity appears via exponential growth of the unstable modes.(iii) ERA. The ERA algorithm outlined in the previous section is followed to construct the fluid ROM. This procedure involves the calculation of the Hankel matrix, by performing the SVD and calculating the reduced system state matrices. The dimensions of the Hankel matrix can be determined by examining the convergence of the fluid unstable eigenvalues.
(iv) Eigenspectrum. The linear ROM for the coupled system is calculated by (2.17). As discussed earlier, the matrix
$\unicode[STIX]{x1D63C}_{fs}$ characterizes the linear dynamics of the coupled system. The continuous eigenvalues, $\unicode[STIX]{x1D706}=\text{log}(\text{eig}(\unicode[STIX]{x1D63C}_{fs}))/\unicode[STIX]{x0394}t$ are considered for the stability analysis. The eigenvalues of the matrix $\unicode[STIX]{x1D63C}_{fs}$ are calculated and the leading unstable modes are identified with a growth rate and corresponding frequency. The eigenspectrum can be constructed by plotting the root loci of leading unstable modes as a function of the reduced natural frequency $f_{s}$. The position of the eigenvalues on this spectrum provides information about the stability of the coupled system.





Base flow of a stationary cylinder–fairing system at  $Re=90$; the streamwise velocity contours are shown.
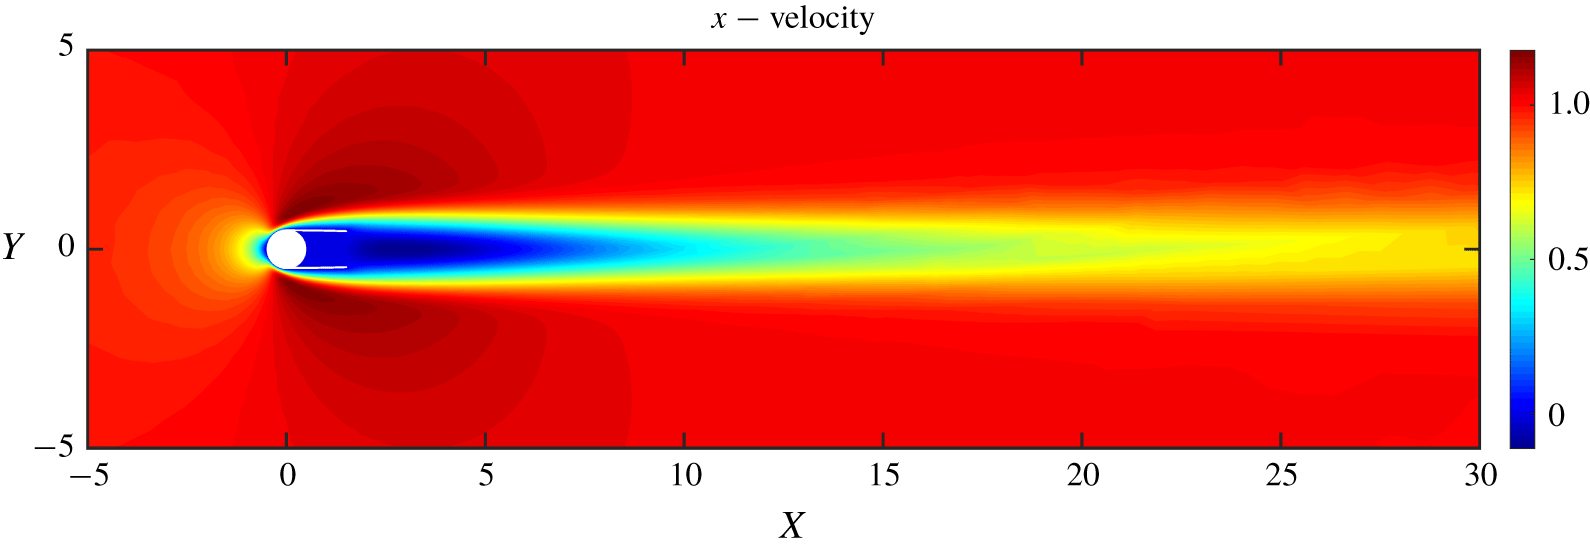
The above process with the four main components forms a general procedure to be followed while constructing the ERA-based ROM. It should be noted that ERA is only applied to the fluid system and the resulting matrices are used to compute the ROM of the coupled system. The specific details of each component corresponding to the current study are discussed in the upcoming paragraphs. Figure 3 shows the streamwise velocity contours of the base flow at  $Re=90$. A disturbance of
 $\unicode[STIX]{x1D6FF}=10^{-4}$ is given as an impulse input to the transverse displacement
 $\boldsymbol{Y}$. The lift coefficient
 $C_{l}$ is recorded for every time step
 $\unicode[STIX]{x0394}t=0.05$. A set of 1000 responses are stacked resulting in a total simulation time of
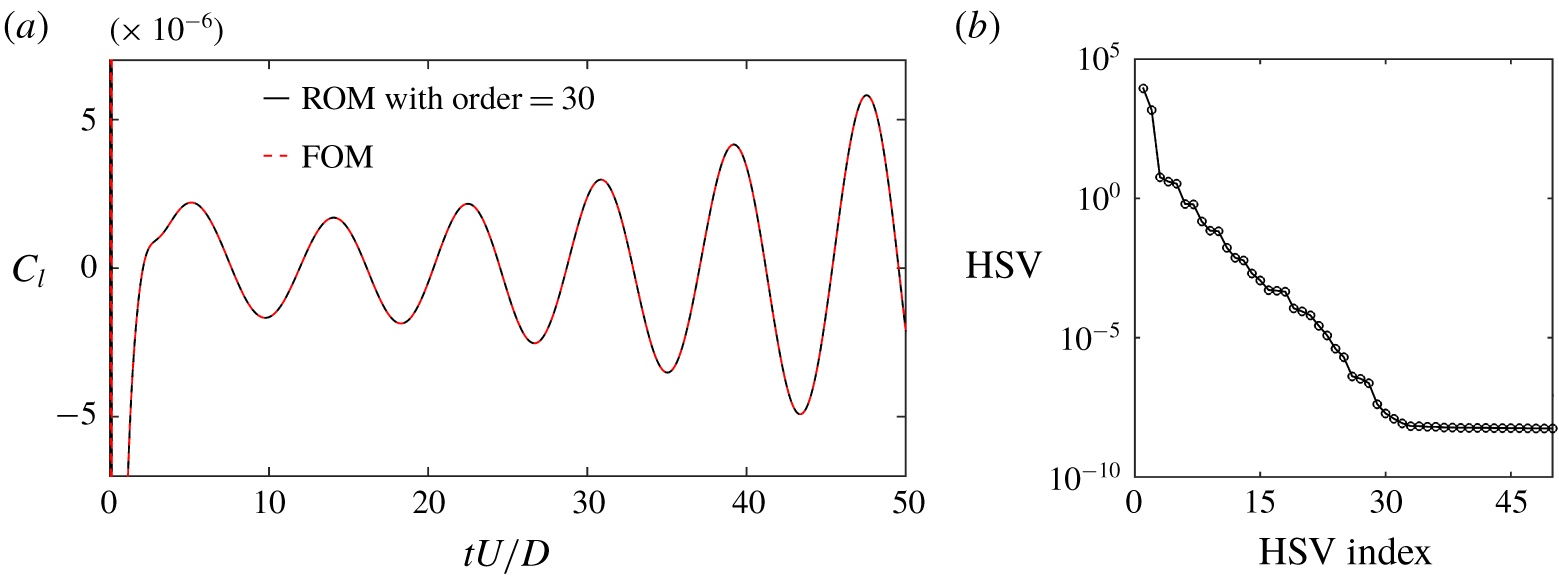
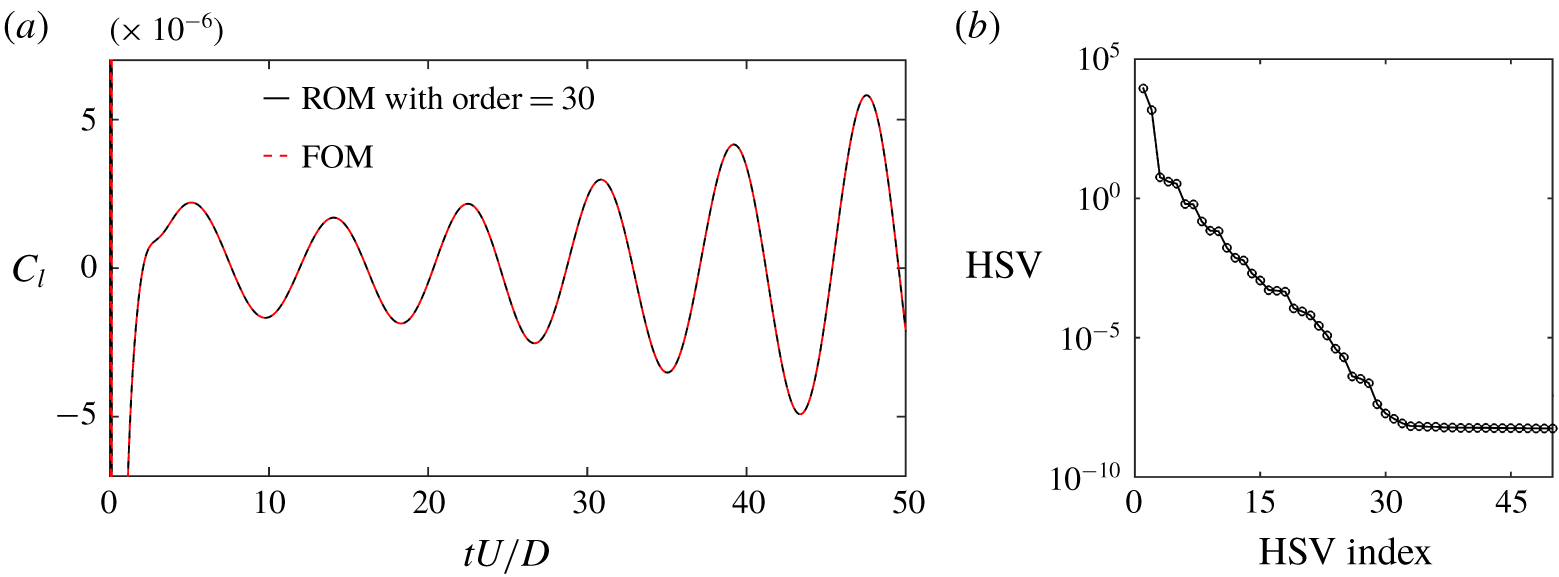
 $tU/D=50$ s. Figure 4(a) shows the output lift signal
 $C_{l}$ calculated from the FOM and the ERA-based ROM. The signal gradually diverges as a function of convective time
 $tU/D$ at
 $Re=90$. The Hankel matrix with dimension
 $500\times 250$ is found to be appropriate by examining the convergence of unstable fluid eigenvalues computed from Hankel matrices with dimensions of
 $500\times 25$,
 $500\times 50$,
 $500\times 150$,
 $500\times 250$ and
 $500\times 300$. The order of the ERA-based ROM is selected by examining the HSV distribution. The fast-decaying singular values as depicted in figure 4 suggest that the ERA-based ROM with order
 $n_{r}=30$ is sufficient. This is further confirmed by the accurate reconstruction of the impulse response by the ERA-based ROM displayed in figure 4(a).
The ERA-based ROM for the unstable wake behind a stationary cylinder at  $Re=90$: (a) lift history due to impulse response calculated from the FOM and the ERA-based ROM and (b) HSV distribution corresponding to
 $500\times 250$ Hankel matrix.
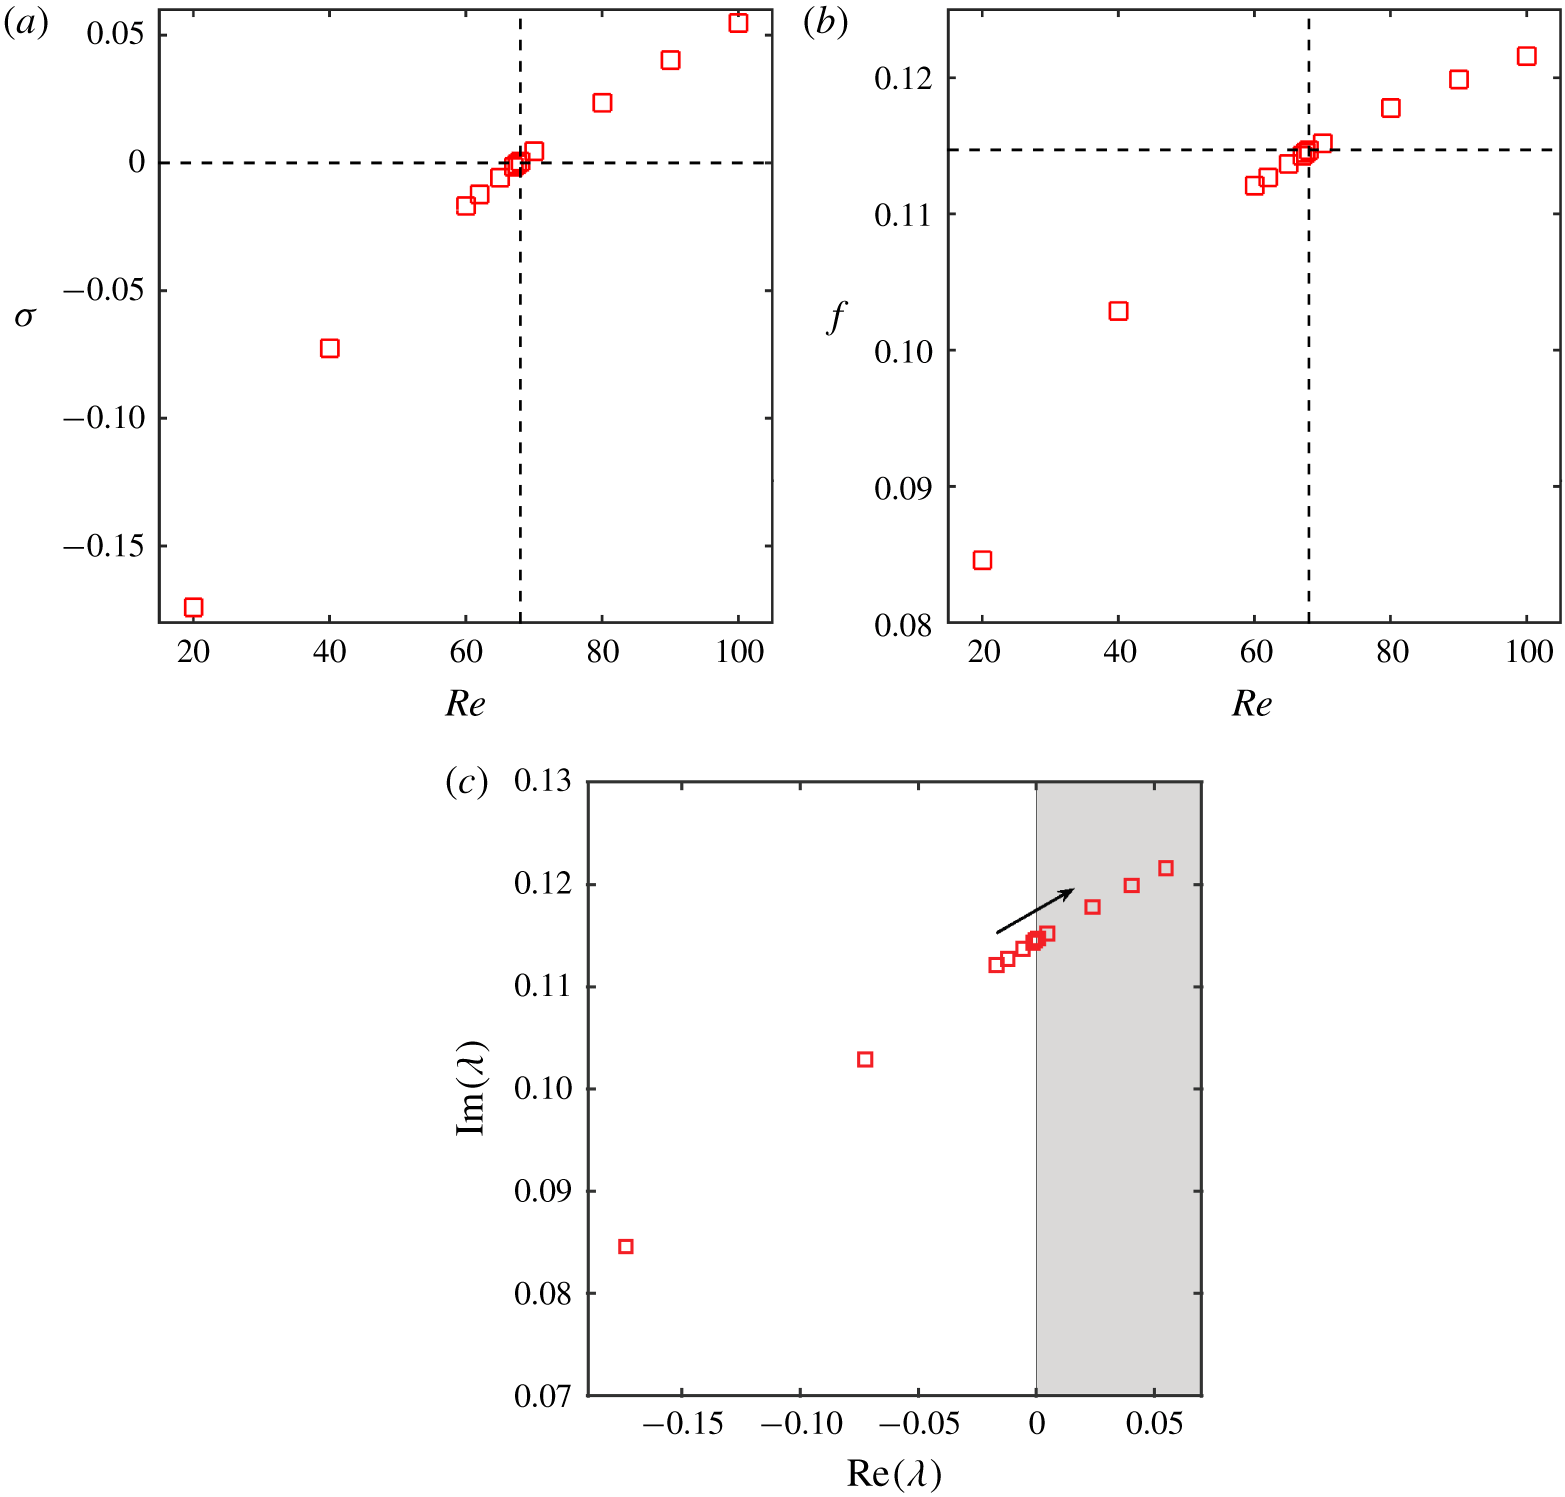
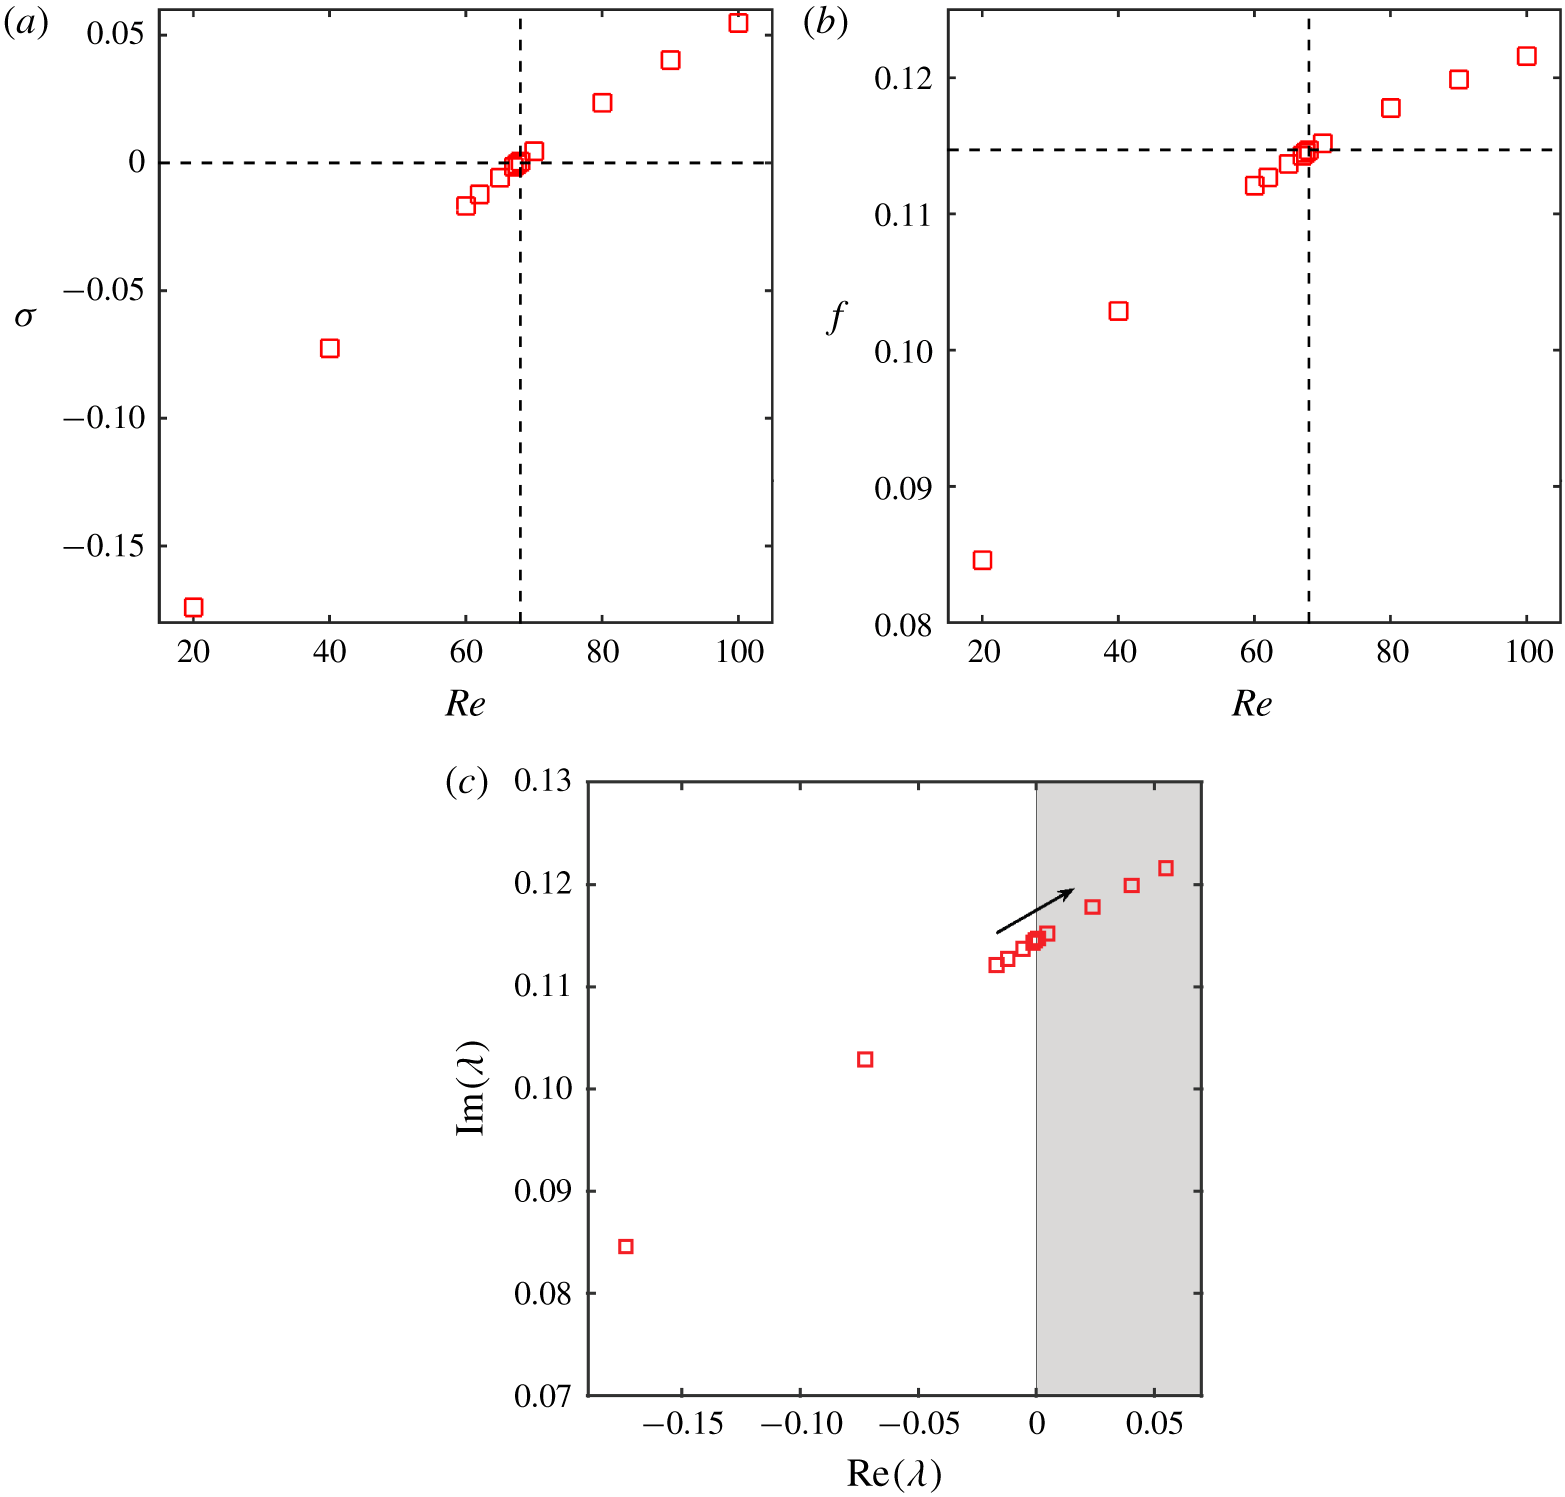
Growth rate and frequency of most unstable eigenvalue of fluid ROM: (a) growth rate  $\unicode[STIX]{x1D70E}$ and (b) frequency
 $f$. The growth rate
 $\unicode[STIX]{x1D70E}\geqslant 0$ indicates the instability in the system, which is manifested as vortex shedding. (c) Root loci as a function of Reynolds number, where the unstable region
 $\text{Re}(\unicode[STIX]{x1D706})>0$ is shaded in grey. The arrow depicts the increasing order of Reynolds number.
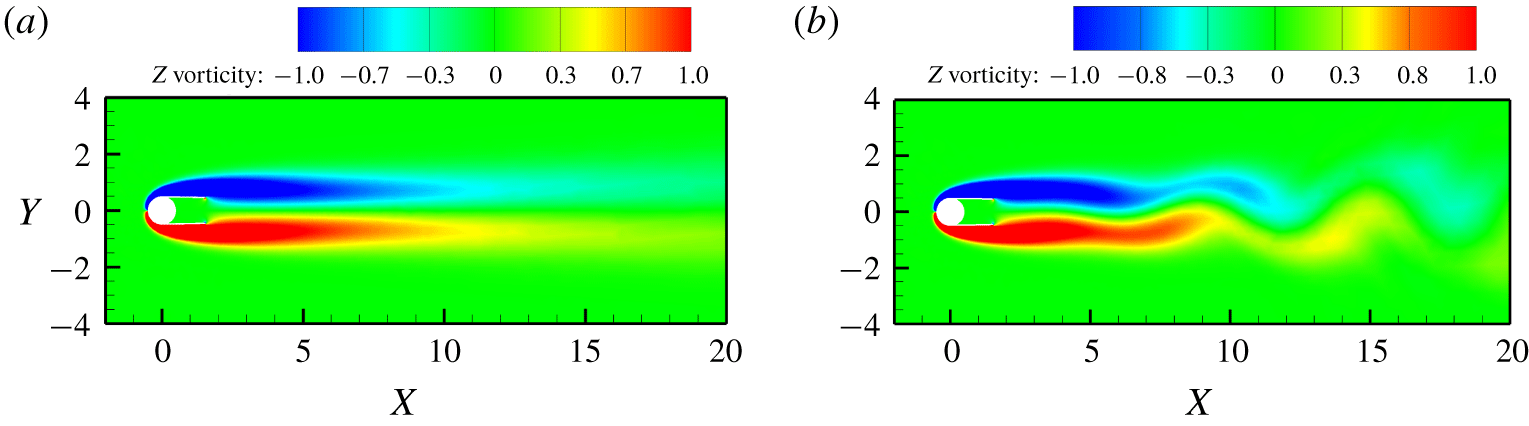
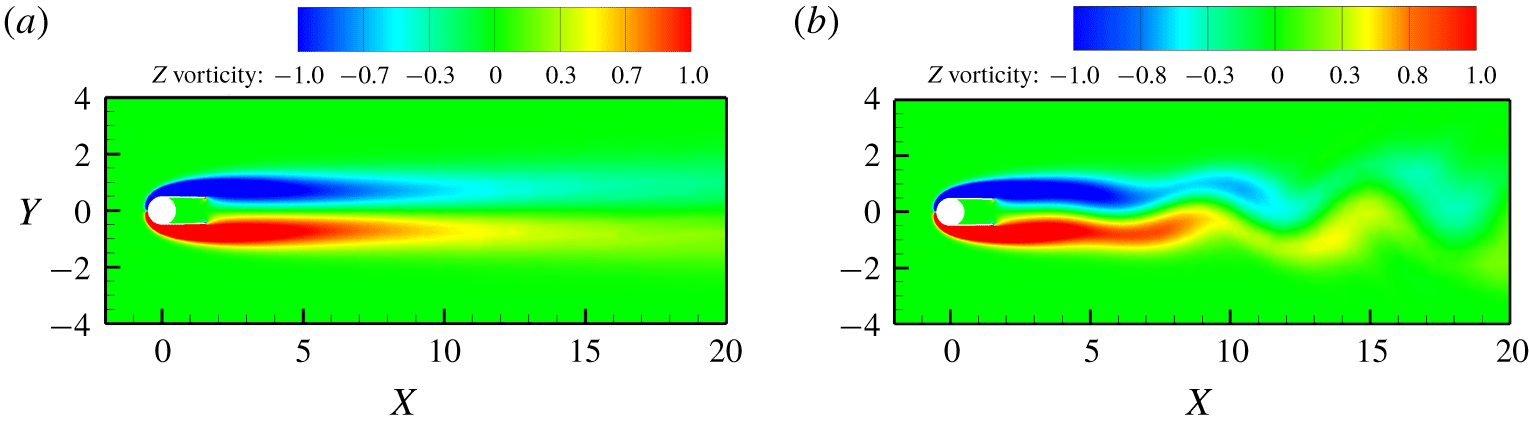
Vorticity contours from the FOM: (a)  $Re=68$ and (b)
 $Re=69$.
According to Juang & Pappa (Reference Juang and Pappa1985), the Hankel matrix may not be necessarily square but can be tall, wide or square depending on the problem under consideration. The ERA-based ROM is further used to identify the onset of Hopf bifurcation for the cylinder–fairing system. The growth rates  $\unicode[STIX]{x1D70E}$ and
 $f$ of the fluid ROM are calculated by considering the unstable eigenvalues of
 $\text{eig}(A_{f})$. The ERA-based ROM is constructed by following the aforementioned procedure at different Reynolds number
 $Re\leqslant 100$. The growth rate
 $\unicode[STIX]{x1D70E}$ and frequency
 $f$ are plotted against
 $Re$ and are depicted in figure 5. The critical Reynolds number where
 $\unicode[STIX]{x1D70E}=0$ is found to be
 $Re\approx 68.5$. This result of the cylinder–fairing system has been identified for the first time. It is further confirmed by our FOM calculations. The vorticity contours from the FOM calculations are displayed in figure 6 for
 $Re=68$ and 69. Since
 $Re=68<Re_{cr}$, vortex shedding is not observed and the flow is steady. In the case of
 $Re=69>Re_{cr}$, there is a clear presence of vortex shedding resulting from the wake instability. The growth rate
 $\unicode[STIX]{x1D70E}$ appears to be growing steadily with respect to Reynolds number
 $Re$, suggesting an increase in the vorticity flux and thereby the intensity of vortex shedding as
 $Re$ increases.
In this section, the validity of the ERA-based ROM is presented via a systematic study of the stability analysis of the laminar wake behind a cylinder–fairing system. A generic process to construct the ERA-based ROM for any fluid system has been discussed. The specific conditions to be followed in the process of building the ERA-based ROM are presented. The critical Reynolds number  $Re_{cr}$ is identified for the cylinder–fairing system and is further validated by the FOM computations. The following sections will explore the stability characteristics of the coupled FSI systems.
4 Results and discussion
4.1 Performance of the ERA-based ROM for passive suppression
In this section, the performance of the ERA-based ROM for identifying the effect of passive suppression devices is presented. For this purpose, the eigenspectrum plot for a plain cylinder and a cylinder with fairings is systematically examined. From here on, the cylinder with fairings is simply referred to as a fairing. Consistent with the previous literature (Meliga & Chomaz Reference Meliga and Chomaz2011; Zhang et al. Reference Zhang, Li, Ye and Jiang2015; Yao & Jaiman Reference Yao and Jaiman2017b), we utilize the terminology of SM and WM to classify the distinct eigenvalue trajectories of the fluid–structure system governed by (2.18). These modes are identified based on the magnitudes of the real part of eigenvalues  $(\text{Re}(\unicode[STIX]{x1D706}))$. The two most unstable modes are recognized and are classified as SM and WM depending on their frequencies. When the frequency of the eigenvalue, i.e.
 $(\text{Im}(\unicode[STIX]{x1D706}/2\unicode[STIX]{x03C0}))$, approaches that of the vortex shedding of a stationary cylinder, the corresponding mode is termed as WM. The fluid–structure mode is identified as SM if the frequency of the eigenvalue comes close to the natural frequency of the cylinder-alone system.
The instability of the WM alone or the simultaneous existence of unstable WM and SM can induce the VIV lock-in (Zhang et al. Reference Zhang, Li, Ye and Jiang2015; Yao & Jaiman Reference Yao and Jaiman2017b). In the case of the first scenario, the closeness of the frequencies of the WM and SM is the reason for the lock-in, which is termed ‘resonance-induced lock-in’. In the event of the second scenario, the combined mode instability of SM and WM jointly sustains the VIV lock-in and is referred to as ‘flutter-induced lock-in’ or ‘coupled mode flutter’.
Continuous-time eigenvalues are considered for depicting the eigenspectrum in the context of the stability analysis. The eigenvalues are calculated from the coupled fluid–structure matrix ( $\unicode[STIX]{x1D706}=\text{log}(\text{eig}(\unicode[STIX]{x1D63C}_{fs}))/\unicode[STIX]{x0394}t$). The eigenvalue distribution of the coupled fluid–structure system is graphically depicted in a complex plane via root locus. The positions of the eigenvalues on this complex plane indicate the stability characteristics of the fluid–structure system. The roots in the right half-plane depict the unstable modes of the system, whereas the roots on the real axis characterize the asymptotic (non-oscillatory) behaviour. Roots that are closest to the right half-plane are tightly damped oscillatory modes.
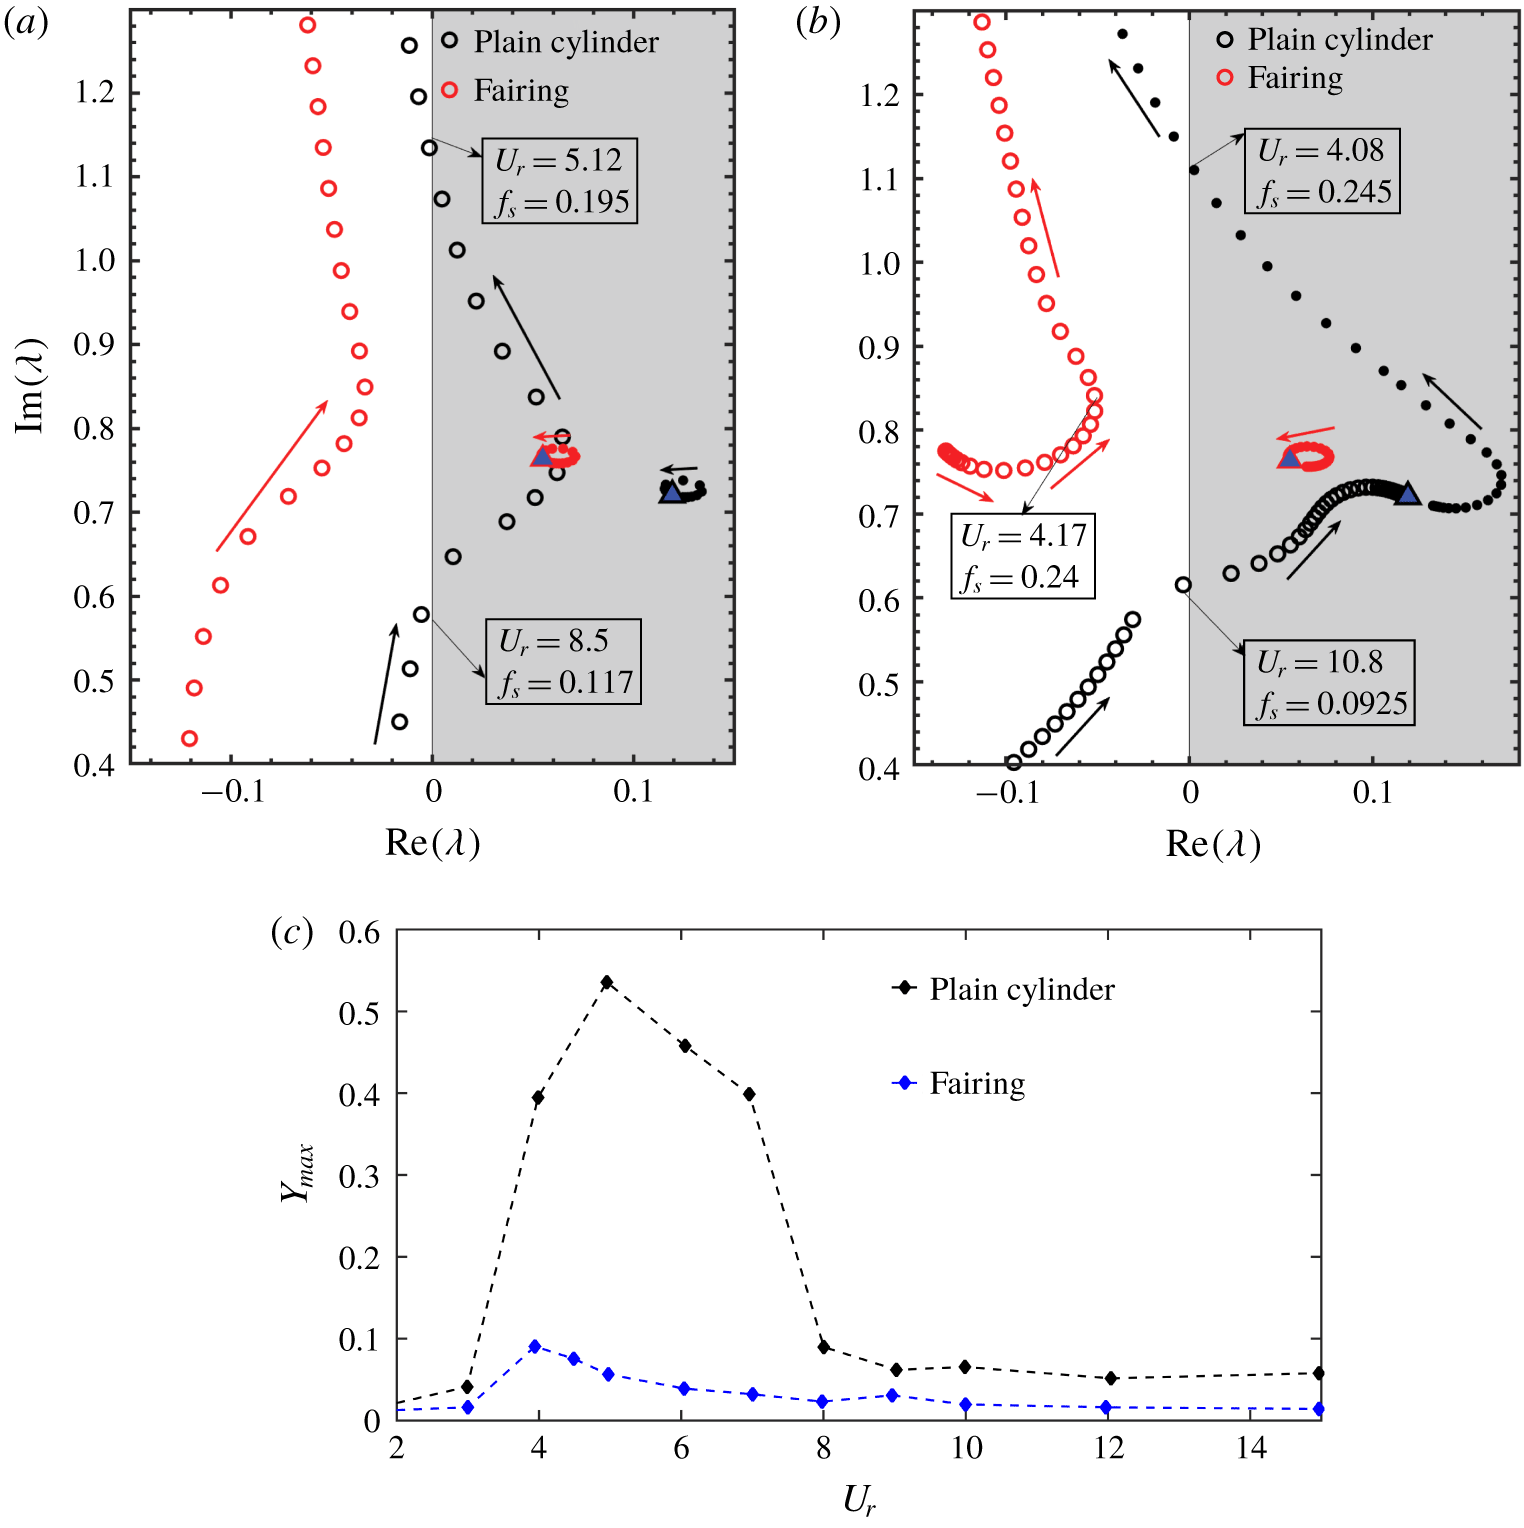
Root loci as a function of  $f_{s}$, where the unstable plain
 $\text{Re}(\unicode[STIX]{x1D706})>0$ is shaded in grey: effect of fairings on the eigenspectrum at (a)
 $Re=100$,
 $m^{\ast }=10$, and (b)
 $Re=100$,
 $m^{\ast }=2.6$. Blue triangle represents the WM of the cylinder-alone system, i.e. it is the most unstable eigenvalue of the matrix
 $\unicode[STIX]{x1D63C}_{f}$. The SM is represented by open circles and the WM is depicted by filled circles. (c) Normalized maximum transverse amplitude for a plain cylinder and a fairing at
 $m^{\ast }=2.6$,
 $Re=100$.
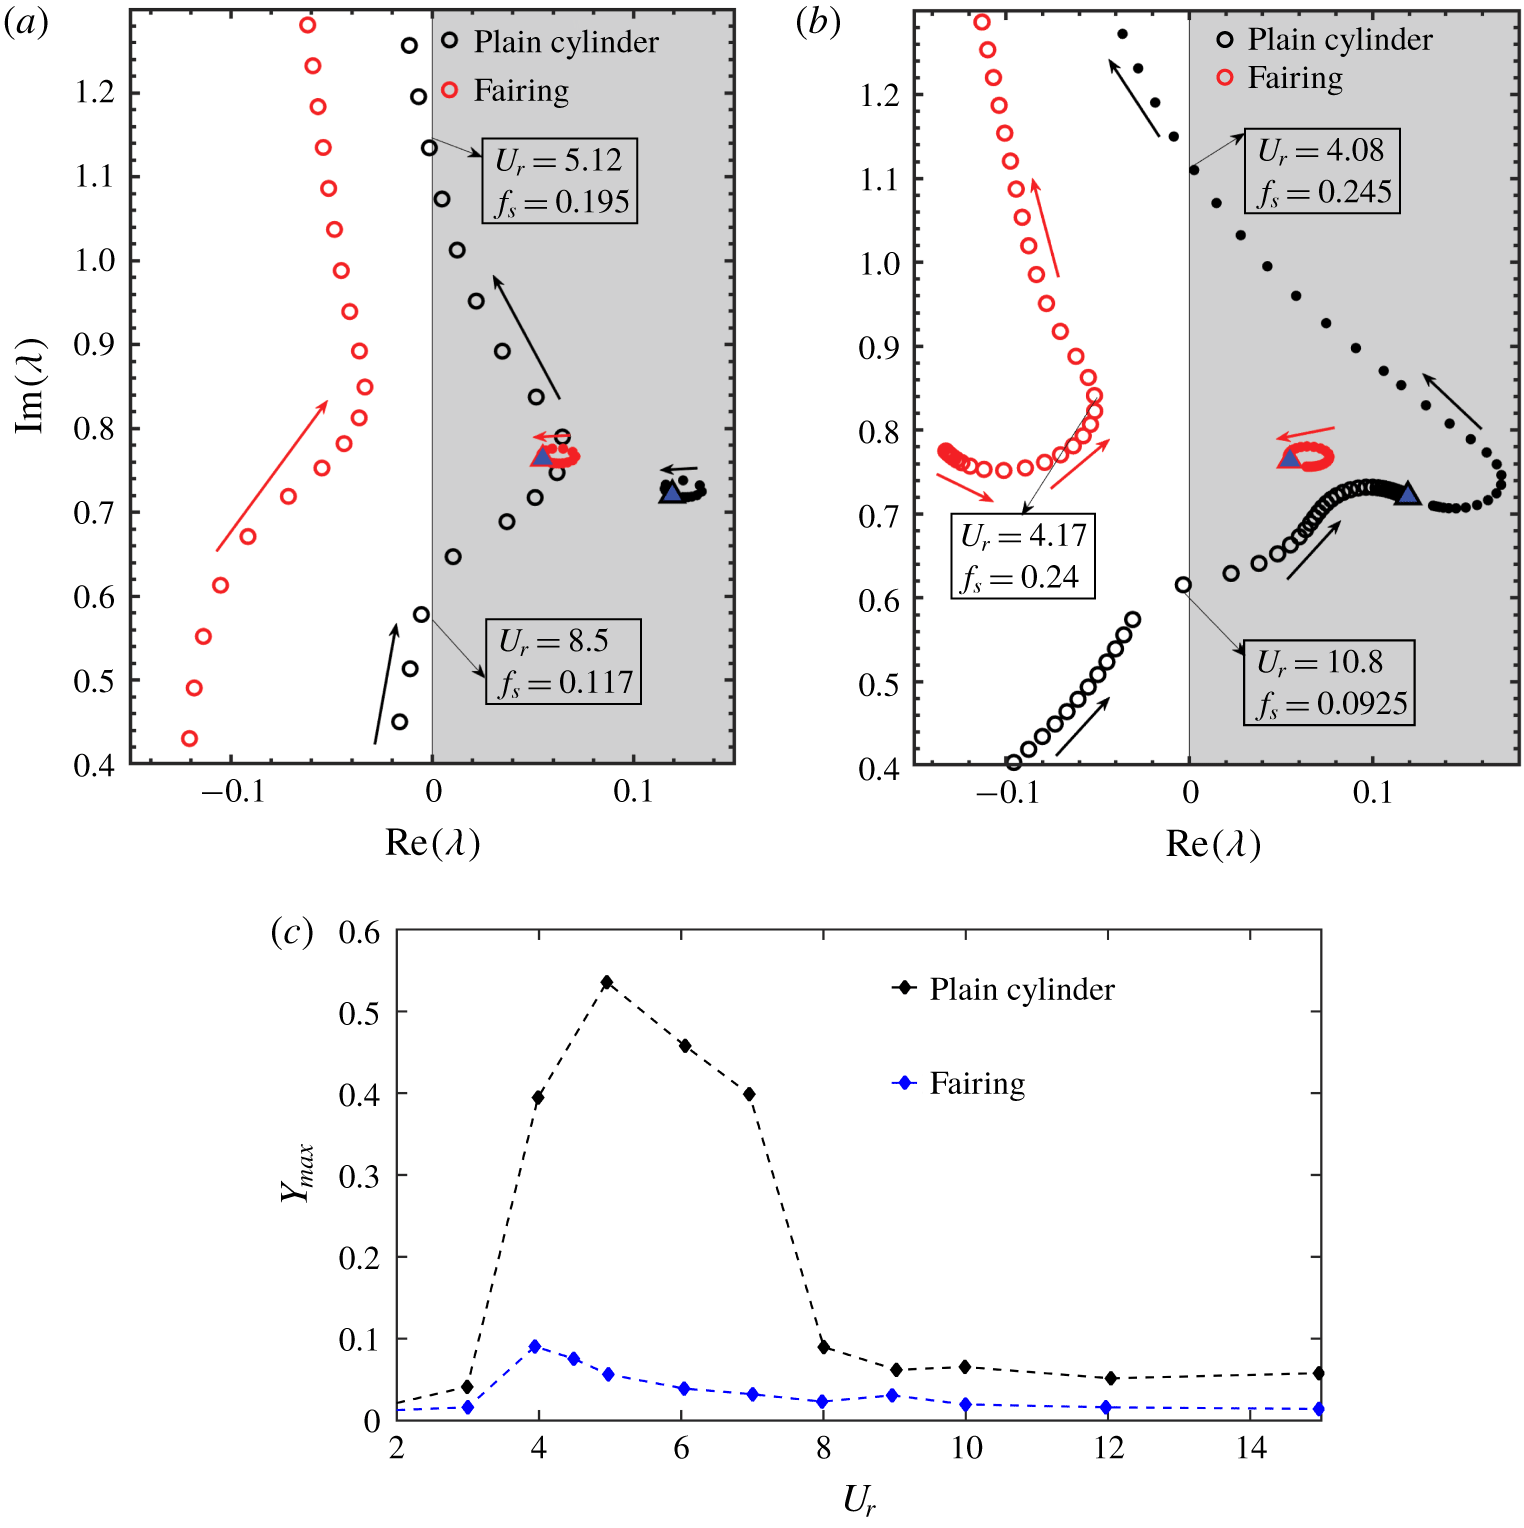
Figure 7(a) shows the eigenvalue trajectory of the fluid–structure system as a function of the reduced natural frequency  $f_{s}$ with
 $0.05\leqslant f_{s}\leqslant 0.25$ and the increment is
 $\unicode[STIX]{x0394}f_{s}=0.0025$. The trajectories of both the plain cylinder and the fairing are depicted in the same figure for comparison purposes. Mass ratio and Reynolds number for both the plain cylinder and the fairing are considered to be
 $Re=100$,
 $m^{\ast }=10.0$. While the SM is represented by open circles, the WM is depicted by filled circles in figure 7. In the case of the plain cylinder, one can observe the combined mode instability on both SM and WM at some values of
 $f_{s}$, which is considered as flutter-induced lock-in, and the same result is also reported in a phase diagram published in Yao & Jaiman (Reference Yao and Jaiman2017b). The presence of the fairing has created a significant shift in both SM and WM when compared to the plain cylinder and resulted in the SM being completely in the left half of the complex plane (i.e. stable region). The WM is still in the right-hand side of the complex plane and is a clear indication that vortex shedding is still prevalent in the case of the fairing, resulting in wake instability.
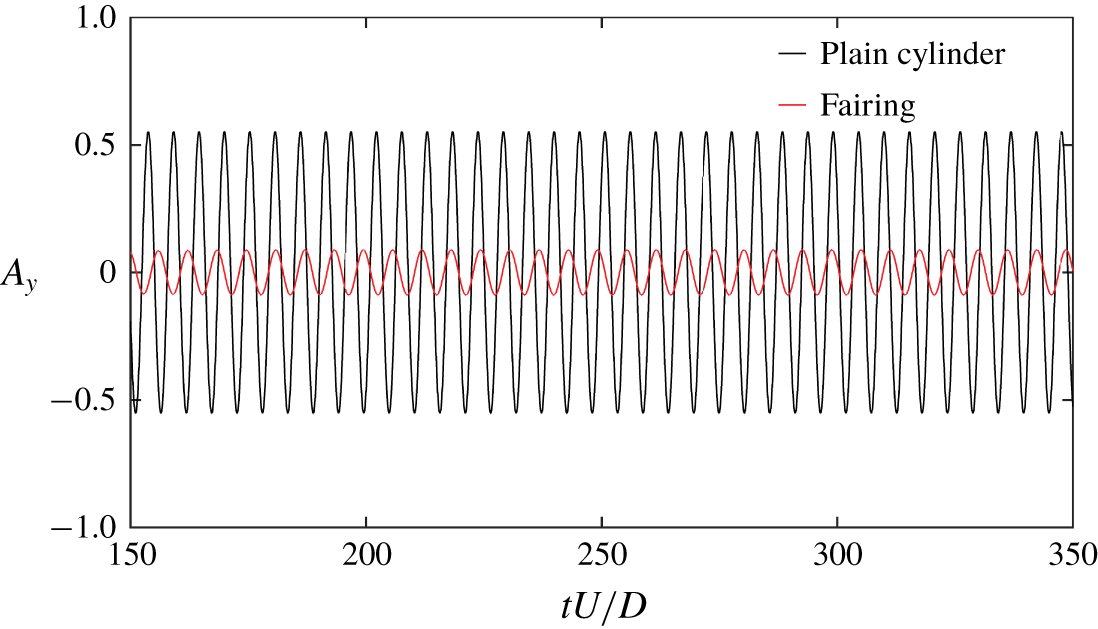
A similar comparison between the plain cylinder and the fairing is presented for  $m^{\ast }=2.6$ in figure 7(b). It is evident from figure 7(b) that SM and WM coalesce and form a coupled mode for the case of a plain cylinder. Owing to the low-mass-ratio effect, there is an increase in the strength of the fluid–structure coupling. Further details on the effects of low mass ratio on the eigenspectrum are discussed in Yao & Jaiman (Reference Yao and Jaiman2017b). It is also evident from figure 7(b) that both SM and WM do not coalesce for the case of the fairing, indicating a relatively weaker fluid–structure coupling at low-mass-ratio condition. Because of the fairing attachment, the SM is found to be completely in the left half of the complex plane, indicating the suppression of transverse vibration. The location of WM in the right half of the eigenspectrum implies that it is unstable due to vortex shedding. The transverse vibration
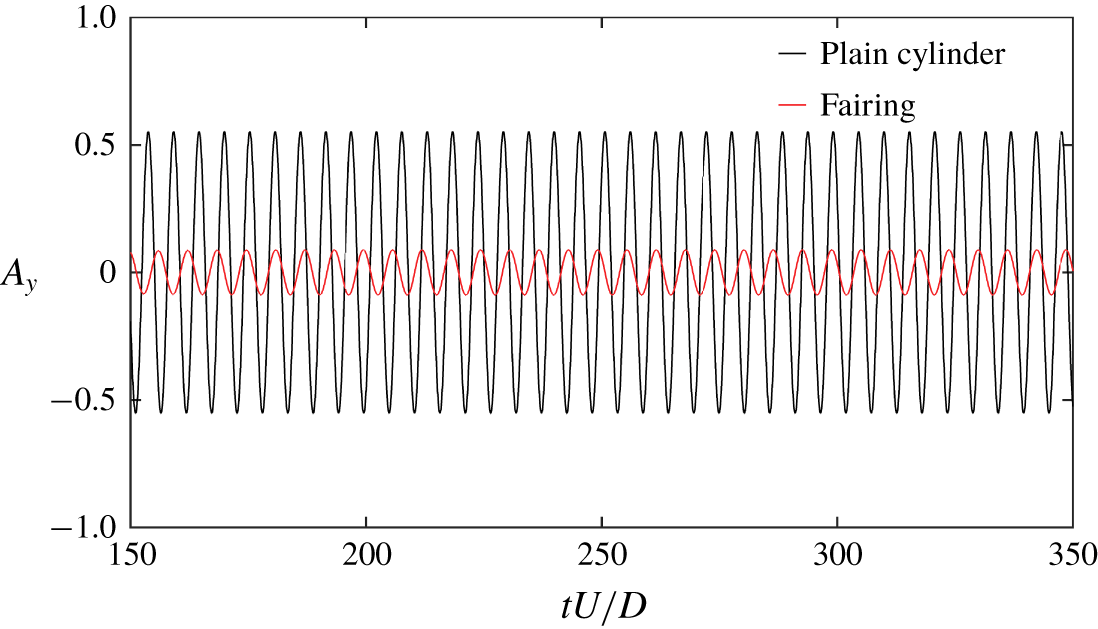
 $A_{y}$ calculated from the FOM at lock-in for both the plain cylinder and the fairing is presented in figure 8. There is a sharp decrease in the amplitude of
 $A_{y}$ in the case of the fairing when compared to the plain cylinder. This result from the FOM provides additional support to the conclusions obtained from the stability analysis of the ERA-based ROM.
Comparison of transverse vibration  $A_{y}$ at lock-in for a plain cylinder (
 $U_{r}=5.0$) and a fairing (
 $U_{r}=4.0$), for
 $Re=100$ and
 $m^{\ast }=2.6$.
To summarize this section, the ERA-based ROM is successfully employed to perform the stability analysis of the VIV of a transversely vibrating plain circular cylinder and a cylinder with a fairing. The presence of the fairing created a suppression of transverse vibration in both high- and low-mass-ratio conditions and is indicated by the stability of SM depicted in figure 7. Instability of the wake did not hinder the suppression achieved by the fairing.
Wake stabilization does not appear to be necessary for the suppression of the structural vibration during fluid–structure interaction. The SM is an ideal indicator for the assessment of suppression devices and its behaviour will be further discussed for other appendage configurations in the following section. As illustrated by the wake patterns in figure 11 for the cylinder–fairing system, wake stabilization does not appear to be a necessary condition for the suppression of the structural vibration during a VIV process.
4.2 Modal decomposition of wake features
The stability analysis of the ERA-based ROM has shown a clear distinction between the plain cylinder and the fairing through the root loci of WM and SM. The purpose of this section is to provide detailed physical insights into the distinction observed by the ERA-based ROM.
The VIV lock-in is the result of a complex interplay between the wake features and the bluff-body motion. A self-sustainable cyclical mechanism has been proposed in Miyanawala & Jaiman (Reference Miyanawala and Jaiman2019) to explain the wake interaction with the bluff-body motion. In the case of the plain cylinder, when the vortex shedding synchronizes with the bluff-body motion, it causes the bluff body to undergo high-amplitude motion. This widens the wake and eventually the shear layer, decreasing the velocity gradients. This causes the shear layer to give away vorticity flux to the vortex shedding process, intensifying the vortex shedding process. Intensified vortices increase the in-phase forces with the motion, i.e. the fluid supplies higher energy to the structure. Owing to the presence of the fairing, the shear layer is extended from the cylinder, thus preventing the interaction of vortices formed by the rollup of the shear layer in the near wake. This disconnect between the near wake and the vortex shedding creates a stable near-wake environment with fewer fluctuations in the kinetic energy and stops the energy transfer from the fluid flow to the structure, thus resulting in the suppression of transverse vibration. The self-sustenance of the wake interaction cycle is broken down in the case of the fairing by preventing the interaction of vortex shedding with the near wake. The effect of the fairing, when compared to the plain cylinder, has also been reported in Law & Jaiman (Reference Law and Jaiman2017) in terms of vortex formation length and wake width.
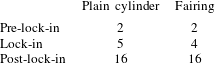
The dominant wake features are identified by a modal decomposition method. A snapshot POD developed by Sirovich (Reference Sirovich1987) is used to extract the most significant modes. The details of the POD algorithm used for the current analysis can be found in Miyanawala & Jaiman (Reference Miyanawala and Jaiman2019). The modal decomposition is carried out for both the plain cylinder and the fairing. The snapshots were collected from the FOM calculations at  $m^{\ast }=2.6$ and
 $Re=100$ for both the plain cylinder and the fairing. The analysis is carried out at different
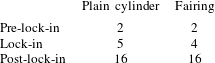
 $U_{r}$, as indicated in table 2, to cover pre-lock-in, lock-in and post-lock-in regions. The pressure field has been used to calculate the significant POD modes. snapshots. For the purpose of POD calculations and the depiction of The unsteady pressure field values for all the mesh points are collected as an
 $m\times k$ matrix
 $\unicode[STIX]{x1D64B}$, where
 $m=\text{mesh count}$ and
 $k=\text{number of snapshots}=350$. The ALE-based flow simulation results correspond to different mesh configurations for different POD modes, we project all the pressure snapshots onto a fixed reference mesh configuration. The fluctuation matrix
 $\tilde{\unicode[STIX]{x1D66E}}_{m\times k}$ is then generated by subtracting the mean value
 $(\bar{\unicode[STIX]{x1D64B}})$ of each point over the snapshots:
 $$\begin{eqnarray}\tilde{\unicode[STIX]{x1D66E}}=\unicode[STIX]{x1D64B}-\bar{\unicode[STIX]{x1D64B}}.\end{eqnarray}$$
The POD modes are extracted using the eigenvalues  $\unicode[STIX]{x1D726}_{k\times k}=\text{diag}[\unicode[STIX]{x1D706}_{1},~\unicode[STIX]{x1D706}_{2},~\ldots ,~\unicode[STIX]{x1D706}_{k}]$ and eigenvectors
 $\boldsymbol{{\mathcal{W}}}=[w_{1},~w_{2},~\ldots ,~w_{k}]$ of the covariance matrix
 $\tilde{\unicode[STIX]{x1D66E}}^{\text{T}}\tilde{\unicode[STIX]{x1D66E}}\in \mathbb{R}^{k\times k}$ given by
 $$\begin{eqnarray}\tilde{\unicode[STIX]{x1D66E}}^{\text{T}}\tilde{\unicode[STIX]{x1D66E}}\,w_{j}=\unicode[STIX]{x1D706}_{j}w_{j}.\end{eqnarray}$$
Here, the POD modes  $\boldsymbol{{\mathcal{V}}}=[v_{1},~v_{2},~\ldots ,~v_{k}]$ are related to
 $\unicode[STIX]{x1D726}$ and
 $\boldsymbol{{\mathcal{W}}}$ by
 $$\begin{eqnarray}\boldsymbol{{\mathcal{V}}}=\tilde{\unicode[STIX]{x1D66E}}\boldsymbol{{\mathcal{W}}}\unicode[STIX]{x1D726}^{-1/2}.\end{eqnarray}$$
Reduced velocity  $U_{r}$ considered in the FOM for POD analysis.
The eigenvalues capture the contribution of each mode in the sense of the least-squares  $L^{2}$-norm of the dataset, and this contribution is referred to as a modal strength in the current paper.
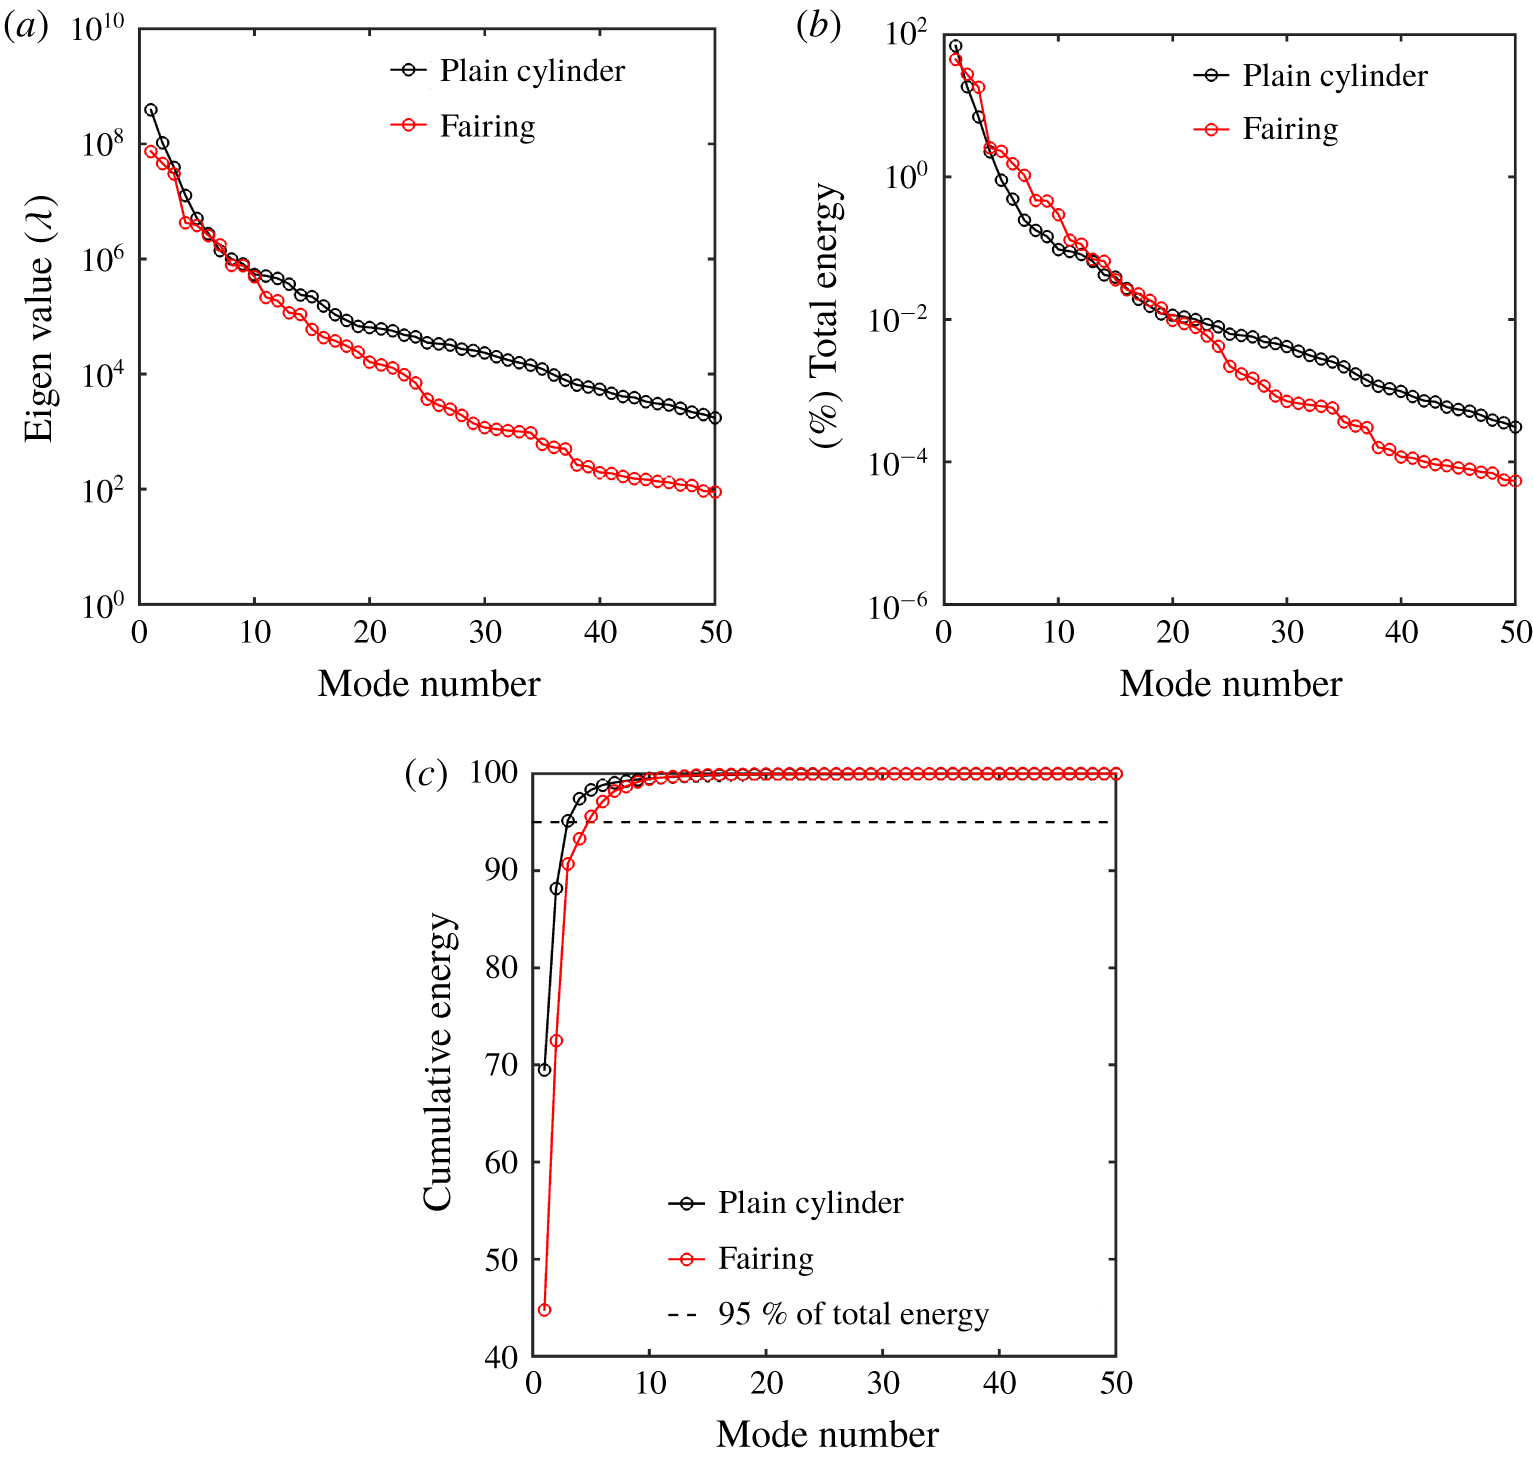
Energy distribution of POD modes for the plain cylinder and the cylinder with fairings: (a) eigenvalues of POD modes, (b) energy decay of POD modes, and (c) cumulative energy of POD modes at  $Re=100$,
 $m_{r}=2.6$ and
 $U_{r}=5.0,4.0$ (plain cylinder, fairing).
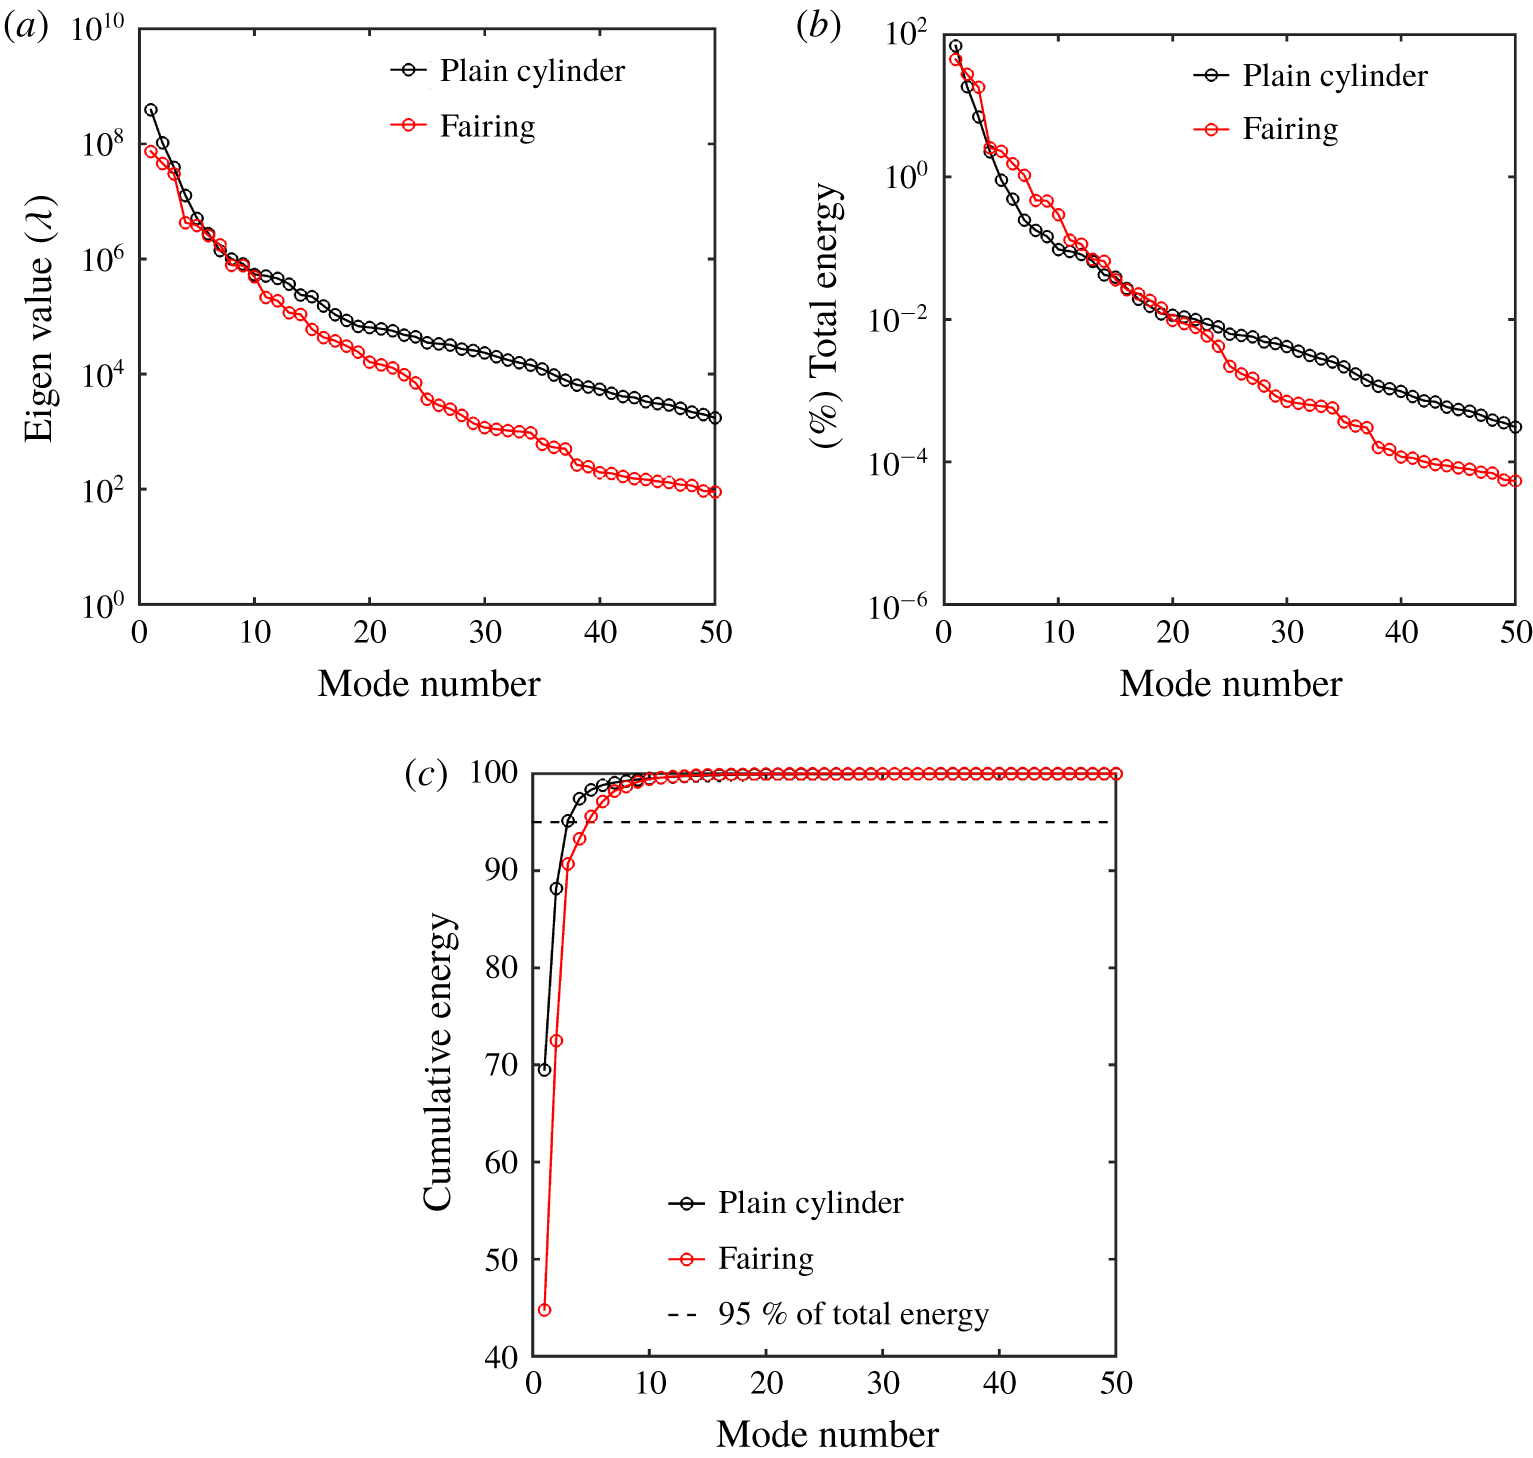
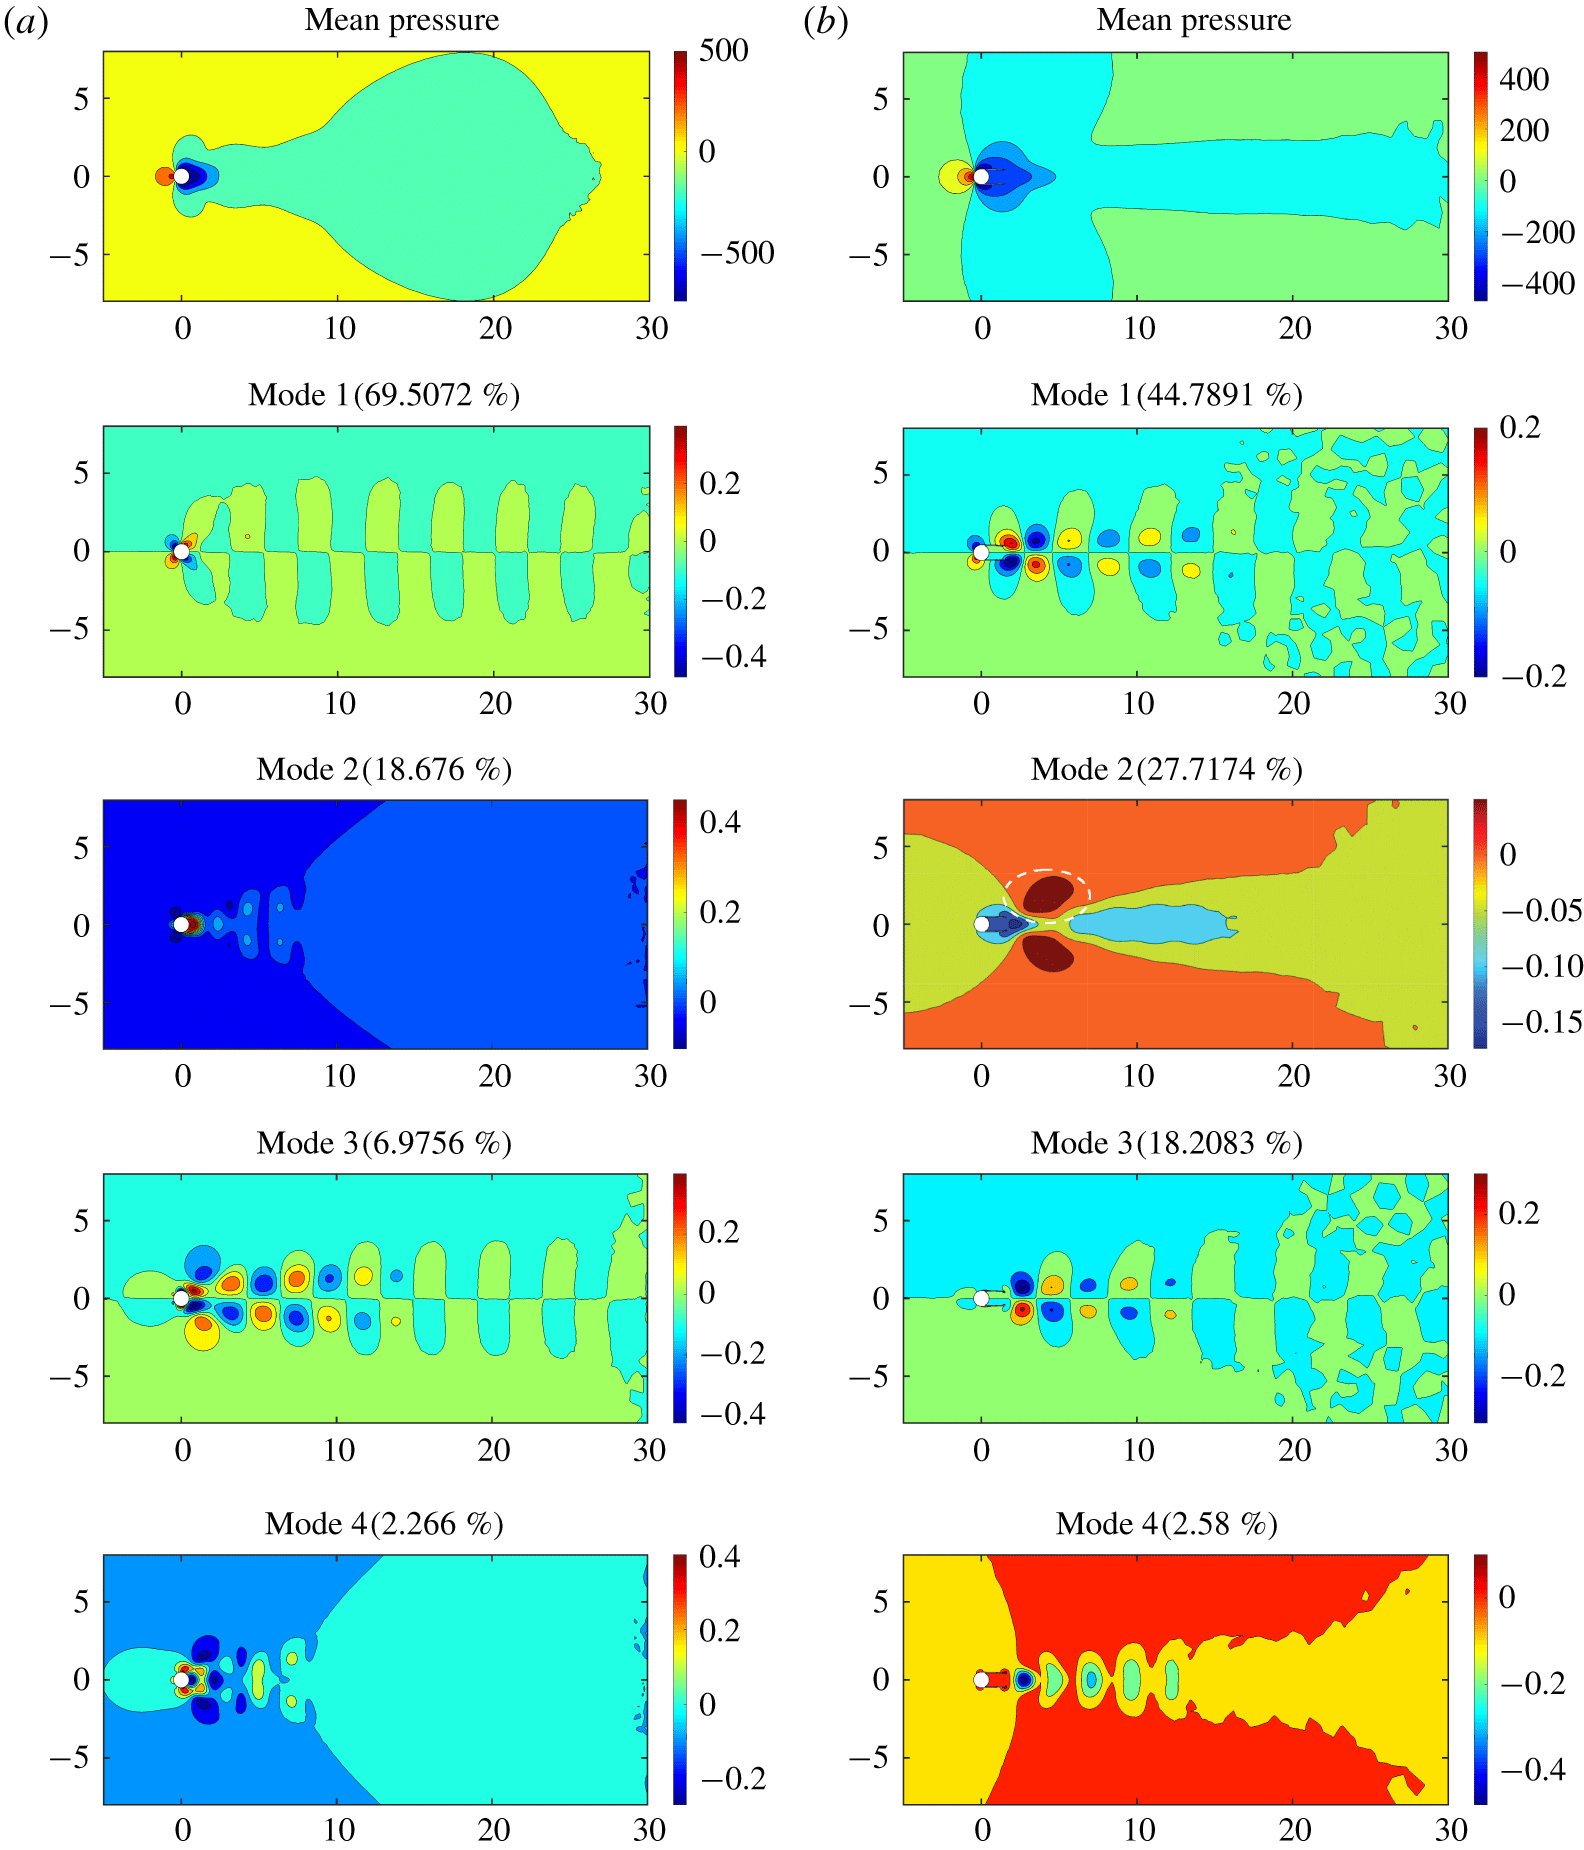
Since the mean pressure distribution is initially removed from the pressure field, the relative strength of the mode directly expresses the contribution from each mode for the pressure fluctuations. Figure 9(b) displays the strength of these modes normalized by the total strength of the 350 modes. It is evident that this strength decays exponentially in both the plain cylinder and the fairing. The cumulative strength plot given by figure 9(c) indicates that around 70 % of the strength is concentrated in the first mode in the case of the plain cylinder and around 45 % of the strength in the first mode for the fairing. In fact, over 95 % of the strength is concentrated in the first three and four modes for the plain cylinder and the fairing, respectively. Figure 9(a) outlines the absolute eigenvalue without any normalization for a direct comparison between the plain cylinder and the fairing. There is a clear reduction in the magnitude of the eigenvalues obtained for the fairing when compared to the plain cylinder, and this indicates the presence of lower strength levels in the fluid–structure system. The lower modal strength for the case of the fairing configuration might be viewed as a natural consequence of the suppression mechanism, whereby the presence of a suppression device such as a fairing in this case prevents the interaction between the wake features (e.g. vortex shedding and near wake) and breaks the self-sustenance behaviour in the wake interaction cycle. However, further analysis is required to show a rigorous correlation between the decrease in the modal strength with the missing wake interaction due to the fairing.
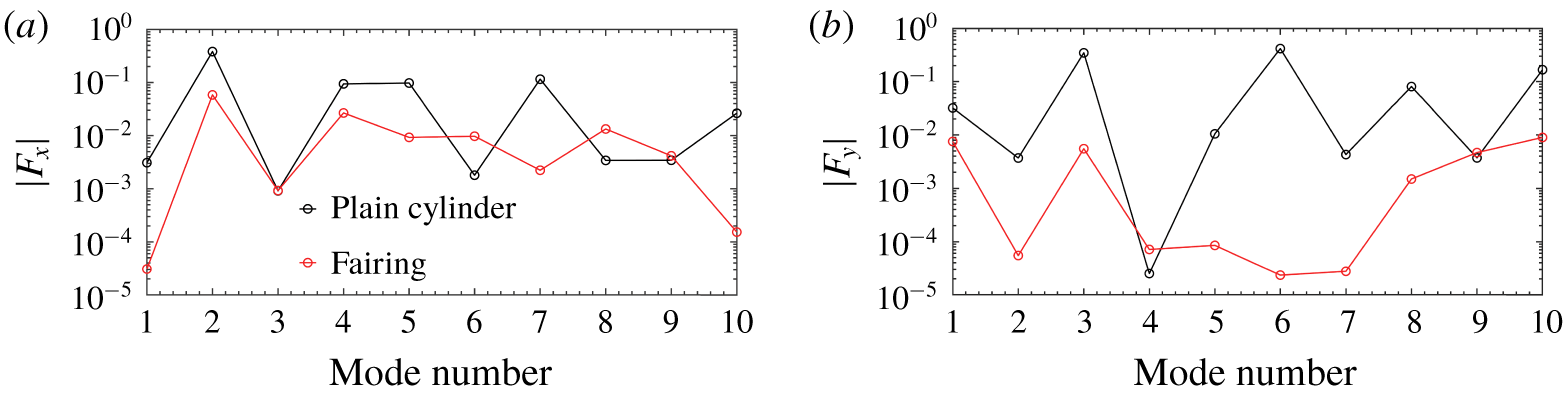
Figure 10 quantifies the logarithmic absolute value of the time-independent pressure fluctuation contribution from each mode to drag  $(|F_{x}|)$ and lift
 $(|F_{y}|)$. The contribution of modal forces is lower in the case of the fairing when compared to the plain cylinder for all the significant modes. Considering the first four significant modes, the contribution to the lift is from modes 1 and 3, and modes 2 and 4 contribute towards the drag force. This result is another demonstration of the quantification of the suppression mechanism created by the presence of the fairing in terms of the reduction in the modal force contributions.
Logarithmic contribution from each mode for the plain cylinder and the cylinder with fairings: (a) absolute inline force  $|F_{x}|$, and (b) cross-flow force
 $|F_{y}|$ at
 $Re=100$,
 $m_{r}=2.6$ and
 $U_{r}=5.0,4.0$ (plain cylinder, fairing).

Comparison of the mean field and the first four significant modes of the plain cylinder and the cylinder with fairings at  $Re=100$,
 $m_{r}=2.6$ and
 $U_{r}=5.0,4.0$ (plain cylinder, (a); fairing, (b)) (lock-in region). The strength contribution of each mode in both cases is given in parentheses. The white dashed line in mode 2 of the cylinder–fairing case indicates the shear layer region.

The mean pressure distribution and the first four significant POD modes are shown in figure 11 for both the plain cylinder and the fairing at lock-in conditions. The mean field is symmetric around the  $X$-axis or the wake centreline. This is expected, as the time-averaged distribution of a flow past a stationary symmetrical bluff body should be symmetrical. Modes 2 and 4 are also nearly symmetric around the wake centreline, while modes 1 and 3 are nearly antisymmetric, with equal values and opposite sign about the wake centreline. There is reasonable evidence that the first and third modes correspond to the von Kármán vortex street with alternating positive and negative pressure regions about the
 $X$-axis and the pressure contours resulting from the staggered vortex street. The high-transverse-gradient behaviour observed in mode 2 in the near-wake region suggests that it represents the contribution from the shear layer. The fourth mode originates from the near-wake region and diffuses symmetrically towards the far wake and can be attributed to the near-wake bubble and its interaction effects. The characterization of modes 1, 2, 3 and 4 into the vortex shedding, the shear layer and the near wake is applicable in both configurations of the plain cylinder and the fairing. The normalized strength contribution of each mode is presented in figure 11 for both the plain cylinder and the fairing configurations, respectively. Further details on the mode characterization can be found in Miyanawala & Jaiman (Reference Miyanawala and Jaiman2019).
In both cases, the dominant mode is due to vortex shedding. However, its contribution with the fairing is reduced when compared to the plain cylinder. Figure 7(c) displays the normalized maximum transverse amplitude for the plain cylinder and the fairing. There is an apparent reduction in the amplitude for the case of the fairing, and the close proximity of shedding frequency  $f_{vs}=0.22$ to cylinder frequency
 $f_{s}=0.25$ at
 $U_{r}=4$ suggests a lock-in condition, i.e. the vortex shedding frequency approaches the oscillating frequency of the bluff body. This may be the reason why vortex shedding is the dominant mode in the case of the fairing. Although vortex shedding is dominant, the lower strength of the mode can be attributed to a disconnect between vortex shedding and the near wake due to the fairing. This is also manifested in the reduction of the transverse amplitude at the lock-in condition. As mentioned earlier during the self-sustenance wake interaction cycle, the shear layer extension in the case of the fairing can be observed in the second mode.
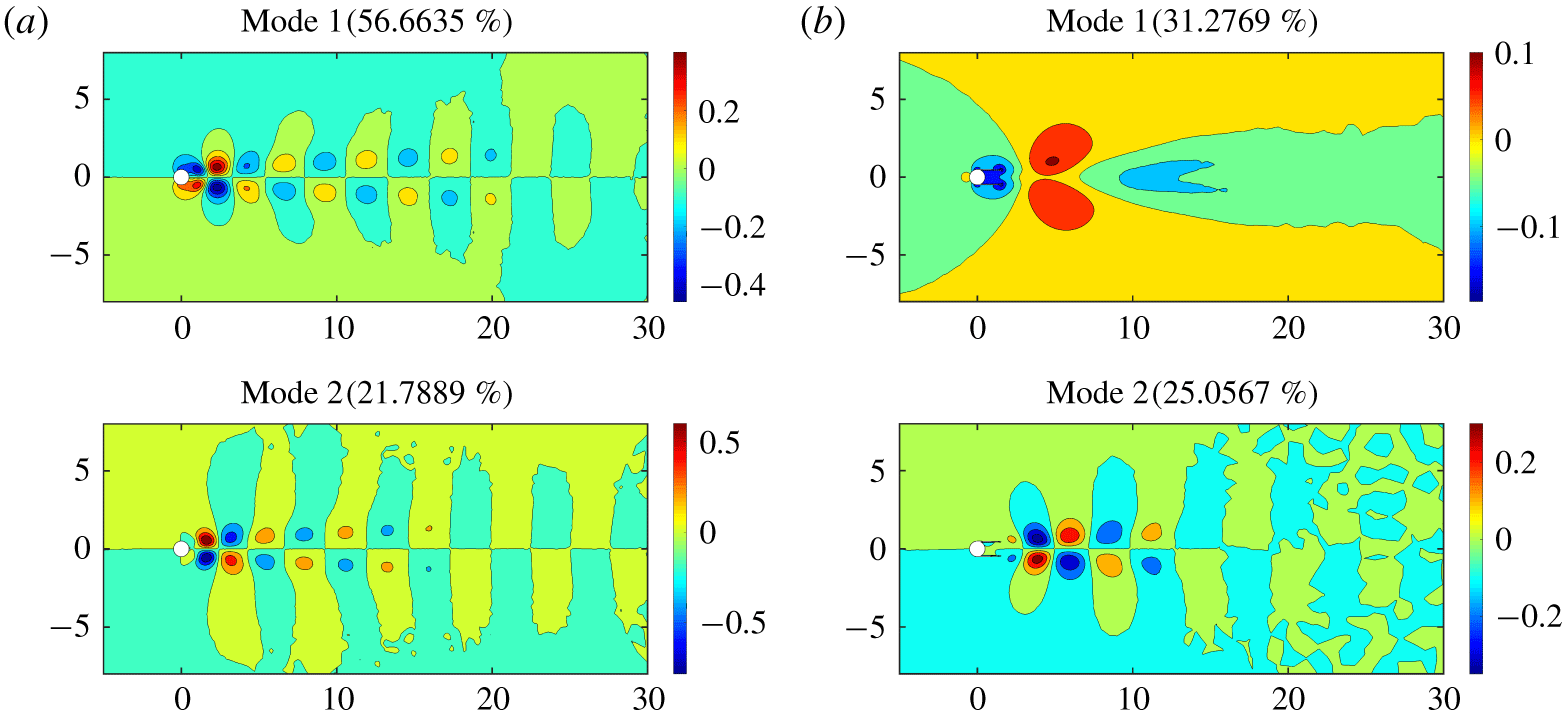
Comparison of the first two significant modes for (a) the plain cylinder and (b) the cylinder with fairings at  $Re=100$,
 $m_{r}=2.6$ and
 $U_{r}=2.0$ (pre-lock-in region). The strength contribution of each mode in both cases is given in parentheses.

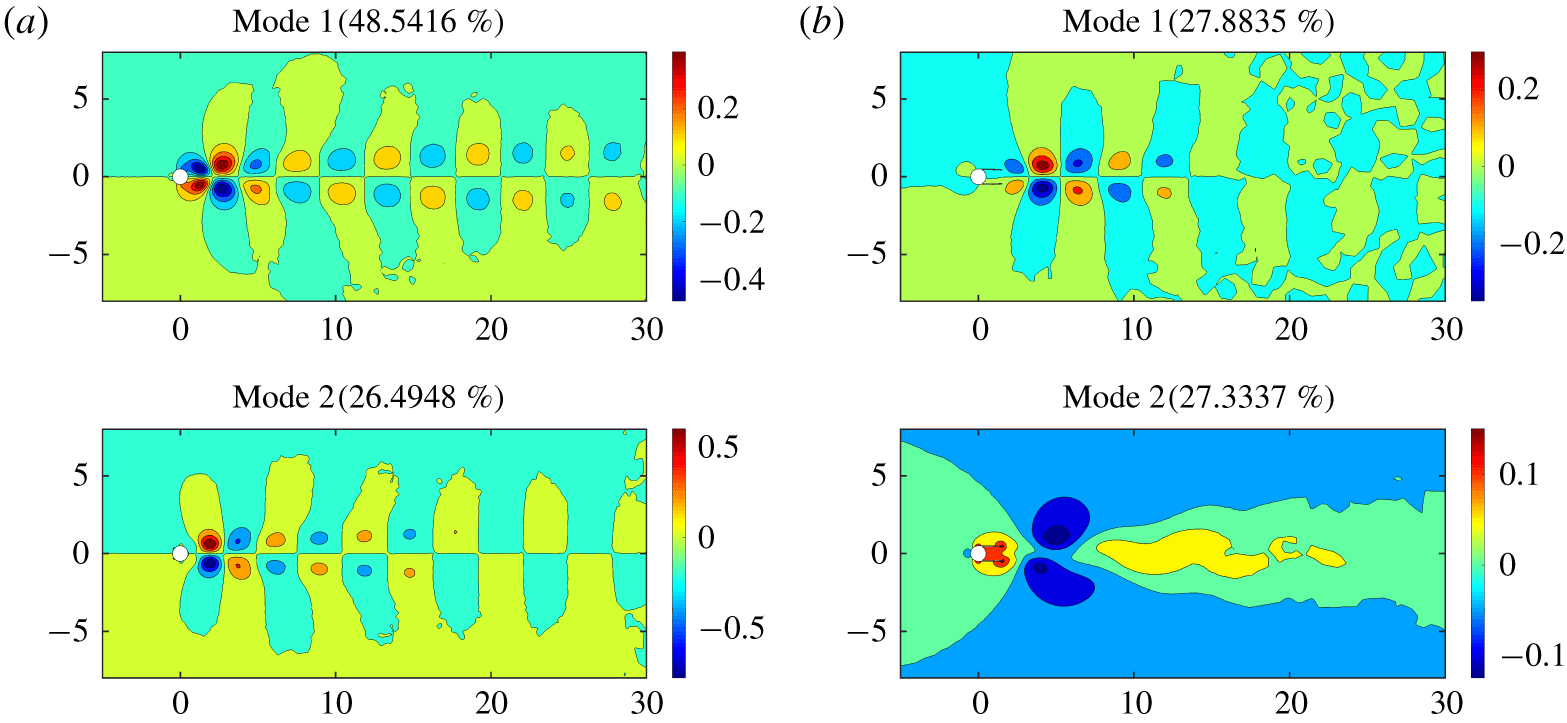
The dominant mode for the plain cylinder in the pre-lock-in region comes from vortex shedding, which is depicted in figure 12(a). In the case of the fairing, it shifts to the shear layer and the vortex shedding is second most dominant. Owing to the lower vibration of a bluff body in the pre-lock-in region for the case of the fairing, the energy transfer from the shear layer to vortex shedding is reduced, thereby resulting in the shear layer being dominant. The post-lock-in results are similar to the case of the plain cylinder with the vortex shedding being superior. In the case of the fairing, both the shear layer and vortex shedding are almost equal in terms of the strength contribution, while vortex shedding is slightly higher than the shear layer (figure 13). This result indicates that at much higher  $U_{r}$ the vortex shedding will recover to be the dominant mode for the fairing.
In this section, the modal decomposition of wake features is presented for both the plain cylinder and fairing configurations. The distinction observed in the ERA-based ROM between the plain cylinder and the fairing is supported by detailed physical insights into the suppression mechanism. The effect of the fairing on the self-sustenance of the wake interaction cycle is quantified through the strength and the force contributions from the POD modes. The results are presented across pre-lock-in, lock-in and post-lock-in regimes to demonstrate the variation in the interaction between the wake features. A disconnect between the vortex shedding and the near wake is observed due to the presence of the fairing.
Comparison of the first two significant modes for (a) the plain cylinder and (b) the cylinder with fairings at  $Re=100$,
 $m_{r}=2.6$ and
 $U_{r}=16.0$ (post-lock-in region). The strength contribution of each mode in both cases is given in parentheses.

4.3 Effect of other appendages
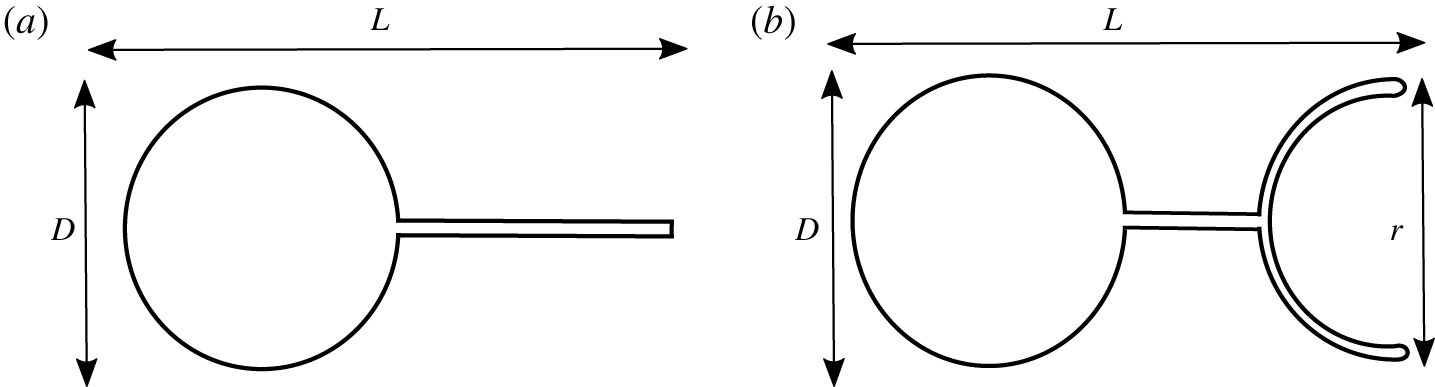
Schematic of other passive suppression devices: (a) splitter plate and (b) connected-C device.

The effect of appendages on the eigenspectrum of a cylinder–appendage system at  $Re=100$,
 $m^{\ast }=2.6$: (a) splitter plate, and (b) connected-C. Root loci as a function of
 $f_{s}$, where the unstable plain
 $\text{Re}(\unicode[STIX]{x1D706})>0$ is shaded in grey. Blue triangle represents the WM of the cylinder-alone system, i.e. it is the most unstable eigenvalue of the matrix
 $\unicode[STIX]{x1D63C}_{f}$. The SM is denoted by open circles and the WM is represented by filled circles in both cases. (c) Normalized maximum transverse amplitude for a plain cylinder, a splitter and a connected-C for a range of
 $U_{r}$ at
 $m^{\ast }=2.6$,
 $Re=100$.

Comparison of normalized transverse amplitude calculated from the FOM for a cylinder–appendage system with a plain cylinder.

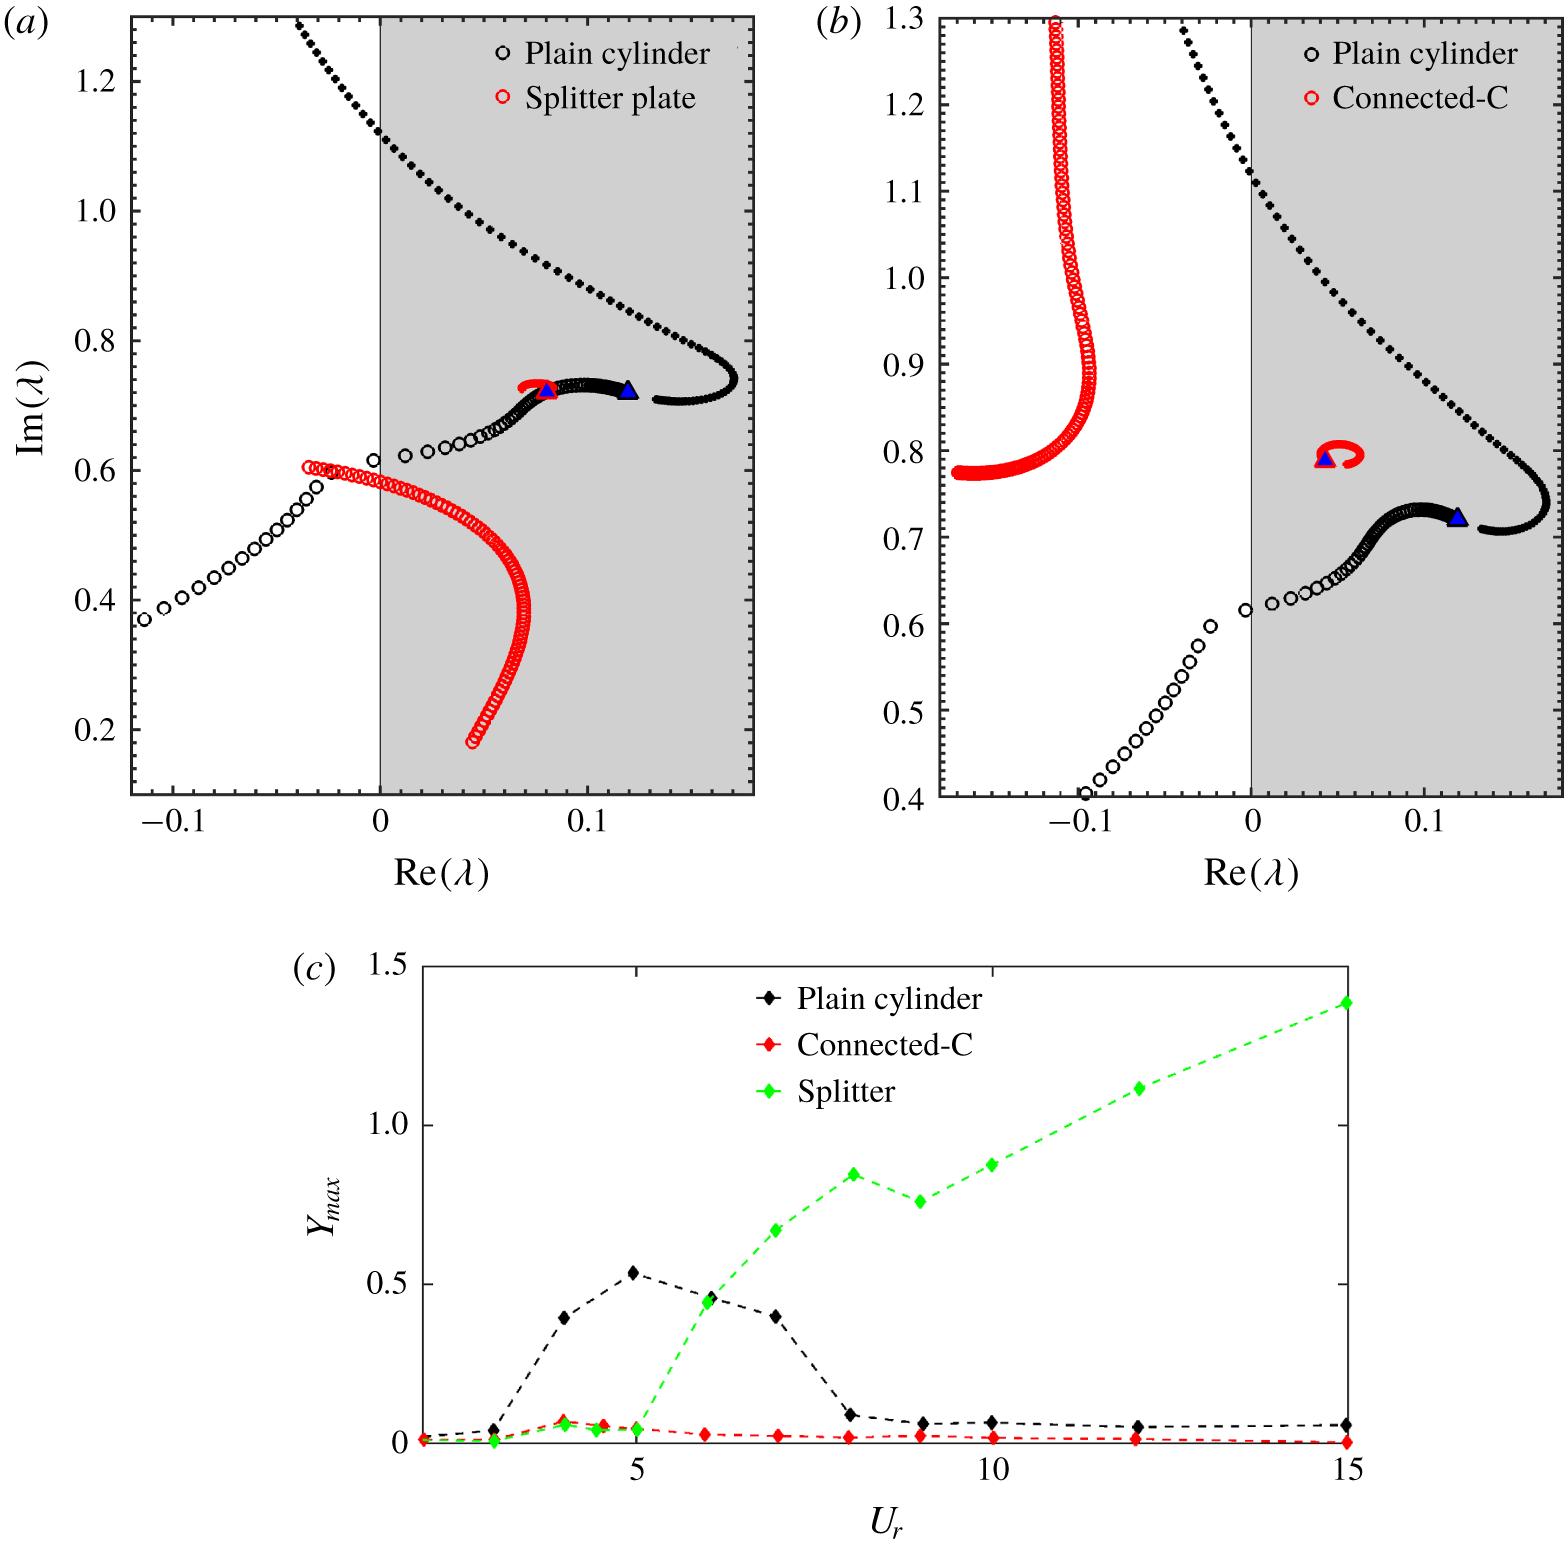
The stability analysis via the ERA-based ROM is further applied to other cylinder–appendage systems and presented in this section. The configurations of the appendages considered for the purpose of the current study include the splitter plate and the connected-C. The schematics of these appendages are presented in figure 14. While figure 14(a) displays a standard splitter plate, the connected-C portrayed in figure 14(b) consists of two geometric components, namely a splitter plate-like connector and a C-shaped foil with radius  $r$. The characteristic longitudinal length of both appendages is denoted by
 $L$ and the diameter of the cylinder is represented by
 $D$. The mesh configuration similar to M3 is used for these cases with slight modifications.
The same process is followed to construct the ERA-based ROM for both cylinder–appendage systems. Figure 15 displays the eigenvalue trajectories of both splitter and connected-C in comparison with the plain cylinder. All the results are plotted at  $Re=100$ and
 $m^{\ast }=2.6$. Similar to the notation used in the previous section, the filled symbols denote WM, and hollow symbols represent SM. The behaviour of the connected-C device is similar to that of the fairing. The SM is completely shifted into the stable region due to the presence of the connected-C, and the trajectory of the SM in the case of the connected-C is identical to the one with the fairing. The WM is present in the unstable region and is a clear indication of the presence of vortex shedding due to wake instability. In the case of the splitter plate, as depicted in figure 15(a), the SM is not completely stable and goes into the unstable region at
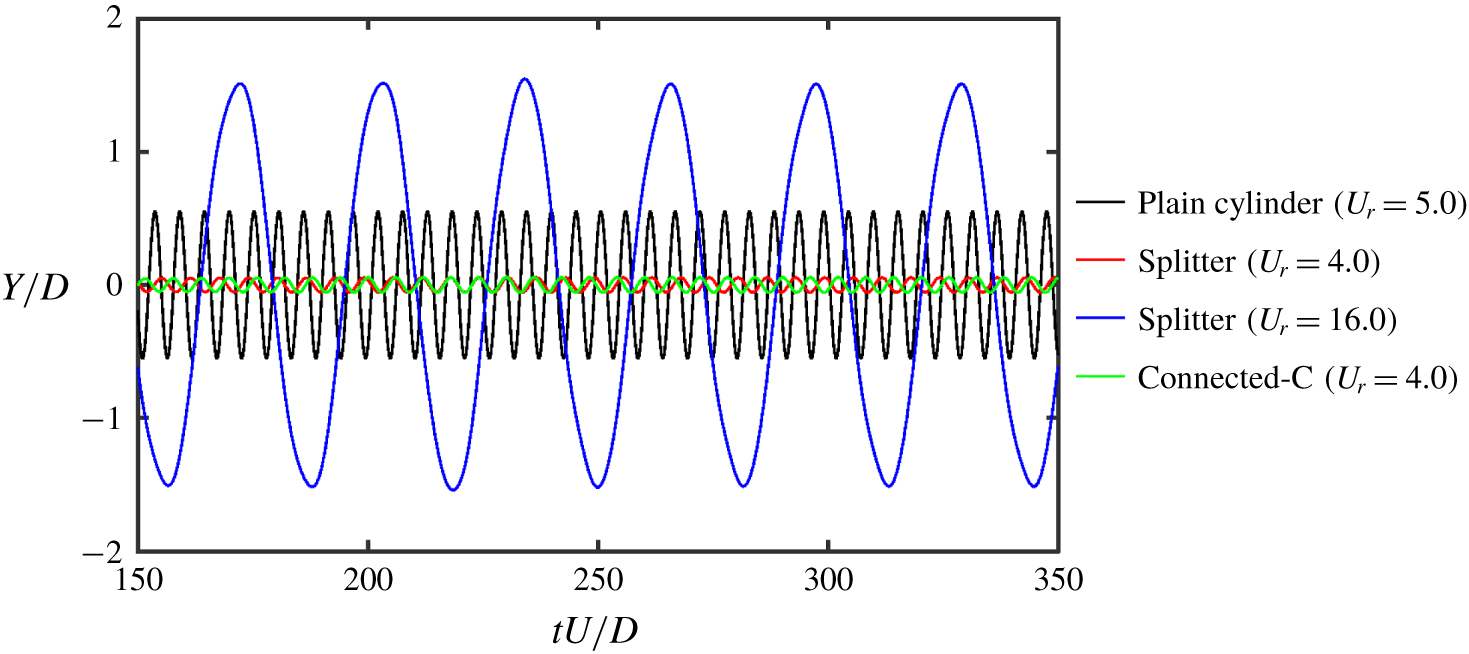
 $f_{s}=0.22,~U_{r}=4.54$ and remains in that state, indicating a galloping instability. The FOM results displayed in figure 15(c) also corroborate the above observation. It is worth noting that the ERA-based ROM is able to accurately capture the onset of galloping instability in the case of the splitter plate. As expected, the WM is located completely in the unstable region for the case of the splitter, indicating the presence of wake instability. In figure 16, the time histories of normalized transverse vibration
 $Y/D$ calculated from the FOM for both splitter and connected-C are compared with the plain cylinder in lock-in and galloping conditions. The suppression of transverse vibration as pointed out by the ERA-based ROM through the stability of SM is clearly reflected in the FOM calculations. The effect of galloping by the splitter has resulted in a sharp increase in the amplitude compared to the plain cylinder, which is clearly evident in figure 16.
Eigenvalues of streamwise velocity  $(u)$ POD modes for the plain cylinder
 $(U_{r}=5.0)$ and the cylinder–appendage systems: connected-C
 $(U_{r}=4.0)$, splitter plate
 $(U_{r}=4.0)$ and splitter plate
 $(U_{r}=16.0)$ at
 $Re=100$,
 $m_{r}=2.6$.

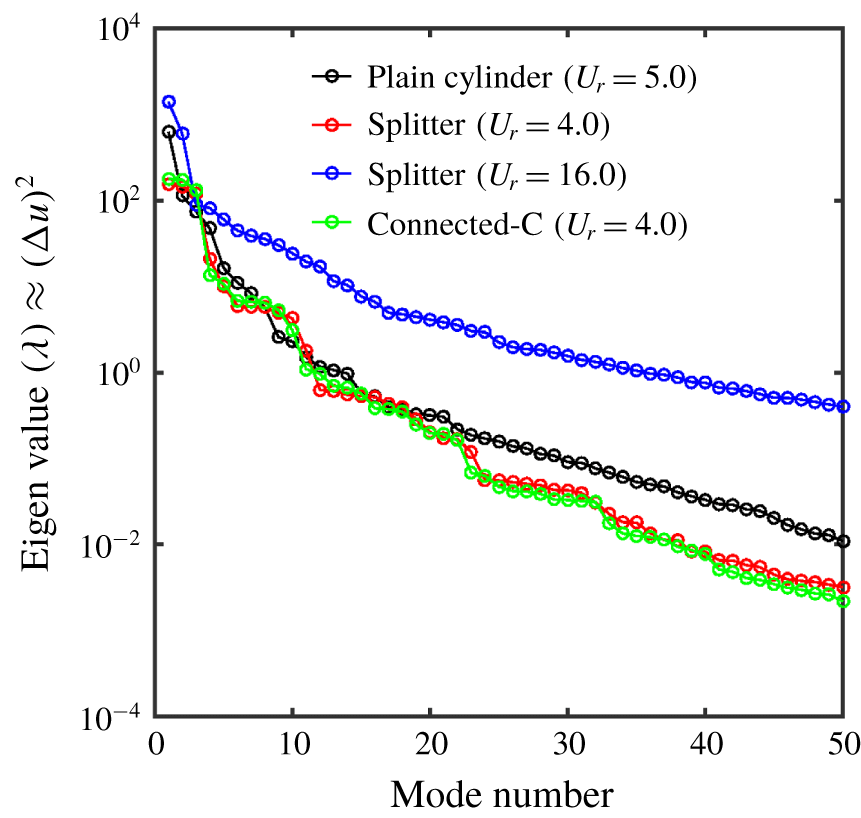
The eigenvalues calculated from the POD analysis quantify the quadratic contribution of the field variable considered in the analysis. To get an estimate of the kinetic energy from the different POD modes in the flow field, the streamwise velocity  $u$ is considered as the field variable for the POD analysis. Since the mean velocity is initially removed from the velocity field, the eigenvalue of each mode directly expresses the contribution from each mode to the kinetic energy fluctuations of streamwise velocity. The modal contributions to the kinetic energy fluctuations of streamwise velocity are plotted for the plain cylinder and the cylinder–appendage systems and is displayed in figure 17. There is a clear reduction in the kinetic energy fluctuations
 $\unicode[STIX]{x0394}u^{2}$ observed for the case of the connected-C and the splitter, as depicted in figure 17. The galloping instability for the case of the splitter at
 $U_{r}=16.0$ is clearly manifested in terms of the increase in the kinetic energy fluctuations of streamwise velocity.
4.4 Effect of characteristic dimensions
In this section, the effect of the characteristic dimensions of the cylinder–appendage systems is studied via the stability analysis of the ERA-based ROM. All the appendages have a characteristic longitudinal length denoted by  $L$, which is measured from the front of the cylinder to the end of the device. Apart from the longitudinal length, the other characteristic dimension of interest to the current study is the radius of the C-shaped foil
 $r$ in the case of the connected-C. A limited parametric study is carried out by varying the values of these characteristic dimensions to demonstrate the robustness of the stability analysis via the ERA-based ROM.
The effect of characteristic longitudinal length  $L$ on the eigenspectrum of the cylinder–appendage system at
 $Re=100$,
 $m^{\ast }=2.6$: (a) fairing and (b) splitter plate. The SM is denoted by open circles and the WM is represented by filled circles in both cases. Blue triangle represents the WM of the cylinder-alone system, i.e. it is the most unstable eigenvalue of the matrix
 $\unicode[STIX]{x1D63C}_{f}$.

The effect of characteristic dimensions  $L$ and
 $r$ on the eigenspectrum of the cylinder plus connected-C system at
 $Re=100$,
 $m^{\ast }=2.6$: (a)
 $r=0.95$,
 $L$ is varied; and (b)
 $L=2.0$,
 $r$ is varied. The SM is denoted by open circles and the WM is represented by filled circles in both cases. Blue triangle represents the WM of the cylinder-alone system, i.e. it is the most unstable eigenvalue of the matrix
 $\unicode[STIX]{x1D63C}_{f}$.

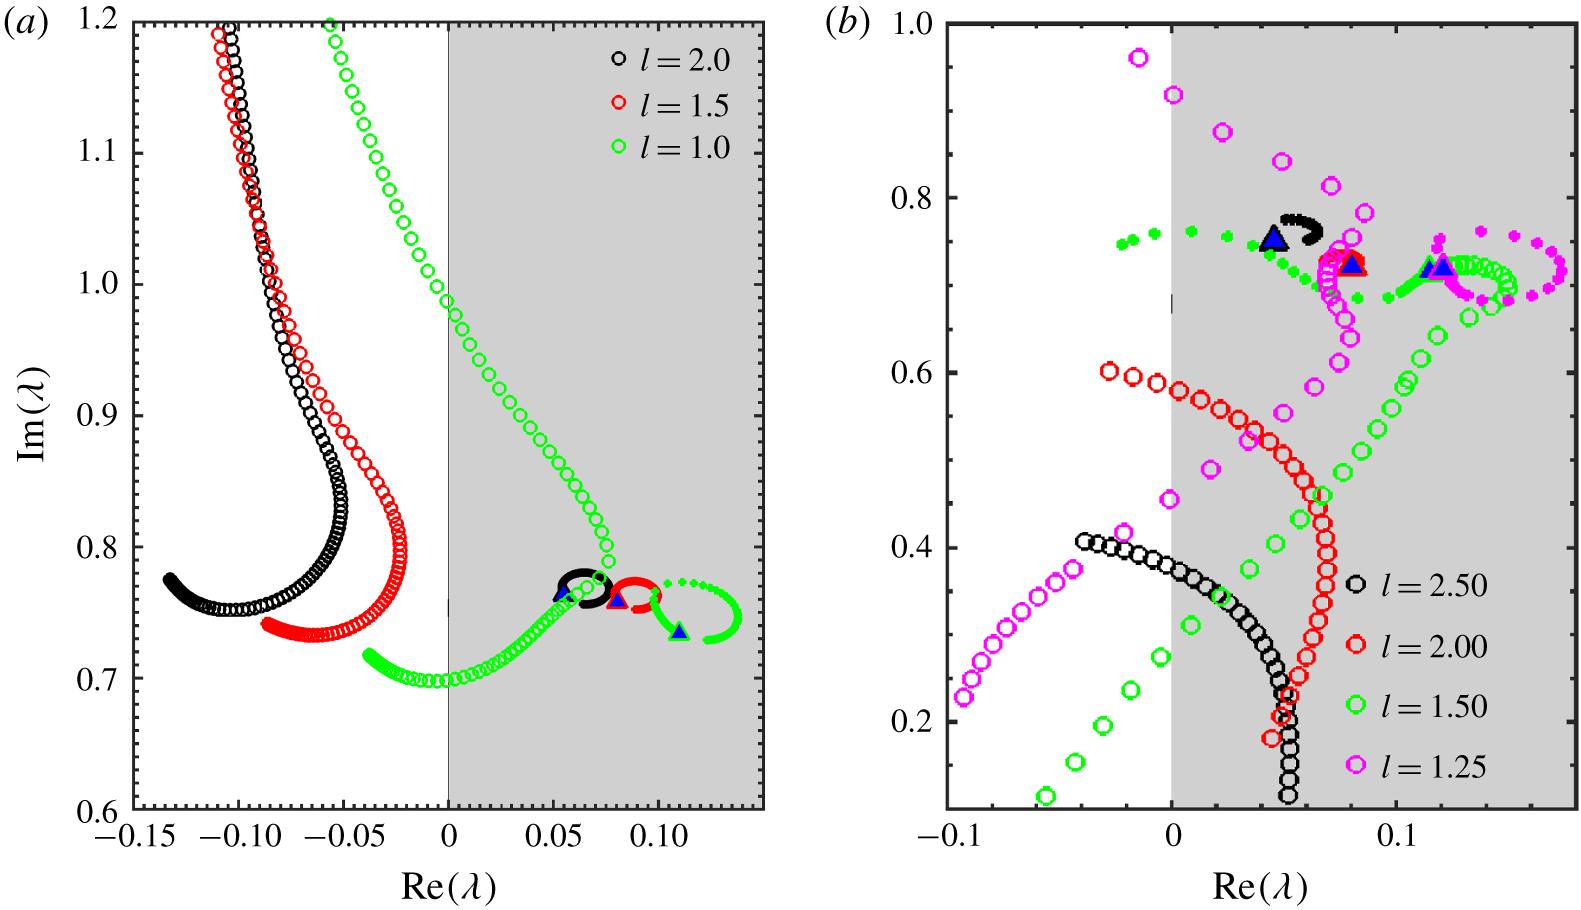
Three values of the characteristic longitudinal length  $L=\{1.0,1.5,2.0\}$ are considered for the fairing configuration, and the corresponding eigenvalue trajectories are calculated and displayed in figure 18(a). While the WM is completely located in the unstable region for all the cases as expected, the SM is fully stable for
 $L=2.0$ and
 $1.5$ and enters into the unstable region for a range of
 $f_{s}$ in the case of
 $L=1.0$. The SM is gradually shifted towards the unstable region as the characteristic longitudinal length is decreased. There will be a critical length in between
 $L=1.5$ and
 $1.0$ where the instability begins to appear for a small range of
 $f_{s}$.
Four values of the characteristic longitudinal length  $L=\{1.25,1.5,2.0,2.5\}$ are considered for the case of the splitter. Figure 18(b) portrays the eigenvalue trajectories for all the configurations. Galloping behaviour is observed in the case of the splitter when
 $L=2.0$ and
 $2.5$. In the case of
 $L=1.5$, the SM and WM coalesce and form a coupled mode, and the instability in the system is jointly sustained by this coupled mode for a range of
 $f_{s}$. The stability roles of SM and WM switch at a particular
 $f_{s}$. This is an indication of strong fluid–structure coupling for the splitter at this characteristic longitudinal length. As the length
 $L$ is further decreased to
 $1.25$, the cylinder–splitter system behaves as an isolated plain cylinder with weak fluid–structure interaction, which is prevalent from the distinct characterization of SM and WM. It is worth noting that the splitter plate exhibits a diverse behaviour for different values of
 $L$.
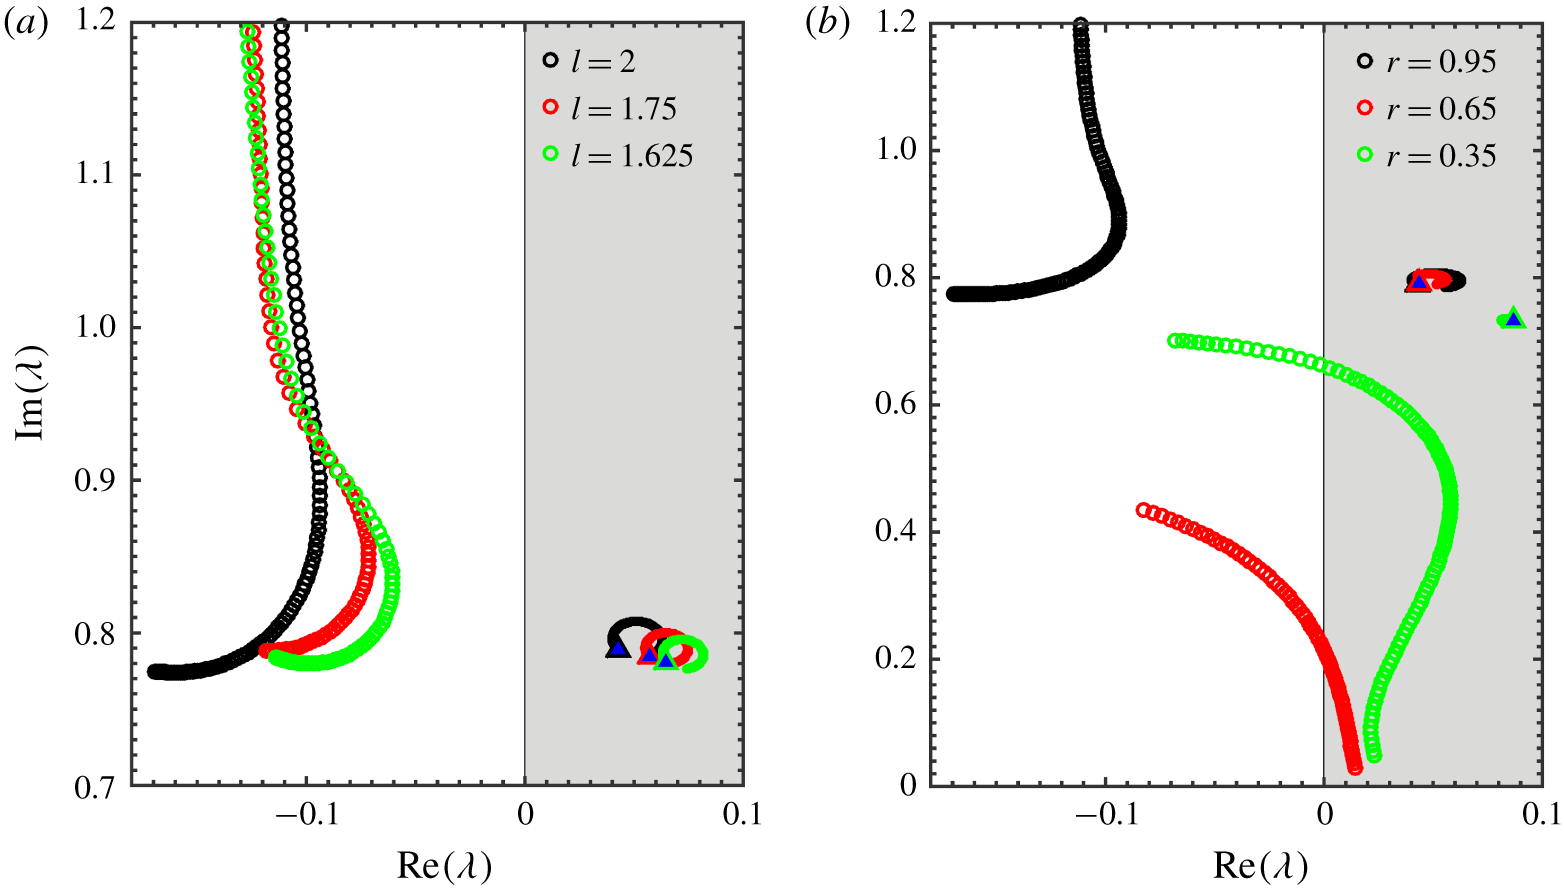
The connected-C device is described by two characteristic dimensions: longitudinal length  $L$, and radius
 $r$ of the C-shaped foil. The effect of longitudinal length
 $L=1.625,1.75,2.0$ is reported in figure 19(a). The radius of the C-shaped foil is fixed at
 $r=0.95D$ while varying
 $L$. The connected-C behaves similar to the fairing and the eigenvalue trajectories look identical. The SM is completely stable for all the values of
 $L$ considered and the WM is completely stable. Figure 19(b) depicts the effect of
 $r=0.95,0.65,0.35$ with longitudinal length fixed at
 $L=2.0$. The connected-C embodies the characteristics of the splitter at
 $r=0.65$ and
 $0.35$ by displaying a galloping behaviour. As
 $r$ is increased gradually to
 $0.95$, it achieves superior suppression by completely shifting the SM into the left half of the complex plane. It is intuitive to note that, as the radius of C-shaped foil in the connected-C tends to zero, the geometry of the connected-C naturally resembles the cylinder–splitter arrangement and therefore the galloping behaviour of the connected-C at low
 $r$ is recovered.
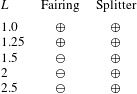
A stability function  $\unicode[STIX]{x1D6F7}$ is defined by considering the real part of the eigenvalue with maximum magnitude as
 $$\begin{eqnarray}\unicode[STIX]{x1D6F7}=\text{sgn}\{\text{max}[\text{Re}[\unicode[STIX]{x1D706}_{SM}(f_{s})]]\},\quad \forall ~f_{s},\end{eqnarray}$$
where  $\unicode[STIX]{x1D706}_{SM}(f_{s})$ corresponds to the eigenvalue of the SM at a given
 $f_{s}$. The output of the stability function is either
 $+$ or
 $-$, indicating instability/stability of the structural vibration. This function
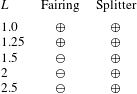
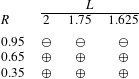
 $\unicode[STIX]{x1D6F7}$ serves as an indicator and also as a tool to assess the stability of the system. The values of this function for the fairing and the splitter are tabulated in table 3 for various characteristic lengths
 $L$. The effect of
 $L$ and
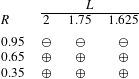
 $R$ on the stability function for the connected-C is outlined separately in table 4. By defining such a general stability function based on the SM, it is possible to construct an assessment of the given parameter space. The effect of other structural parameters such as the mass ratio
 $m^{\ast }$ and the damping ratio
 $\unicode[STIX]{x1D701}$ can also be assessed with minor computational efforts.
Stability function  $\unicode[STIX]{x1D6F7}$ for fairing and splitter at various characteristic lengths
 $L$. Here
 $\oplus$ indicates the presence of instability in the structural vibration and
 $\ominus$ represents complete suppression of vibration.
5 Conclusions
A stability analysis of passive suppression of VIV has been presented in this work. A data-driven approach based on the eigensystem realization algorithm (ERA) was used to construct the reduced-order model (ROM). The ERA-based ROM was successfully applied to study the laminar wake behind the stationary cylinder–fairing arrangement. The critical Reynolds number for this case calculated from the ERA-based ROM was found to be  $Re_{cr}=68.5$, which agreed well with the FOM results.
The performance of the ERA-based ROM in identifying the suppression due to the fairing was investigated by comparing the eigenspectrum of the plain cylinder. The presence of the fairing shifted the structure mode (SM) completely into the left half of the complex plane, indicating a clear suppression of transverse vibration at both high- and low-mass-ratio conditions. The full-order model (FOM) results also support the ERA-based ROM predictions by reporting a clear reduction in the normalized transverse amplitude. The instability of the wake mode (WM) observed in the eigenspectrum, which characterizes the periodic vortex shedding in the system, did not hinder the suppression achieved by the fairing. Therefore, complete wake stabilization is not necessary for the suppression of the structural vibration in fluid–structure systems. The problem of suppression can be characterized into shifting the SM from the unstable to the stable region.
Stability function  $\unicode[STIX]{x1D6F7}$ for connected-C at various
 $L$ and
 $R$.
The occurrence of suppression, albeit in the presence of wake instability, was explained via the effect of the fairing on self-sustenance of the wake interaction cycle. The presence of the fairing creates a disconnect between the vortex shedding and the near wake, thereby breaking the self-sustenance of the wake–body interaction cycle. This results in the stable near-wake environment manifesting in the suppression of transverse vibration. The effect of the fairing on the complex interaction between the wake features is quantified through the energy and the force contribution from the POD modes. The results from the POD analysis further provide physical insights into the distinction observed in the ERA-based ROM between the plain cylinder and the cylinder–fairing system. The results from the POD analysis are presented across pre-lock-in, lock-in and post-lock-in regimes to highlight the differences of interaction between the wake features.
The effect of other appendage configurations, such as a splitter and a connected-C, was discussed. The behaviour of the connected-C is found to be similar to that of the fairing. Galloping behaviour is exhibited by the splitter at higher  $U_{r}$. The geometry of the connected-C naturally resembles that of the splitter at lower
 $r$. It is intuitive to expect a similar galloping behaviour at lower
 $r$ for the connected-C, and the ERA-based ROM is able to identify such phenomenon. The diversified behaviour of the splitter at lower
 $L$ (1.5, 1.25) and higher
 $L$ (2.0, 2.5) was also reported from the stability analysis. A general stability function
 $\unicode[STIX]{x1D6F7}$ was introduced to assess the stability of the fluid–structure system.
Overall, the stability analysis via the ERA-based ROM serves as an attractive alternative in identifying the lock-in regions for different suppression devices. The approach is data-driven and would be realizable in physical experiments. The modes SM and WM provided by the stability analysis encompass the effects of a complex interaction between wake features and behave distinctly for different geometries. The methodology provided in the current work is not limited to a single body and can be easily extended to multiple body arrangements. However, preliminary investigations in the case of side-by-side cylinder arrangement with a gap flow revealed the limitations of the current approach in terms of constructing a suitable ROM. Addressing these limitations is one of the main driving factors for future work. Currently, the suitability of the present approach for high-Reynolds-number cases has not been explored and will be the other direction to continue this work.
Acknowledgements
This work, done at the Keppel-NUS Corporate Laboratory, was supported by the National Research Foundation, Keppel Offshore and Marine Technology Centre (KOMtech) and the National University of Singapore (NUS). The conclusions put forward reflect the views of the authors alone and are not necessarily those of the institutions within the Corporate Laboratory.
Declaration of interests
The authors report no conflict of interest.