I. INTRODUCTION
Light-weight, high-strength structural materials have been intensively studied due to the increasing requirement to improve fuel efficiency, especially for the transportation industry. Aluminum (ρ = 2.7 g/cm−3) and magnesium (ρ = 1.7 g/cm−3) are among the lightest monolithic metals and attract significant interest in research community.Reference Hirsch1,Reference Hirsch and Al-Samman2 However, both Al and Mg have low modulus and low yield strength.Reference Hirsch1,Reference Hirsch and Al-Samman2 Several strategies have been developed to strengthen Al alloys, including grain boundary and solid solution strengthening, work hardening, and precipitation strengthening. A conventional approach to strengthen 7××× series Al alloys is precipitation hardening, which has been widely used for aerospace industry.Reference Fine3 The extremely fine and homogeneous precipitates can block the slip of the dislocations and strengthen the materials.Reference Park and Ardell4 To achieve optimal precipitate strengthening condition, various heat treatment procedures have been developed.Reference Richard and Adler5–Reference Han, Cheng, Li, Wu and Zhang7 Another conventional strengthening mechanism for Al alloys is solid solution strengthening, which increases the friction stress for dislocation slip. Furthermore, solutes can also stall grain growth and change stacking fault energy (SFE),Reference Chowdhury, Sehitoglu, Maier and Rateick8–Reference Detor and Schuh13 which may alter deformation mechanisms in various ways.
There are extensive studies on bulk high-strength nanocrystalline (nc) Al and its alloys synthesized by severe plastic deformation techniques, such as ball milling, equal channel angular pressing (ECAP), and high pressure torsion.Reference Youssef, Scattergood, Murty and Koch10,Reference Zhao, Meng, Mao, Hu and Gottstein14–Reference Horita, Fujinami, Nemoto and Langdon17 Youssef et al.Reference Youssef, Scattergood, Murty and Koch10 successfully synthesized nc Al–5% Mg alloy with 740 MPa tensile strength using in-situ consolidation. Even higher tensile strength (1 GPa) was also reported by Liddicoat et al.Reference Liddicoat, Liao, Zhao, Zhu, Murashkin, Lavernia, Valiev and Ringer15 for the 7075 Al alloys with a hierarchical nanostructure. Besides severe plastic deformation techniques, electrodeposition and physical vapor deposition techniques have also been used to fabricate nc alloys.Reference Rupert, Trenkle and Schuh18,Reference Hu, Shi, Sauvage, Sha and Lu19 Although nanograins can lead to high strength, they often degrade the ductility.Reference Koch, Morris, Lu and Inoue20–Reference Valiev22 In comparison to conventional high energy GBs, twin boundaries (TBs) have been identified as a good candidate to achieve a synergy between good ductility and high strength.Reference Lu, Chen, Huang and Lu23–Reference Velasco and Hodge31 However, it is difficult to introduce high-density twins in Al or Al alloys because of their high SFEs.
Recently, Al with high-density growth twins has been fabricated by introducing nanotwinned (nt) Ag seed layersReference Bufford, Bi, Jia, Wang and Zhang32–Reference Zhang, Bufford, Wang and Liu34 using the magnetron sputtering technique. The epitaxial growth of Al on the Ag seed layer permits the extension of TBs into Al.Reference Bufford, Liu, Zhu, Bi, Jia, Wang and Zhang33 A systematic study on several twinned metallic multilayer systems results in two criteria for the formation of twins in high SFE metals by using seed layers.Reference Yu, Bufford, Chen, Liu, Wang and Zhang35–Reference Yu, Liu, Rios, Wang and Zhang37 First, the low SFE metals with high-density twins act as buffer layers to provide twin seeds; and the second criterion is coherency at the interface between the low SFE seed layer and high SFE metals to ensure that twins can be introduced through coherent layer interfaces.
In this study, we introduce nanotwins into AlMg films by DC magnetron sputtering with an Ag seed layer. By adding Mg solute, the mechanical strength of the nt AlMg films raises significantly due to the solid-solution and twin boundary strengthening. The modified Hall–Petch equation is used to describe the size-dependent strengthening in AlMg thin films. Flow stresses measured from in-situ micropillar compression tests correlate well with the hardnesses measured by nanoindentation technique. Furthermore, compression studies show that nt AlMg has an excellent strain hardening capability. Post-compression transmission electron microscopy (TEM) analyses were performed on the deformed pillars. The influence of solutes on twin formation and strengthening mechanisms are discussed.
II. EXPERIMENTAL TECHNIQUES
2 μm thick AlMg thin films were fabricated by using DC magnetron sputtering at room temperature on HF etched Si(111) substrates. High purity (99.99%) Al and Mg targets were used as deposition sources. The base pressure prior to depositions was ∼6 × 10⁻⁸ torr, and ultra-high purity Ar gas was injected into the chamber to maintain the plasma under 2 × 10⁻³ torr. AlMg alloys with various Mg compositions (1, 5, and 10 at.%) were deposited by tuning the deposition power. To stimulate the growth of twinned structure, an 80 nm thick Ag seed layer was depositedReference Bufford, Liu, Wang, Wang and Zhang25,Reference Bufford, Liu, Zhu, Bi, Jia, Wang and Zhang33 on substrates. The out-of-plane θ–2θ scan and pole figure studies were performed by using a PANalytical X’pert Pro material research diffractometer (PANalytical, Almelo, The Netherlands) with Cu Kα source. Chemical analyses were performed by energy dispersive spectroscopy (EDS) on a Tescan LYRA-3 field emission scanning electron microscope (TESCAN, Brno, Czech Republic). TEM specimens were prepared by mechanical grinding and fine polishing, followed by dimpling and low-energy Ar ion milling. The microstructures of the specimens were characterized by using an FEI Talos 200X analytical transmission electron microscope (FEI, Hillsboro, Oregon) operated at 200 kV. The hardnesses of films were tested by using a Fischerscope HM2000XYp instrumented nanoindenter (Fischer Technology Inc., Windsor, Connecticut) with a Vickers diamond indenter tip. 20 or more indentations were performed at each indentation depth. Micropillars were fabricated by using the focused ion beam technique in an FEI Quanta 3D dual-beam scanning electron microscope (FEI). The diameter and height of the pillars are ∼1000 and 2000 nm, respectively. The tapering angle is less than 2° to ensure reliable data analyses for the uniaxial compression tests. The in-situ micropillar compression tests were performed by using a Hysitron PI 88XR Picoindenter (Bruker, Eden Prairie, Minnesota) inside the same scanning electron microscope (SEM). At least three pillars were compressed for each sample to confirm the quality and reproducibility of the compression data. The force–displacement data were captured by using a piezoelectric actuator on the high-load capacitive transducer with a 0.3 nm/s average drift rate during the in-situ tests. The noise of the force and displacement is less than 8 µN and 1 nm. Each in-situ compression test was accomplished in ∼20 s to minimize the impact of thermal drift. The displacement and force drifts were subtracted from the original data to minimize the influence of experimental uncertainty.
III. RESULTS
A. Microstructures of the sputtered AlMg films
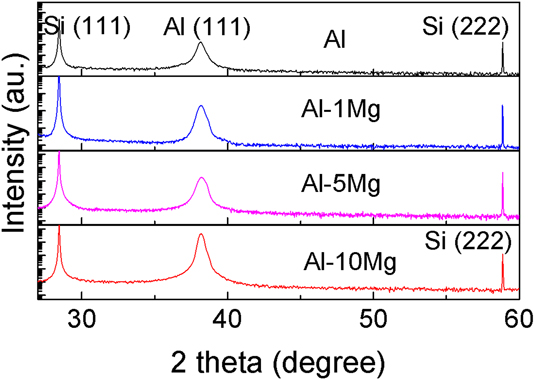
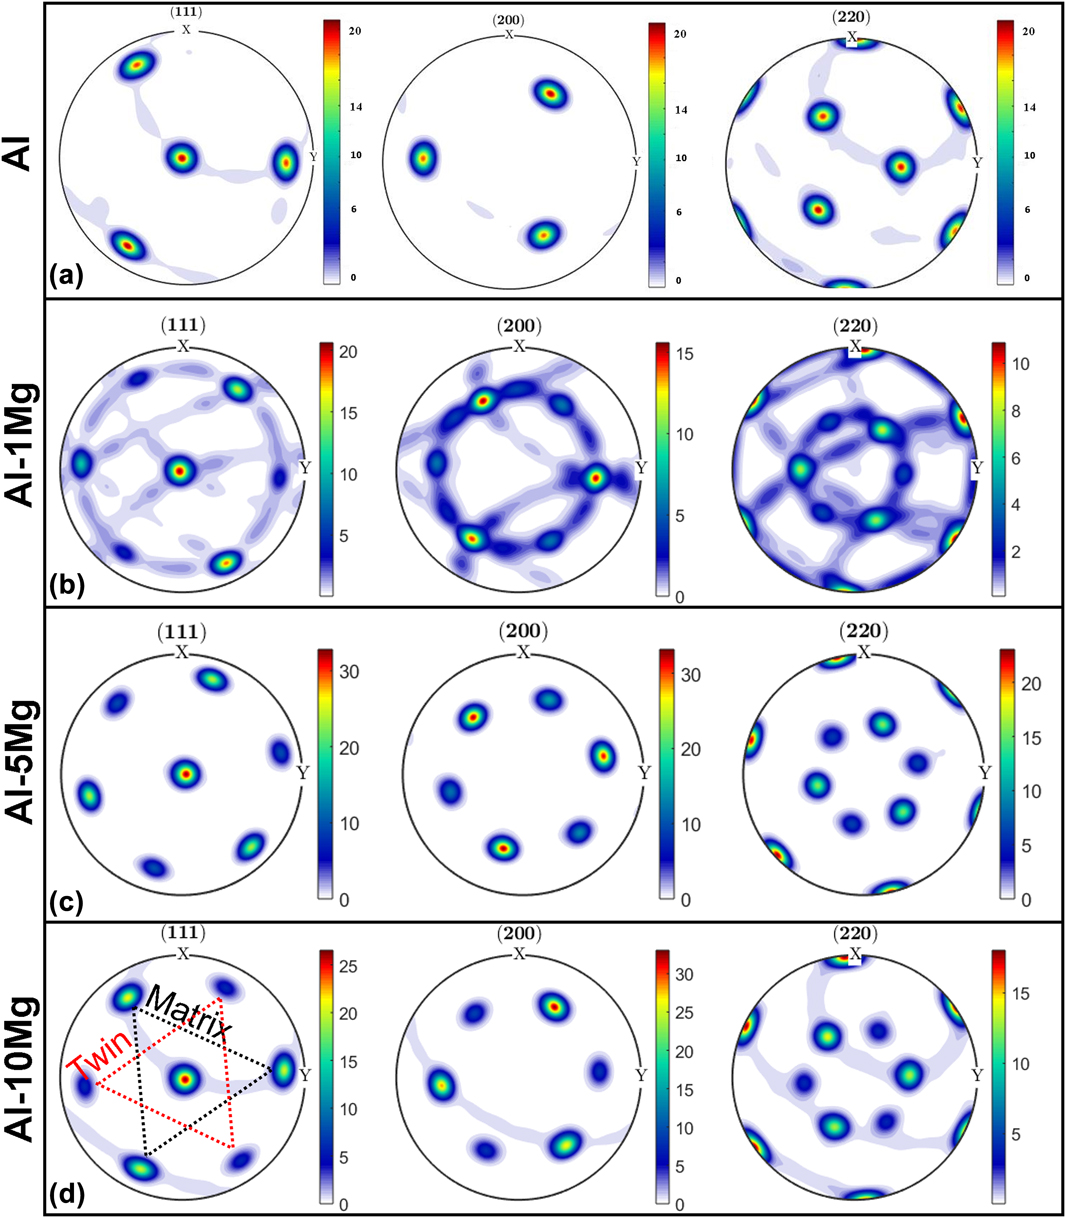
XRD profiles in Fig. 1 show that the 2 μm thick Al99–Mg1 at.% (referred to as Al–1Mg hereafter), Al–5Mg, and Al–10Mg films have the same (111) texture as pure Al thin films. To explore the crystal orientation of the films in detail, X-ray pole figure analyses have been performed. As shown in Fig. 2, the pole figures with distinctive spot patterns indicate the epitaxial structure of the films. The 3-fold symmetry of diffraction spots for face-centered cubic (FCC) Al in Fig. 2(a) indicates the formation of epitaxial Al without twins.Reference Li, Xue, Wang, Shao, Kwong, Giwa, Fan, Liu, Qi, Ding, Wang, Greer, Wang and Zhang30 The Al–1Mg film has three additional and weaker spots arising from twins, and the {111} pole figure also shows a minor (111) in-plane rotation. Increasing the Mg solute concentration (5 and 10 at.%) leads to a better epitaxial structure with stronger twin diffraction spots.
XRD profiles of Al–Mg thin films with various compositions and pure Al deposited on single-crystal Si(111) substrates. All films have (111) texture.

The XRD pole figures of sputtered Al and Al–Mg films. The projection plane is the sample surface. (a) Pure Al thin film [30]. (b) Al–1Mg thin film. (c) Al–5Mg film. (d) Al–10Mg thin film. The 6-fold symmetry of {111} pole figure suggests the formation of growth twins in Al–Mg alloys, in comparison to the 3-fold symmetry of pure Al.

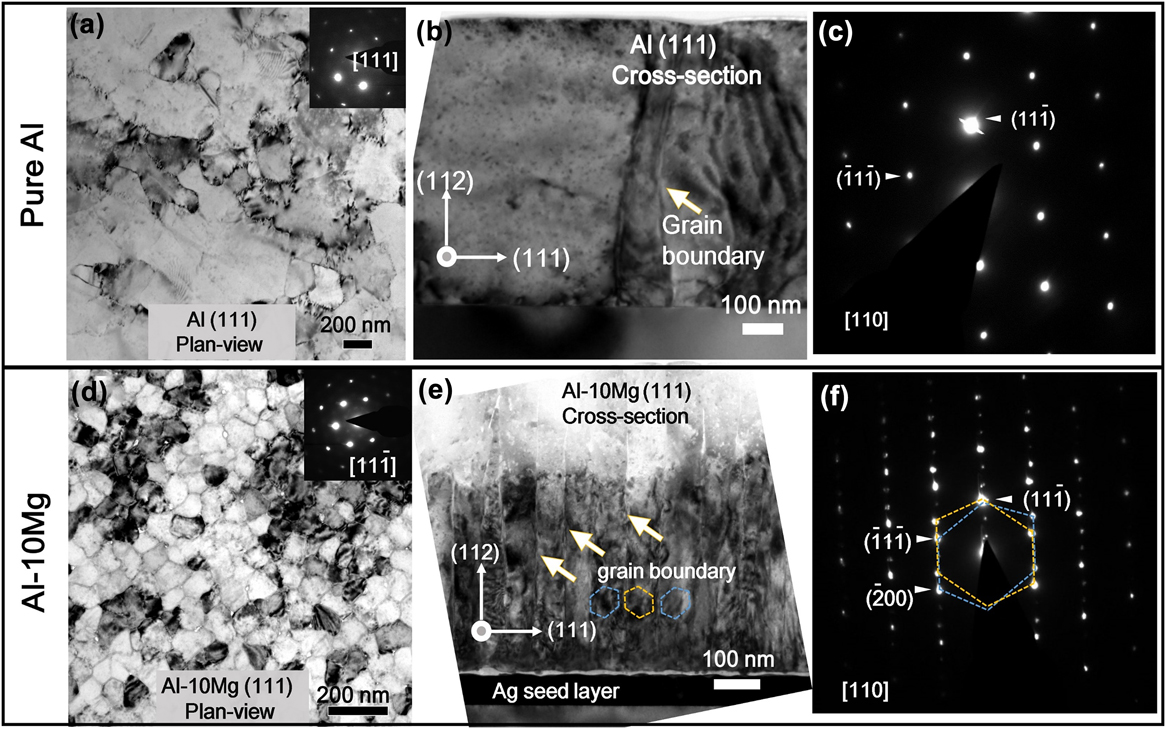
TEM micrographs in Figs. 3(a) and 3(b) reveal large grain size from plan-view and cross-sectional view for pure Al thin films. The diffraction pattern of the cross-sectional TEM micrograph in Fig. 3(c) shows the single-crystal-like structure, and thus indicates a low-angle grain boundary in Fig. 3(b). However, plan-view and cross-sectional TEM (XTEM) micrographs of Al–10Mg in Figs. 3(d) and 3(e) show nanoscale columnar grains separated by high-density Σ3 (112) incoherent twin boundaries (ITBs), as confirmed by the selected area diffraction (SAD) pattern in Fig. 3(f). The dark layer underneath the Al–Mg film [Fig. 3(e)] is the twinned Ag seed layer.
TEM images of pure Al and Al–10Mg thin films. (a) Plan-view TEM micrograph of Al showing the formation of large grains with single-crystal-like diffraction pattern. (b) Cross section TEM (XTEM) micrograph showing the large columnar grains. (c) The SAD pattern captured from (b) indicates the single-crystal like structure. (d) Plan-view TEM micrograph showing the formation of abundant grain boundaries with single-crystal-like diffraction pattern in Al–10Mg thin films. (e) XTEM micrograph showing columnar grain boundaries with an average grain size of 73 nm. (f) The SAD pattern of the XTEM specimen showing twinned pattern and extra spots arising from the formation of ITBs.

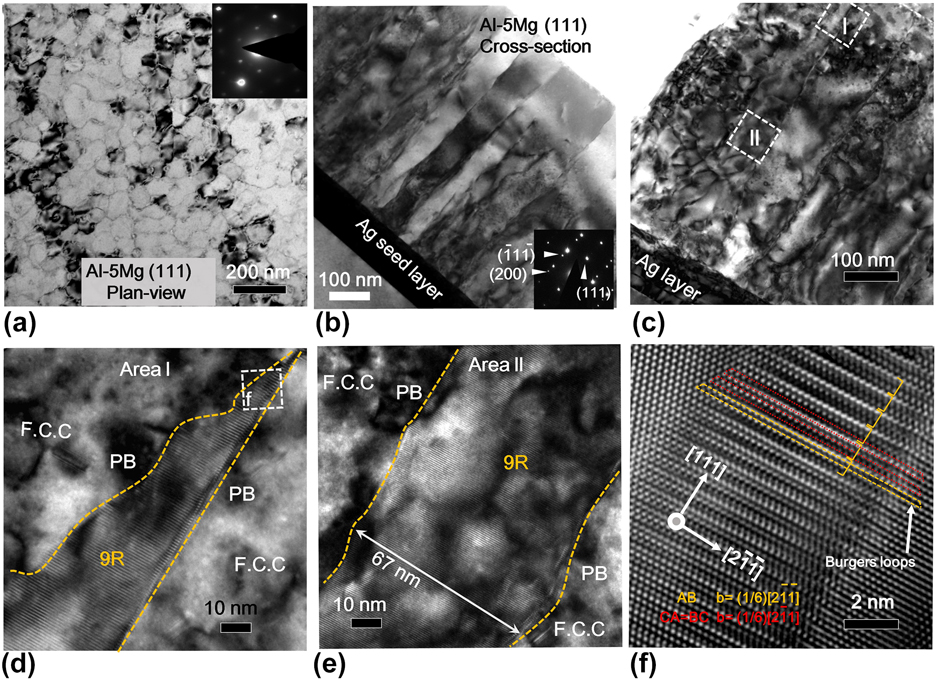
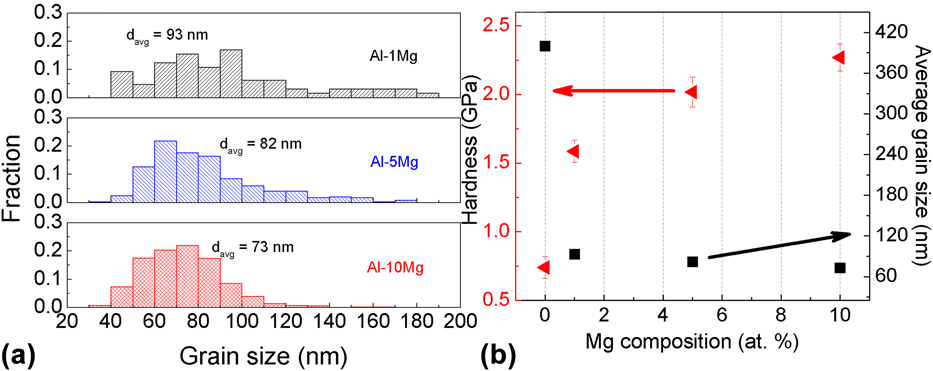
Al–5Mg film was selected to examine the formation of growth twins in detail. Homogenously distributed nanoscale grains can be observed from the plan-view TEM [Fig. 4(a)] and XTEM micrograph [Fig. 4(b)]. The high-density twinned structure forms as evidenced by the inserted SAD pattern in Fig. 4(b). The cross-sectional HRTEM micrograph in Fig. 4(c) captures a typical long ITB. Two locations (I–II) were selected along a typical ITB. The width of ITB changes through the film thickness. Near the film surface [region I in Fig. 4(d)], a broad ITB labeled as 9R phase is identified. And the broad 9R phase shrinks gradually to a straight narrow ITB as it propagates towards the film surface. The white dashed lines mark two phase boundaries (PBs) for the 9R phase, a straight PB1 and curved PB2. In region II, a 67 nm-wide 9R phase is identified in Fig. 4(e). A magnified image of the white box in Fig. 4(d) shows 9R stacking in Fig. 4(f). Dislocations associated with the 9R phase were measured by constructing Burgers circuits around the faulted regions. The Burgers vector is measured to be  ${a / 6}\left[ {2\bar{1}\bar{1}} \right]$, consistent with the pure edge partial dislocation. The Burgers vector for the BC and CA is measured to be a/6 〈211〉. Based on the model of 9R phase,Reference Medlin, Campbell and Carter38,Reference Wang, Misra and Hirth39 they correlate well with the projection of a 30° or 60° mixed partial dislocation examined along the [011] zone axis. These analyses confirm that the 9R phase contains two mixed partial dislocations and one pure edge partial dislocation on 3 adjacent {111} planes. Statistical distributions in Fig. 5(a) (based on the TEM micrographs) show that the average grain sizes for the Al–1Mg, Al–5Mg, and Al–10Mg films are 93, 82, and 73 nm, respectively.
TEM images of Al–5Mg thin film. (a) Plan-view TEM micrograph showing grain boundaries. The inserted SAD pattern showing the formation of epitaxial films. (b) An XTEM micrograph showing columnar grain boundaries, which are confirmed to be mostly ITBs by the inserted SAD pattern. (c) A low magnification XTEM micrograph showing the ITBs decorated with the 9R phase. Two boxes (I and II) are selected to magnify in (d) and (e). (d) The magnified view of area I shows that the width of 9R phase decreases closer to the film surface. (e) Box II shows a typical column containing the 9R phase, ∼67 nm, formed in the middle of the film. (f) An HRTEM image showing the 9R phase from box f in (d).

(a) Columnar grain size distributions of Al–Mg thin films show that the average grain size decreases from 93 to 73 nm with increasing Mg composition. (b) Hardness of Al–Mg films increases monotonically with Mg composition and reaches 2.2 GPa.

B. Mechanical properties of the AlMg thin films
The hardnesses of the AlMg thin films with different Mg compositions were tested by using nanoindentation. When 1 at.% Mg is added into the Al matrix, the film hardness increases to 1.6 GPa, comparing with the hardness of pure Al, ∼0.8 GPa. A greater Mg concentration leads to higher hardness, ∼2 GPa for Al–5Mg, and 2.3 GPa for Al–10Mg [Fig. 5(b)].
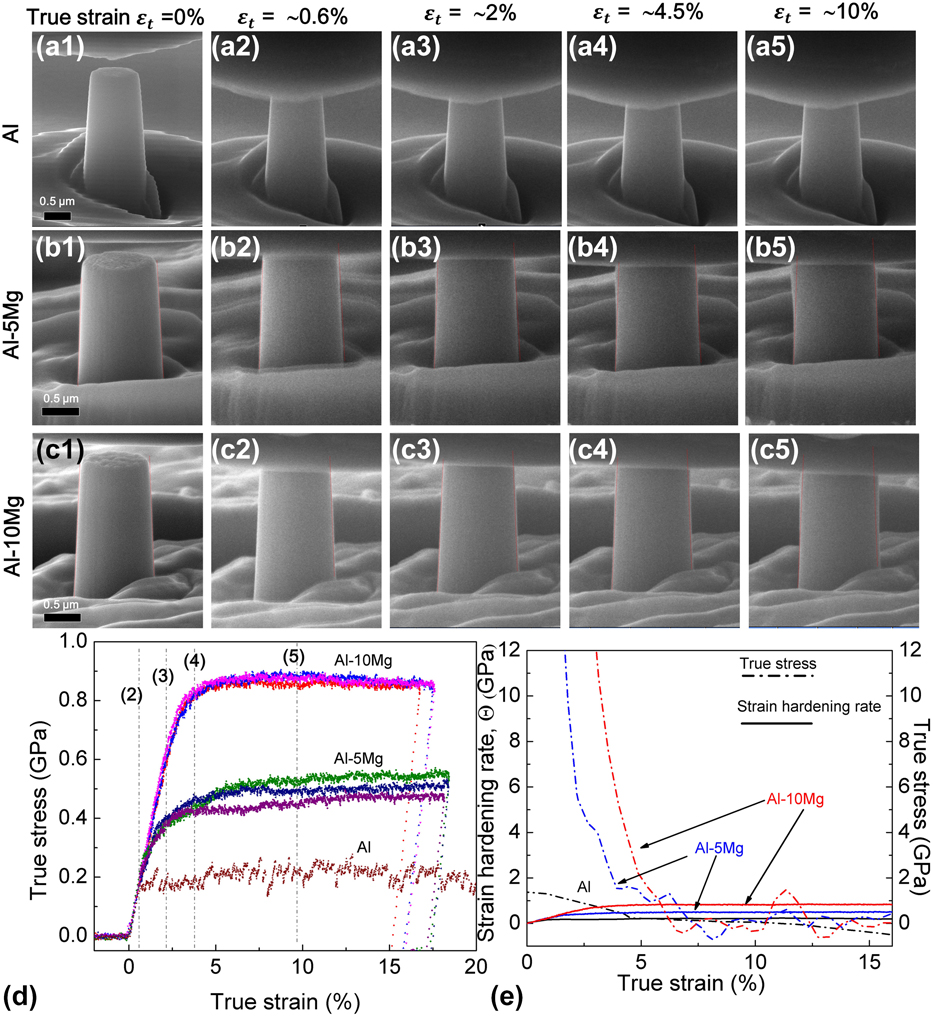
In-situ uniaxial compression tests were carried out on Al, Al–5Mg, and Al–10Mg pillars with ∼1000 nm in diameter inside a scanning electron microscope to reveal the real-time deformation processes (see Supplementary Material Videos S1–S3). Figures 6(a)–6(c) show snapshots of the real-time pillar morphology evolutions during compressive loading. The deformed Al–5Mg and Al–10Mg pillars experienced an obvious barreling near the top without any crack or shear offset up to ∼20% strain. In comparison, in Fig. 6(a), the pure Al pillars have a more uniform deformation. The true stress–strain curve shows a high flow stress up to 820 MPa for the Al–10Mg specimen, much greater than that of pure Al, ∼200 MPa. The flow stress of Al–5Mg pillars is ∼500 MPa. Figure 6(e) shows a significantly higher work hardening rate for both Al–5Mg and Al–10Mg compared with that of pure Al. In-situ compression tests were also carried out on the Al–10Mg pillars with 500 nm in diameter (and 1000 nm in height). The flow stresses of the pillars are ∼800 MPa, very similar to that of the larger diameter pillars.
In situ pillar compression test result for Al, Al–5Mg, Al–10Mg thin films. (a–c) SEM snapshots of the in situ pillar compression tests. (d) The true stress–strain curve for an in situ compression test showing a flow stress of ∼800 MPa for the Al–10Mg thin film. (e) Strain hardening rate of pure Al, Al–5Mg, and Al–10Mg.

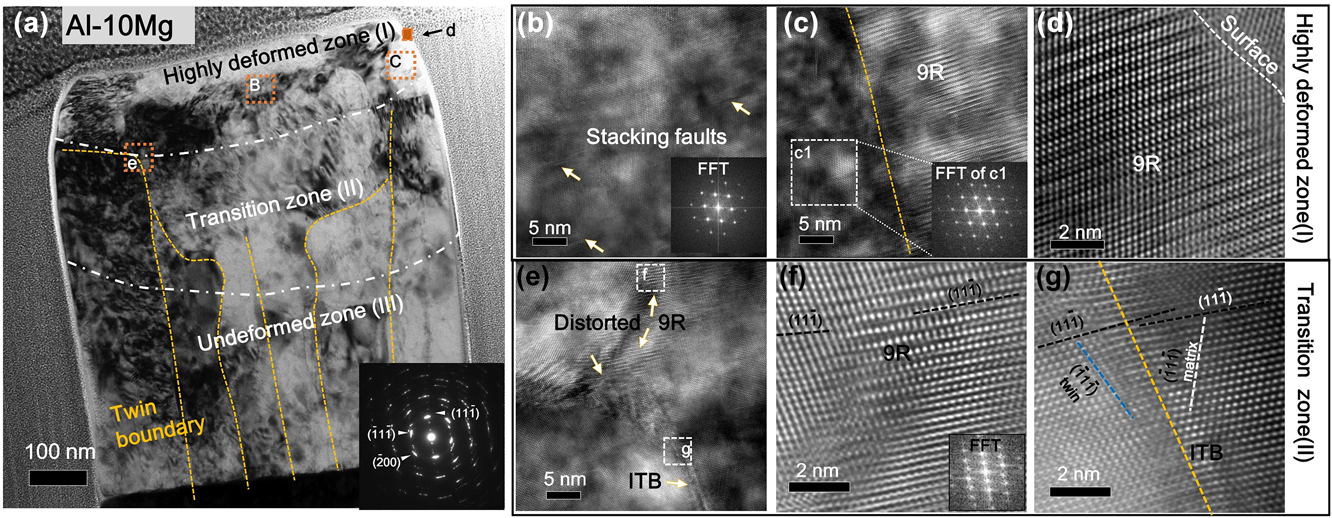
TEM analysis was performed on the deformed pillar. Figure 7(a) shows the micrographs of the deformed Al–10Mg pillar, where the yellow dashed lines indicate TBs. After the deformation, the pillar contains three distinct regions based on their microstructure difference. The dash dotted lines are visual guides to illustrate the three regions. Near the top surface of the pillar, no ITBs are observed, leaving a single-crystal-like region. Figure 7(b) [box B in Fig. 7(a)] shows the single crystal region with scattered stacking faults. However, Fig. 7(c) shows the retention of 9R near the side surface of the deformed pillar. Moreover, a preserved 9R phase was observed adjacent to the top right surface as shown in Fig. 7(d). The range of the single crystal area in the deformed pillar is ∼160 nm, which is similar to the total displacement for the compression test. Under the highly deformed zone, a transition zone (II) contains the curved (bended) ITBs. Figure 7(e) shows the distorted ITB boundary containing 9R phase in the box e in Fig. 7(a). HRTEM images in Figs. 7(f) and 7(g) show the distorted 9R phase and ITBs in Fig. 7(e). EDS results of Al–10Mg alloys show little variation of solute distribution, indicating that there is no precipitation after micropillar compression tests (see Supplementary Material Fig. S1).
TEM micrographs showing the microstructures of the deformed Al–10Mg pillar. (a) Cross section of Al–10Mg pillar after the compression test. (b) A TEM micrograph showing the single crystal structure of area b containing few stacking faults in (a). (c) A high magnification TEM micrograph showing the boundary between 9R phase and a single crystal grain (confirmed by the inserted FFT) in a highly deformed area. (d) HRTEM image shows the existence of 9R phase at the pillar surface after the compression test. (e) The microstructure of distorted columnar boundary of area e in (a). (f) HRTEM image showing the distorted 9R phase of area f in (e). (g) HRTEM image shows the distorted ITB in box g in (e).

IV. DISCUSSION
A. Formation mechanism of high-density ITBs and 9R phase
As shown previously, a majority of GBs are TBs in sputtered {111} epitaxial Al, Cu, and Ag films.Reference Bufford, Wang and Zhang40–Reference Xue, Kuo, Li, Fan, Ding, Su, Wang and Zhang42 From the crystallographic point of view, during epitaxial growth of {111} films, incoming atoms have two possible landing sites, which have the natural twin orientation relationship. During the coalescence of nuclei, twinned nuclei will form ITBs, instead of the conventional high-angle GBs, to minimize the system energy. Consequently, the ITB density is directly related to the grain size. Larger grain size results in lower TB density. Different from low SFE metals, such as Ag and Cu, which have small grain size (less than 200 nm) and high twin density, giant grains (>500 nm) and fewer twins were observed in pure Al thin films. The abnormal grain growth in Al eliminates a large population of twinned nuclei (islands), and thus significantly reduces twin density. By adding Ag seed layer with high-density ITBs and CTBs, however, the epitaxial growth of Al on Ag permits the TBs to propagate into Al,Reference Bufford, Liu, Zhu, Bi, Jia, Wang and Zhang33,Reference Yu, Bufford, Chen, Liu, Wang and Zhang35 and the Al domain size can be curtailed to 200 nm, and consequently the twin density increases.Reference Bufford, Liu, Wang, Wang and Zhang25 The current study shows that the grain size of Al decreases from 200 to 90 nm by adding 1 at.% Mg. With the increase of Mg composition, even smaller domain sizes can be achieved.
Next, we will examine the influence of solute on grain size reduction in detail. The doping of substitutional elements can cause lattice distortion and variation in bonding energy landscape. Impurity atoms can act as pinning centers to stall the movement of matrix atoms, resulting in the decrease of their diffusivity.Reference Koch, Scattergood, Darling and Semones11 Rupert et al.Reference Rupert, Trenkle and Schuh18 reported the nc-to-amorphous transition when adding more W into the Ni matrix by using magnetron sputtering. Using electrodeposition, Hu et al.Reference Hu, Shi, Sauvage, Sha and Lu19 fabricated the nc NiMo alloy, with an average grain size as small as 3 nm, by adding 21.5 at.% Mo. Using the confined channel die pressing, Zhao et al.Reference Zhao, Meng, Mao, Hu and Gottstein14 found a substantial decrease of grain size to 100 nm in Al–5 wt% Mg as compared to the 10 µm grain size in pure Al subjected to the same processing conditions. In our sputtered Al–Mg films, the diffusion of Al may have been reduced by the Mg solute, resulting in smaller grains than those in pure Al.
The formation of high-density twins and 9R phase in Al–Mg alloys may be ascribed to the reduction of SFE of the alloy comparing with pure Al. SFEs can be altered by changing testing temperature and solute composition.Reference Gallagher43 Zhao et al.Reference Zhao, Zhu, Liao, Horita and Langdon9 reported that bronze (Cu–10 wt% Zn) with an SFE of 35 mJ/m2 could form higher density of twins and wide SFs to achieve higher strength and ductility than that of the Cu with an SFE of 45 mJ/m2. Similarly, 4.5 wt% Al can decrease the SFE of Cu alloys dramatically to 12 mJ/m2, and thus Al solute can promote the formation of twins in Cu alloys.Reference Johari and Thomas44–Reference Velasco, Polyakov and Hodge46 A linear relationship between the twin thickness and SFE was observed by Zhang et al. for CuAl alloys.Reference Zhang, Tao and Lu47 The NiCo system has been chosen to study the influence of solute concentration on the SFE of Ni alloys.Reference Chowdhury, Sehitoglu, Maier and Rateick8 Sun et al.Reference Sun, Zhao, Cooley, Kassner, Horita, Langdon, Lavernia and Zhu48 observed a similar trend that adding more Co can increase the deformation twin density in NiCo alloys after high-pressure torsion processing. But, they did not provide a relation between the concentration of Co and SFE of NiCo alloys. MD simulations and experimental studies show that the SFE of NiCo alloys increases initially with Co addition and reaches a peak at 3 wt% Co and decrease gradually thereafter with greater Co composition.Reference Chowdhury, Sehitoglu, Maier and Rateick8,Reference Gallagher43,Reference Chandran and Sondhi49 This nonlinear relationship has also been observed in certain Al-based alloys. Schulehess et al.Reference Schulthess, Turchi, Gonis and Nieh50 calculated the SFE of binary Al alloy with Cu, Ag, and Mg solutes. Their calculations show that both Ag and Cu can increase the SFE of Al moderately up to 30 at.% solutes, and then the SFE decreases sharply with increasing solute concentration. But, the SFE of Al–Mg alloys continuously decreases with the increase of the Mg concentration.Reference Schulthess, Turchi, Gonis and Nieh50 This continuous reduction of SFE may facilitate the stabilization of ITBs formed during growth process.
Broad 9R phase observed in the Al–Mg alloy is a consequence of the dissociation of ITBs. The 9R phase has been observed in sputter-deposited nt Cu and Ag films.Reference Medlin, Campbell and Carter38,Reference Campbell, Chan, Medlin, Angelo and Carter51,Reference Ernst, Finnis, Hofmann, Muschik, Schönberger, Wolf and Methfessel52 The 9R phase forms after the dissociation of Σ3 (112) ITB. The Σ3 (112) ITB consists of a periodic array of three Shockley partial dislocations, b 1, b 2, and b 3, as shown in Ref. Reference Wang, Misra and Hirth39. The three partials have a net zero Burgers vector. Previous workReference Wang, Anderoglu, Hirth, Misra and Zhang53,Reference Wang, Li, Anderoglu, Zhang, Misra, Huang and Hirth54 has shown that b 1 is a pure edge dislocation with the Burgers vector  ${1 / 6}\left[ {11\bar{2}} \right]$ when the dislocation line is along the
 $\left[ {1\bar{1}0} \right]$ zone axis. b 2 and b 3 are mixed partial dislocations with the Burgers vectors of
 ${1 / 6}\left[ {\bar{2}11} \right]$ and
 ${1 / 6}\left[ {1\bar{2}1} \right]$, respectively. b 2 and b 3 attract each other due to the opposite screw component, and they also attract b 1 due to the opposite edge component. However, b 2 and b 3 (sticking together) are separated from b 1 to reduce the core energy of a super dislocation.Reference Wang, Anderoglu, Hirth, Misra and Zhang53 Notice that b 2 and b 3 align along the phase boundary 1 (PB1), whereas b 1 aligns along PB2. The 9R phase is thus bounded by PB1 and PB2. Under shear stress on the (111) plane, b 2 and b 3 move together due to their mutual attraction and they move along the direction opposite to the movement direction of b 1 because b 1 and b 2 have edge components with opposite sign. As a result, the three partials in the ITB are separated, creating a 9R phase between the two sets of dislocations.
9R phase has also been observed after plastic deformation in low SFE metals.Reference Medlin, Campbell and Carter38,Reference Wang, Misra and Hirth39,Reference Campbell, Chan, Medlin, Angelo and Carter51,Reference Liu, Wang, Gong and Mao55,Reference Gu, Zhang, Ni and Song56 Recently a microparticle enabled high-strain-rate deformation process induces 9R phase in ultra-fine grained Al films.Reference Xue, Fan, Lawal, Thevamaran, Li, Liu, Yu, Wang, Thomas and Wang57 The 9R phase arises from the dissociation of ITBs in the as-deposited Al. Besides the deformation induced 9R phase, the 9R phase has also been observed in sputtered Al/Ag multilayersReference Bufford, Liu, Zhu, Bi, Jia, Wang and Zhang33 and Al–Fe solid solution alloys.Reference Li, Xue, Wang, Shao, Kwong, Giwa, Fan, Liu, Qi, Ding, Wang, Greer, Wang and Zhang30 Although the formation mechanism of 9R during the film growth process remains an open question, it has been speculated that the shear stress from the edge of islands (during island coalescence) may be sufficient to trigger the formation of the 9R phase in Al.Reference Bufford, Liu, Zhu, Bi, Jia, Wang and Zhang33
B. Strengthening mechanisms of Al–Mg thin films
The mechanical properties of equiaxed Al–Mg alloys have been studied experimentally.Reference Youssef, Scattergood, Murty and Koch10,Reference Zhao, Meng, Mao, Hu and Gottstein14,Reference Ma, Wen, Hu, Topping, Isheim, Seidman, Lavernia and Schoenung58–Reference Fan, Choo, Liaw and Lavernia61 In general, GBs, solid solutions, and precipitates play important roles in improving the strength of Al–Mg alloys. GB induced strengthening due to dislocation pile-ups follows the Hall–Petch effect. However, when the grain size decreases to several nm, GB siding or grain rotation may lead to softening.Reference Hu, Shi, Sauvage, Sha and Lu19,Reference Shan, Stach, Wiezorek, Knapp, Follstaedt and Mao62 Solute atoms can change the energy landscape for the dislocation slipReference Leyson, Curtin, Hector and Woodward63 and recrystallization.Reference Zhao, Meng, Mao, Hu and Gottstein14 As EDS map did not reveal obvious precipitates before or after the pillar compression tests (Supplementary Material Fig. 1), the following discussions on strengthening mechanisms for Al–Mg films will focus on solid solution and TB strengthening.
For solid-solution strengthening, the Fleischer equation is used to estimate the increase of the friction stress induced by solutes for dislocation slipReference Fleischer64,Reference Fleischer65 as
 $$\Delta {\sigma _{{\rm{ss}}}} = MGb\varepsilon _{{\rm{ss}}}^{{3 \over 2}}\sqrt c \quad ,$$
Δσss represents the solute atom induced increase in yield strength of the alloy, M is the mean orientation factor, which is 3.06 for the FCC polycrystalline matrix, G is the shear modulus of the matrix, b is the magnitude of the Burgers vector, and c is the solute concentration. εss is the interaction parameter that accounts for the resistance for the dislocation slip in the local region. εss is related to the lattice parameter and shear modulus variation for the matrix due to the addition of solutes.Reference Fleischer65
Based on the Eq. (1), Δσss is estimated to be 17, 80, and 170 MPa for Al–1Mg, Al–5Mg, and Al–10Mg, respectively. A discrepancy between the model and experiments was reported previously in nc materials when the average grain size is less than 30 nm due to the dislocation pinning effect at GBs.Reference Rupert, Trenkle and Schuh18 However, the minimum grain size in Al–Mg films is 70 nm, hence we anticipate that the classic theory is still valid for the estimation of solute strengthening in our Al–Mg systems.
The GB strengthening is described by the Hall–Ptech relationship asReference Hall66
 $${\sigma _{\rm{f}}} = {\sigma _0} + k{d^{ - {1 \over 2}}}\quad ,$$
where σf is the flow stress, σ0 is the friction stress, d is the average grain size, and k is the Hall–Petch slope. There is a large variation of k value even for pure Al with different microstructure.Reference Wyrzykowski and Grabski67 In recrystallized Al, k is 0.04 MPa m1/2, whereas the cold-rolled Al has a higher k value (0.14 MPa m1/2). A similar trend is also found in polycrystalline Ni.Reference Hansen68 The Hall–Petch slope, k, indicates the barrier strength of GBs for the transmission of single dislocations.Reference Misra, Hirth and Hoagland69 Wyrzykowski and Grabski hypothesized that the GB diffusivity and texture of Al may lead to a large variation of the Hall–Petch slope.Reference Wyrzykowski and Grabski67 And MD simulations showed the correlation between the GB energy and GB barrier strength.Reference Sangid, Ezaz, Sehitoglu and Robertson70 Since the epitaxial AlMg thin films have predominantly ITBs as the columnar GBs, these films provide an interesting example to study the ITB induced strengthening.
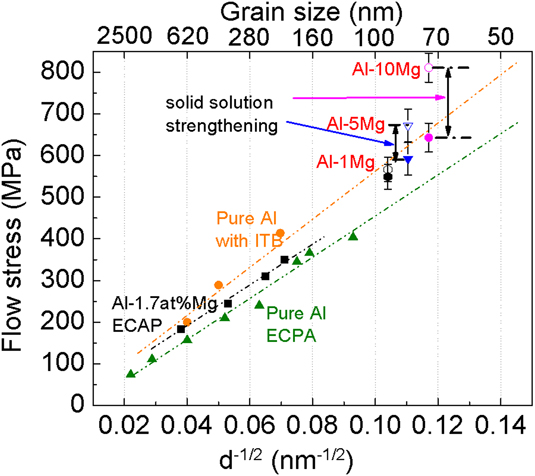
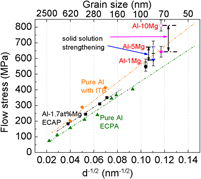
Figure 8 compares the Hall–Petch strengthening from conventional high-angle GBsReference Tsuji, Ito, Saito and Minamino71,Reference Hayes, Witkin, Zhou and Lavernia72 and ITBsReference Bufford, Liu, Zhu, Bi, Jia, Wang and Zhang33 for pure Al. Comparison of the slopes shows that ITBs may be a strong barrier for the dislocation transmission, comparable to the conventional high angle GBs. The Hall–Petch slope of ECAP processed ultra-fine grained Al is about 0.13 MPam1/2, which is similar to that of cold-rolled Al (0.14 MPa m1/2).Reference Hansen68 The Hall–Petch slope of ECAP Al–1.7Mg is nearly identical to the slope of ECAP Al,Reference Zhao, Meng, Mao, Hu and Gottstein14 indicating that adding Mg changes the friction stress for the dislocation slip. The flow stresses of three Al–Mg thin films are calculated based on the nanoindentation hardness divided by a factor of 2.7.Reference Mata, Anglada and Alcalá73 These data do not appear to follow the Hall–Petch slope of Al with ITBs. However, if we subtract the influence of solid solution strengthening calculated previously, all three data points align well along the Hall–Petch slope of ITB dominated Al or Al alloys. The flow stress of Al–Mg thin films incorporating the contribution from solid solution strengthening can be described as
 $${\sigma _{\rm{f}}} = {\sigma _0} + \Delta {\sigma _{{\rm{ss}}}} + k{d^{ - {1 \over 2}}}\quad .$$
Flow stress as a function of d −1/2 for Al and Al–Mg with different grain boundaries. The green triangular shape data show the flow stress of ECAP Al with different grain sizesReference Tsuji, Ito, Saito and Minamino71,Reference Hayes, Witkin, Zhou and Lavernia72 ; the black square data show the flow stress of ECAP Al–1.7Mg samplesReference Zhao, Meng, Mao, Hu and Gottstein14; the orange circles show the flow stress of pure Al with high-density ITBsReference Bufford, Liu, Zhu, Bi, Jia, Wang and Zhang33; the hollow data show the flow stress of Al–1Mg, Al–5Mg, and Al–10Mg; the solid data points underneath the hollow data points are the flow stress derived by subtracting the contribution from solid solution strengthening.

The value of k is about 0.15 MPa m1/2 based on the line fitting result for the slope of ITB strengthening. Prior MD simulations have shown that coherent TBs are strong barriers to the transmission of dislocations in FCC metals. A recent MD simulation study shows that ITBs are indeed strong barriers to the transmission of dislocations in twinned Al, which was also confirmed by an in-situ nanoindentation studies.Reference Bufford, Liu, Wang, Wang and Zhang25
Our micropillar compression studies show that ITBs in nt Al–Mg alloys introduce a high work hardening rate compared with pure Al as shown in Fig. 7(e). A similar phenomenon has recently been observed in nt Al–Fe solid solution alloys.Reference Li, Xue, Wang, Shao, Kwong, Giwa, Fan, Liu, Qi, Ding, Wang, Greer, Wang and Zhang30 The sputtered Al–Fe alloys have high strength arising from nanograins, high-density ITBs, and 9R phase. MD simulations suggest that the significant strengthening and strain hardening arise from the existence of high-density 9R phase and ITBs.Reference Yu, Shen, Liu and Han74 The current study shows that using high-density TBs and 9R phase can also significantly increase the strength of Al–Mg alloys, an important structural material for transportation industries.
V. CONCLUSIONS
Epitaxial Al–Mg thin films with high density growth twins have been fabricated using magnetron sputtering technique. Columnar grain boundaries are primarily ITBs. The nanoindentation and in-situ micropillar compression tests show that nt Al–Mg alloys have flow stress exceeding 800 MPa and significant work hardening ability. The strong ITB barriers play an important role in strengthening the Al–Mg alloys. Comparison of Hall–Petch plots for Al and Al–Mg alloys shows that ITBs are equivalent barriers to strengthen Al alloys comparing to conventional high angle grain boundaries.
Supplementary Material
To view supplementary material for this article, please visit https://doi.org/10.1557/jmr.2018.372.
ACKNOWLEDGMENTS
We acknowledge financial support from Department of Energy BES (Grant No. DE-SC0016337) on performing micropillar preparation experiments. Han W. and H.W. acknowledge the support from the Office of Naval Research (N00014-16-1-2778). Accesses to the Microscopy Facilities at School of Materials Engineering and Life Science at Purdue University are also acknowledged.