Introduction
Populations of many species of aphid (Hemiptera: Aphididae) that feed on herbaceous plants (forbs and grasses) exhibit what Karley et al. (Reference Karley, Parker, Pitchford and Douglas2004) call a “mid-season crash” in abundance: populations rise quickly to a peak by mid-July, then drop even more quickly to low levels, and recover six to eight weeks later. The rise of the populations is explained by high rates of development and reproduction, and parthenogenesis (Karley et al. Reference Karley, Parker, Pitchford and Douglas2004). The “mid-season crash” following the peak is attributed to a number of population processes, which may all be contributing to a greater or lesser extent in different species (Karley et al. Reference Karley, Parker, Pitchford and Douglas2004). The pattern identified by Karley et al. (Reference Karley, Parker, Pitchford and Douglas2004) is based primarily on observations for European species. In North America, the mid-season decline occurs later, in mid to late August, and no recovery occurs probably because the growing season ends early for these populations (Maiteki et al. Reference Maiteki, Lamb and Ali-Khan1986; Lamb et al. Reference Lamb, Wise and MacKay1997, Reference Lamb, MacKay and Alyokhin2013).
A decline in the population that occurs in mid-season indicates that the inherently high intrinsic rate of increase of aphids is somehow limited. The processes that halt the rise and initiate the decline regulate the aphid population. By regulation we mean: bringing an end to population increase before the aphids have destroyed their local habitat, in this case their host plant. Therefore, accounting for the “mid-season crash” would help us understand aphid population regulation.
The “mid-season crash” has so far been documented for aphids that are crop pests (Honek and Martinkova Reference Honek and Martinkova2004; Karley et al. Reference Karley, Parker, Pitchford and Douglas2004; Lamb et al. Reference Lamb, MacKay and Alyokhin2013). For crops, the uniform timing of seeding and harvesting, and the large monocultures that result, might well cause the seasonal population dynamics of aphids to differ from those in non-agricultural habitats. With this in mind, Karley et al. (Reference Karley, Parker, Pitchford and Douglas2004) recommend investigating seasonal dynamics of aphid populations in non-agricultural systems, to confirm that the processes underlying the seasonal rise and decline in abundance are a general characteristic of aphid populations on herbaceous plants.
Here we use a nine-year study of seasonal dynamics of Uroleucon rudbeckiae (Fitch), a monophagous herbivore on tall coneflower, Rudbeckia laciniata Linnaeus (Asteraceae), to investigate seasonal abundance for a non-agricultural aphid. Both aphid and host are native to North America and occur naturally in the area around our study site (Lamb and MacKay Reference Lamb and MacKay2010). The resulting data are used to assess the relative importance of population processes that are hypothesised to affect seasonal changes in aphid abundance and thereby regulate aphid populations.
Materials and methods
The identity of the aphid U. rudbeckiae was confirmed by R.G. Foottit, Agriculture & Agri-Food Canada, and voucher specimens were deposited in the Canadian National Collection of Insects, Arachnids, and Nematodes in Ottawa, Ontario, Canada. The aphid was investigated on a host population consisting of four patches of plants in a suburban garden in Winnipeg, Manitoba, Canada (49.8456°N, 97.1283°W). The plants were established about 30 years ago from seed collected a few kilometres from the garden in a riverine forest of mature hardwoods, similar to that in the garden. Aphids colonised the plants naturally at least 20 years ago, and continue to do so annually. The abundance of the aphid was not manipulated. In dry years, the plant patches were watered for up to two hours once or twice per season, but most of the moisture came from rain. No fertiliser or fungicide was added. The spatial distribution and size of plant patches and the year-to-year changes in aphid abundance are similar to those that occur in wild populations in Riding Mountain National Park, Manitoba, Canada (Lamb and MacKay Reference Lamb and MacKay2010).
The aphid overwinters as an egg in leaf litter, newly hatched females (fundatrices) crawl onto shoots in May, and subsequently they and their offspring crawl to bolting flower stems in June. Fundatrices are difficult to find in the dense understorey of expanding basal leaves, but individuals or groups of this large, bright red aphid are easily seen on the bolting flower stems where they live for the rest of the season. The aphids on an individual flower stem are referred to as a colony. Flower stems in the plant patches were searched, and when a colony was discovered the stem was assigned a numbered tag so that the colony could be tracked in subsequent weeks. If 50 or fewer aphids were present, they were counted individually in situ. If more than 50 aphids were present, an accurate tally of individuals was often impractical and so we measured the length of stem infested to the nearest half centimetre. A centimetre of infested stem has been determined to have about 10 aphids (Lamb and MacKay Reference Lamb and MacKay2010). As aphids showed no sign of being disturbed by the counting procedures, the process was non-destructive, and the plants and aphids were free-living, we assume that the seasonal patterns of abundance we observed were as occur in nature.
For six years (2010–2015), all flower stems in the four patches of R. laciniata that hosted the local population of U. rudbeckiae were assessed approximately weekly, on an average of 144 flower stems/year. At the same time the growth stage of flower stems was noted based on the development of the most advanced bloom on each stem. In one of the patches (A) all stems, on average 49 stems per year, were assessed weekly for nine years (2007–2015). The seasonal patterns of aphid abundance were compared between the local population and Patch A and found to be similar, and so many of the subsequent analyses present data for the longer time series for Patch A, confirmed where possible by the patterns exhibited on the larger number of plants in the local population.
Some years, aphids overwintered in one or more of the patches and established colonies in May (referred to as resident populations). Other years, no aphids overwintered and the populations arose between mid-June and early July from immigrants arriving from outside the study site (referred to as immigrant populations). The source of the local population and resultant timing of colonisation might affect seasonal dynamics and so the populations for each year were designated as “resident” or “immigrant”.
First, abundance was estimated as the mean number of aphids per stem for each week, to determine peak abundance (highest weekly count) and the day of the year abundance peaked. Second, two components of abundance were estimated for each week: prevalence (the proportion of stems colonised by aphids) and mean intensity (the mean number of aphids on colonised stems) (Rózsa et al. Reference Rózsa, Reiczigel and Majoros2000). Abundance equals prevalence multiplied by mean intensity. Relationships among peak abundance, peak prevalence and peak mean intensity were explored for Patch A using Pearson product moment correlations (SYSTAT Software 2009). Third, the size and longevity of individual colonies were assessed for all 949 colonies observed over the nine-year study, to investigate how individual colonies contributed to abundance (following Harrington and Taylor Reference Harrington and Taylor1990). The number of sequential, independent colonies on each stem over the season (colony turnover, Fievet et al. Reference Fievet, Dedryver, Plantegenest, Simon and Outreman2007) was determined. For example, if a colony established on a stem disappeared and subsequently a new colony established on the same stem, we counted the two colonies separately, as a turnover of two. Frequency distributions were tabulated for peak colony size and colony longevity (number of weeks that colonies survived).
To investigate density-dependent processes in colonies, Pearson product moment correlations and general linear model analyses (SYSTAT Software 2009) were used to investigate the relationships among peak colony size, timing of the peak, and the time it took colonies to rise and fall, for moderate and large colonies (100–1000 or more aphids). Small colonies (up to 100 aphids) were excluded from this analysis because nearly all of these were a single female and her offspring, too short-lived to contribute meaningfully to the analyses. These relationships were subsequently more effectively visualised by dividing colonies (n=112) into 10 categories of increasing colony size and plotting mean values for colony parameters against those for peak colony size.
Results
Seasonal of abundance
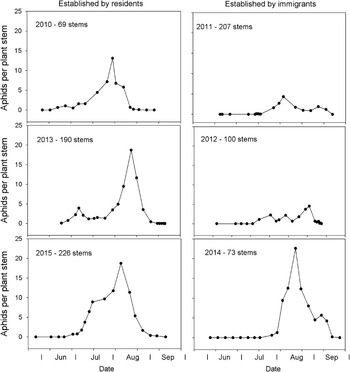
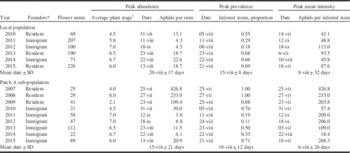
In each of six years, a local population of U. rudbeckiae on four patches of R. laciniata reached peak abundance between late July and mid September (Fig. 1). In four of the years, abundance rose from low levels in June to a peak of 13–23 aphids per flower stem and then dropped back to low levels by early September. In the other two years, abundance began to rise in July to low peaks of about four aphids per stem. The average date of peak abundance was 20 August (Table 1). A distinct peak was less evident in the two years with low abundance (Fig. 1). Whether the populations were established by over-wintering residents or by early-summer immigrants from outside the local population had no consistent effect on the occurrence of the peak (Fig. 1). The two low populations were both established by immigrants, but the third immigrant population in 2014 had the highest peak of the six years.
Weekly abundance of Uroleucon rudbeckiae for 2010–2015 in a local population of Rudbeckia laciniata with 69–226 flower stems/year. Seasonal patterns of abundance are identified as established by over-wintering resident aphids (left column of graphs) or by winged early-summer immigrants from outside the study site (right column of graphs).

Peak abundance, prevalence, and mean intensity for a local population of the aphid Uroleucon rudbeckiae on flower stems of Rudbeckia laciniata.

The local aphid population consisted of all aphids on an isolated local plant population. Patch A was one of the four distinct patches that made up the local plant population.
* Origin of aphid population: resident – overwintered locally; immigrant – overwintered elsewhere and flew to the local plant population.
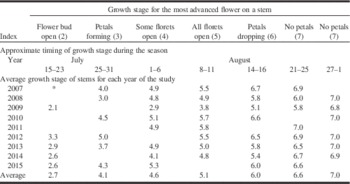
† See Table 3 for a description of plant stages.
Aphid abundance was followed for nine years in one patch of stems (Patch A) that made up a quarter to a half of the local population of R. laciniata (Table 1). This sub-population peaked on 15 August, on average, five days earlier than the local population (Table 1). Over six years, mean peak abundance was similar between Patch A (13.5 aphids per stem) and the entire local population (13.7 aphids per stem). Patch A had substantially higher peak abundance from 2007 to 2009 than in later years (Table 1).
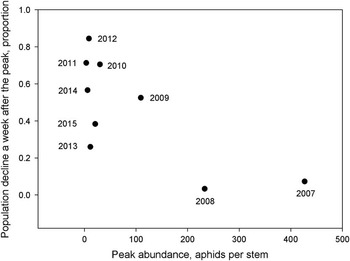
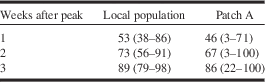
The decline in aphid abundance showed a similar pattern for both the local population and Patch A (Table 2). One week after the peak, the population had declined by about 50%, two weeks after the peak by about 70%, and three weeks after the peak by about 85%. Over seven of the nine years for Patch A, the decline in the first week after the peak was not related to the height of the peak (Fig. 2). In 2007 and 2008, however, when peak abundance was highest, the decline in the week after the peak was small (<10%), but in 2009 when the peak was still relatively high compared with later years, the decline in the first week was close to average, about 50% (Fig. 2).
The relationship between population decline a week after the peak, as a proportion of peak abundance, and peak abundance for Uroleucon rudbeckiae over nine years in Patch A of a local population of Rudbeckia laciniata.

The mean (range) decline in abundance, as a percentage of peak abundance (aphids per stem), in weeks 1–3 after the peak, for the local population (six years) and Patch A (nine years) of the aphid Uroleucon rudbeckiae on flower stems of Rudbeckia laciniata.

Peak abundance and plant phenology
Flower stems of R. laciniata usually produced 1–15 blooms, the development of which provided a convenient metric for plant phenology (Table 3). The first flower buds began to form (Stage 1) at the end of June or beginning of July, those buds were opening (Stage 2) by mid-July, and petals began to form on the first blooms in late July (Stage 3). At the end of July or in early August stems reached maximum height of 1–2 m. Florets began to open at the beginning of August (Stage 4), all florets of the most advanced flower on a stem were open (Stage 5) in the second week of August, and the first flowers began to drop petals (Stage 6) in mid-August. By the end of August, many blooms had dropped all their petals (Stage 7), and in early September the stems began to senesce. The growth stage index advanced in approximately weekly units from 1–7 from the first week of July through late August, on average (Table 3). The timing of plant development was delayed by about a week in 2009, but was similar in the other eight years (Table 3).
Average growth stage of flower stems from a local population of Rudbeckia laciniata (Patch A for 2007–2009; local population for 2010–2015) that hosted the aphid Uroleucon rudbeckiae, recorded at approximately weekly intervals in July and August.

* Missing values occurred because all stems had passed through a particular growth stage associated with a date range before they were assessed.
In 2007 and 2009 when peak abundance occurred early on 25 and 23 July, flower stems were at growth stages 4.0 and 2.1, respectively. In 2008 when the peak was also early on 27 July, the plant growth stage was 3.0, whereas in 2015 the local population peaked 17 days later on 13 August at a growth stage of 6.0 (Table 1). In other years when the peak was late, 22 August to 18 September, stems were at a late growth stage of 6.5–7.0 (Table 1). So, peak abundance occurred over a wide range of plant developmental stages, from when buds first opened (before stems reached maximum height) to when flower stems were senescing (Table 1).
Seasonal patterns in components of abundance
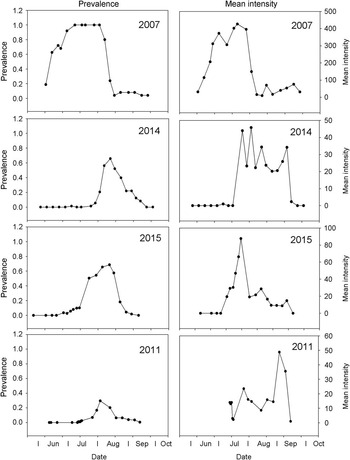
Prevalence showed an annual peak in mid summer (Fig. 3), usually within a week of the peak in abundance for both the local population and Patch A (Table 1). The single peak was well defined even when the peak of abundance was low and indistinct, for example in 2011 (Figs. 1, 3). The timing of peak prevalence was more consistent from year to year with a standard deviation nine or 10 days less than for peak abundance for the local population and Patch A, respectively (Table 1). Mean intensity, on the other hand, showed a less well-defined peak than prevalence (Fig. 3), and the timing of peak mean intensity was less consistent from year to year, with a standard deviation 15 or five days longer than for peak abundance for the local population and Patch A, respectively (Table 1). The average time of peak mean intensity occurred 7–12 days earlier than that of peak prevalence or peak abundance, for both the local population and Patch A (Table 1). At peak prevalence, 18–69% of the flower stems were infested in the local population. In Patch A, peak prevalence reached 100% when populations were highest in 2007 and 2008 (Table 1). At peak mean intensity, the local population varied between means of 43 and 113 aphids per colonised stem (mean colony size), whereas in Patch A, mean colony size was more variable: 18–427 aphids per colonised stem (Table 1).
Weekly patterns of prevalence (proportion of stems colonised) and mean intensity (mean aphids per colonised stem) for Uroleucon rudbeckiae on Rudbeckia laciniata in four years of a nine-year study. The years were selected to illustrate a range of populations from high (upper graphs, 2007 and 2014) to low peak abundance (lower graphs, 2015 and 2011). For 2007, data are from Patch A and for 2011–2015 data are from the local population.

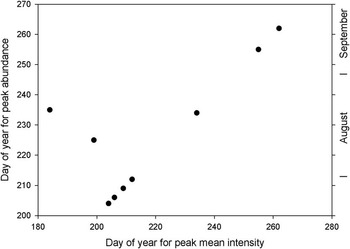
Peak abundance was correlated with peak prevalence (r=0.72, P=0.03, n=9) and mean peak intensity (r=0.75, P=0.02, n=9), but the two components of abundance were not correlated (r=0.43, P=0.26, n=9). The timing of peak abundance, however, was more related to the timing of peak mean intensity (r=0.73, P=0.03, n=9) (Fig. 4), than to the timing of peak prevalence (r=0.49, P=0.19, n=9). The timing of peak prevalence and timing of peak mean intensity were not correlated (r=0.14, P=0.73, n=9).
Relationships between the day of the year when peak abundance occurred and the day of the year for peak mean intensity for Uroleucon rudbeckiae on Rudbeckia laciniata in Patch A containing 21–112 flower stems over nine years.

For seven of nine years, peak mean intensity and peak abundance occurred on the same date, with only 2013 and 2015 deviating from that trend (Fig. 4). At peak mean intensity in 2013 and 2015, only one and six out of 112 and 89 stems, respectively, had aphid colonies, but those colonies were large with mean intensities of 109 and 268, respectively (Table 1). When prevalence rose later in the season to 50% or more of the stems colonised, abundance rose to a peak because of the large number of colonies, even if those colonies were on average small (Table 1). In 2011 and 2012, when abundance peaked in mid-September (later than in other years), only one or two stems had colonies with about 200 aphids each. Prevalence peaked at the usual time in these years in mid-August, when mean intensity was about 10 aphids on 11 and five stems for 2011 and 2012, respectively, giving an abundance lower than that in September, although more stems had colonies (Table 1). So, peak mean abundance resulted sometimes because a small proportion of flower stems had colonies and these were large, and sometimes because many stems had colonies but these were relatively small. Sometimes, as in 2007 and 2008, peak abundance was high because high peak prevalence and high peak mean intensity coincided, but usually the timing of peak abundance was determined by a few individual colonies that became large (Table 1).
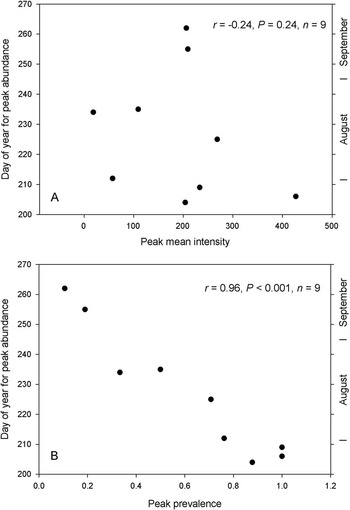
In Patch A, the timing of peak abundance was not related to the size of peak mean intensity (r=−0.24, P=0.53, n=9) (Fig. 5A), but was highly correlated with the size of peak prevalence (r=0.96, P<0.001, n=9) (but not the timing of peak prevalence as shown above). The higher the peak in prevalence the earlier peak abundance was reached (Fig. 5B). Some as yet unknown process that increased the proportion of stems colonised by aphids, hastened the rise to peak abundance, even though the timing of peak abundance was less closely related to peak prevalence than was the timing of peak mean intensity.
Relationships between the day of the year when peak abundance occurred and peak mean intensity (A) and peak prevalence (B) for the aphid Uroleucon rudbeckiae on Rudbeckia laciniata in Patch A containing 21–112 flower stems over nine years.

Colony longevity and size
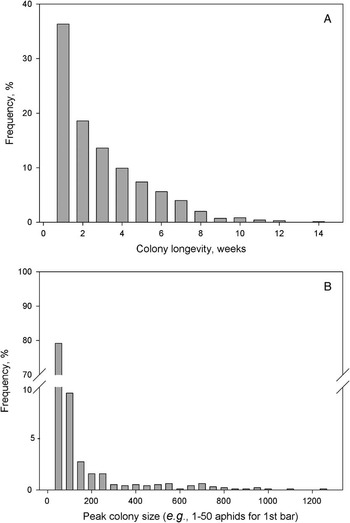
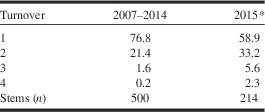
The majority of stems had a single colony over a summer, but about a quarter had two or more occupying a stem sequentially (Table 4). Most colonies survived for one or two weeks (more than 50%) but one survived for 14 weeks, essentially the whole season (Fig. 6A). The short-lived colonies were small, with 41% of colonies reaching a peak of 10 or fewer aphids before disappearing. Most of these short-lived colonies consisted of an immigrant winged female and a few of her as yet immature progeny. The peak size of 79% of the colonies was <50 aphids, but some long-lived colonies reached 1000 aphids or more (Fig. 6B). Of the 949 colonies in the study, 112 (12%) reached a peak abundance of 100 or more, and 7% of all colonies reached a peak abundance of more than 200 aphids (Fig. 6B).
Frequency distributions (%) for the longevity of colonies of Uroleucon rudbeckiae on individual stems of Rudbeckia laciniata (A), and the peak number of aphids in those colonies (B), for 949 colonies.

Frequency distributions (%) of colony turnover for the aphid Uroleucon rudbeckiae on individual flower stems of Rudbeckia laciniata: turnover=1 if a single colony was present for one or more successive sample weeks, and 2 if a colony formed and later disappeared before a new colony formed on the same stem, and so on.

* In 2015 newly arrived winged immigrants were identified, reducing the underestimation of turnover.
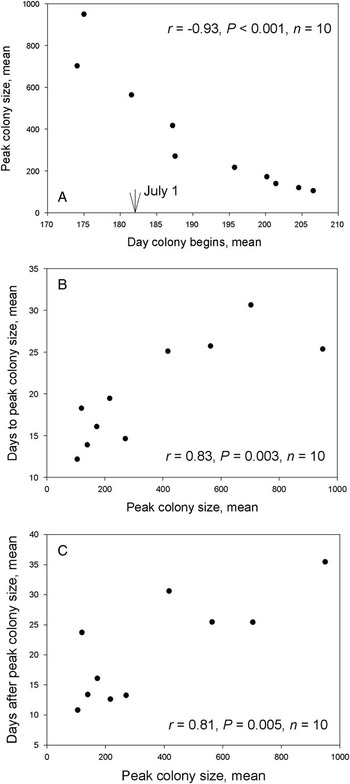
Because most colonies were short-lived and small (i.e., disappeared before any offspring reached adulthood or could disperse by flight), these small colonies were likely irrelevant to any density-dependent processes from intra-specific interactions and were excluded from subsequent analyses. In an analysis of peak size for large colonies (>100 aphids) against year and colony initiation date, year explained 18% (P=0.024, df=8) and initiation date explained 75% (P=0.002, df=1) of the variation (general linear model, Systat Software 2009). Thus colonies initiated early in the season were most likely to reach the highest peak size (Fig. 7A). For colonies that reached a peak of 100 or more aphids, those with the highest peak took the most time to reach that peak (r=0.433, P<0.001, n=112) (Fig. 7B). Those colonies with the highest peak also took the most time to disappear after they reached the peak (r=0.389, P<0.001, n=112) (Fig. 7C). Note that the variation among the 112 colonies was high and so the relationships were more effectively visualised by correlating means for 10 categories of abundance (Fig. 7). The relationships among means were more highly correlated than were those for the 112 individual colonies (compare coefficients in Fig. 7 with the analysis of variance and correlation coefficients above), but significant (P<0.01) for both types of analysis.
Relationships between peak colony size of Uroleucon rudbeckiae and the seasonal timing of the peak for large colonies (100 or more aphids on an individual stem, n=112). Means (n=10–14) for each parameter were estimated for 10 categories of similar peak colony size, to normalise data and assure that relationships could be visualised. (A) Peak colony size versus the date the colony appeared; (B) days from colony appearance to the peak versus colony size at the peak; (C) days after the peak until the colony disappeared versus colony size at the peak.

Discussion
Over nine years a population of U. rudbeckiae rose slowly in June, usually rose quickly in July, peaked between late July and mid-September, and then declined: a mid-summer peak as observed for many species of aphids on crop plants (Honek and Martinkova Reference Honek and Martinkova2004; Karley et al. Reference Karley, Parker, Pitchford and Douglas2004; Lamb et al. Reference Lamb, MacKay and Alyokhin2013). Prevalence (the proportion of plants colonised) and mean intensity (the mean number of aphids on plant stems that have been colonised) interacted to produce this annual peak of abundance. A rise in prevalence reflected dispersal events that result in the colonisation of host plants; a decline in prevalence reflected the disappearance of colonies from those plants. A peak in prevalence was well defined and occurred in all nine years between 25 July and 25 August, usually within a few days of a peak in abundance for this population. Mean intensity was less uniform than prevalence, fluctuating from week to week, and its peak varied from early July to mid-September. Prevalence and mean intensity contributed to a similar extent to peak abundance. The highest peak abundances were in late July, the intermediate peaks in mid-August, and the lowest peaks in mid-September.
These patterns were determined by the number of plant stems colonised and the rise and decline of individual colonies on particular plant stems. Most colonies survived less than two weeks and about 90% never reached more than 100 aphids on a plant stem. Small colonies often occurred sequentially on the same plant stem, establishing, beginning to rise in numbers, and then disappearing quickly, giving a turnover of as many as four successive colonies on some stems. A large number of short-lived colonies resulted in a high prevalence but low mean intensity, because colonies disappeared before colony size rose, often leading to a low peak in abundance. Some years, however, a few and occasionally many large colonies consisting of a few hundred up to 1000 or more aphids determined the timing and size of peak abundance. Large colonies were initiated earlier, took longer to reach a peak, and were slower to decline than moderately-sized colonies. So, the rise and decline of two types of colonies, the majority short-lived and small, and the minority large, must be understood to determine the cause of the annual peak and decline in abundance. The usual metric, mean abundance, is ineffective for understanding seasonal dynamics of this and probably other aphid species, because of the high level of aggregation in individual colonies and the rapid changes that occur in those colonies (see also Harrington and Taylor Reference Harrington and Taylor1990).
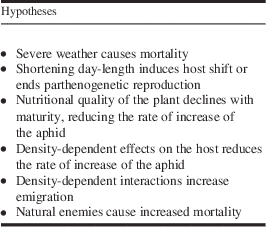
A number of hypotheses have been offered for the decline after an aphid population reaches a peak (Karley et al. Reference Karley, Parker, Pitchford and Douglas2004), as summarised in Table 5. However, no single hypothesis explains the annual decline observed for U. rudbeckiae, as described below. Severe weather such as heavy rain or an early frost was not observed to cause a drop in prevalence or colony size for U. rudbeckiae. A shortening day-length induces production of winged offspring and initiates a mid-August decline in Macrosiphum euphorbiae (Thomas) (Hemiptera: Aphididae) in Manitoba (Lamb et al. Reference Lamb, Wise and MacKay1997), but not the mid-summer to late-summer decline of U. rudbeckiae. The onset of the production of sexuals, in mid to late August for males and September for mating females, occurred after the population declined in most years, and asexual reproduction continued through September in any colonies that survived that late, as evidenced by the late peaks in abundance in two of the nine years. The timing of peak abundance did not occur as plants matured, and in two of nine years, peak abundance occurred when flower stems were well into senescence. This observation agrees with that of Honek and Martinkova (Reference Honek and Martinkova2004) who experimentally demonstrated that a nutritional decline of the host with plant maturity was not an important factor in causing the mid-summer decline of Metopholopium dirhodum (Walker) (Hemiptera: Aphididae). The August decline of M. euphorbiae also occurs at the same time on host plants at different stages of maturity (Lamb et al. Reference Lamb, Wise and MacKay1997). On the other hand, Masonaphis maxima (Mason) (Hemiptera: Aphididae) populations are highly sensitive to the development of their host plant, and the fecundity of this aphid declines sharply as its host matures (Gilbert and Gutierrez Reference Gilbert and Gutierrez1973).
Hypotheses for the seasonal decline of aphid populations on herbaceous plants (adapted from Karley et al. Reference Karley, Parker, Pitchford and Douglas2004).

At high population densities, aphids can have serious negative effects on their host plants, which feed back onto the rate of increase of the aphid (Dixon Reference Dixon1998; Costamagna et al. Reference Costamagna, van der Werf, Bianchi and Landis2007b; Matis et al. Reference Matis, Kiffe, van der Werf, Costamagna, Matis and Grant2009). Models of bottom-up effects of the host plant on population growth (Costamagna et al. Reference Costamagna, van der Werf, Bianchi and Landis2007b), and cumulative density-dependent effects (Matis et al. Reference Matis, Kiffe, van der Werf, Costamagna, Matis and Grant2009), are consistent with the observed peak and decline. However, the aphid densities modelled in Costamagna et al. (Reference Costamagna, van der Werf, Bianchi and Landis2007b) and Matis et al. (Reference Matis, Kiffe, van der Werf, Costamagna, Matis and Grant2009) are at least an order of magnitude higher than the natural populations we studied, and much higher than the densities encountered in the studies that have observed a mid-season decline in free-living populations (e.g., Lamb et al. Reference Lamb, MacKay and Alyokhin2013). For U. rudbeckiae, the most consistent feature of the decline in abundance was a decline in prevalence, which cannot be explained by negative feedbacks of density on colony size because most of the colonies that determined prevalence were small and short-lived. Furthermore, the decline occurred over a wide range of year-to-year peak abundances (4–427 aphids/stem) and a large range of mean intensities (18–427 aphids/colony).
Many aphid species show density-dependent production of winged forms leading to emigration that would reduce the size of the colonies they are leaving (Müller et al. Reference Müller, Williams and Hardie2001). Density-dependent emigration, however, cannot explain the rapid disappearance of the almost 90% of U. rudbeckiae colonies that were small (<100 aphids) and short-lived (1–2 weeks). Furthermore, with density-dependent emigration large colonies would be expected to decline more rapidly than smaller ones, which was not the case.
Natural enemies affect the population dynamics of many aphids (e.g., Alyokhin et al. Reference Alyokhin, Drummond, Sewell and Storch2011), and excluding predators with cages or by trapping increases aphid populations, apparently breaking the population regulation that prevents serious damage to the host (Boiteau Reference Boiteau1986; Costamagna and Landis 2006; Costamagna et al. Reference Costamagna, Landis and Difonzo2007a). Predation of U. rudbeckiae also is consistent with the observations that most colonies disappear soon after they become established and large colonies disappear more slowly than intermediate-sized colonies (the latter because it probably takes longer for predators to consume large colonies than small colonies). Attacks by fungal pathogens can also be an important cause of mortality for aphids (Latgé and Papierok Reference Latgé and Papierok1988), sometimes resulting in epizootics and the rapid collapse of aphid populations consistent with a “mid-season crash” occurring over 3–7 days (Boiteau Reference Boiteau1986; Lamb et al. Reference Lamb, Wise and MacKay1997; Honek and Martinkova Reference Honek and Martinkova2004). For U. rudbeckiae, however, no fungus-infected aphids or corpses have ever been observed in the thousands of colonies we have observed, and mycoses have never been associated with a population decline.
The seasonal dynamics of U. rudbeckiae are consistent with the conclusion that aphid populations on herbaceous plants peak in summer (Karley et al. Reference Karley, Parker, Pitchford and Douglas2004; Lamb et al. Reference Lamb, MacKay and Alyokhin2013). This phenomenon occurs in a native aphid on a native, naturally distributed host in a non-agricultural habitat. The timing and nature of the population decline for U. rudbeckiae is not consistent with a “mid-season crash” as characterised by Karley et al. (Reference Karley, Parker, Pitchford and Douglas2004); the decline often occurs after mid-season and cannot be called a “crash” as it occurs over weeks, not days. Perhaps, this widespread phenomenon would be better characterised as a “mid-season population decline”, with the timing of the start of the decline more variable than suggested by Karley et al. (Reference Karley, Parker, Pitchford and Douglas2004). This annual rise and decline in aphid population results from processes that curtail the rise in abundance and ultimately cause a decline that usually prevents destruction of the host plant. In other words, this phenomenon reflects processes that regulate the population.
The seasonal rise and decline of local populations of U. rudbeckiae could result from a rising immigration rate in June and July, followed by a decline in immigration in August, in conjunction with rising predation as the population increases. The rise in prevalence and the short longevity of most colonies are consistent with this hypothesis, but not sufficient. Two population processes must occur if this hypothesis is correct: aphid immigration must rise in early summer and then decline in August, and predation must increase as the season progresses. Furthermore, predation must be sufficient to explain the decline and disappearance of large colonies as well as small newly established ones. These population processes are currently being investigated.
Acknowledgements
This paper was triggered in part by the review of Karley et al. (Reference Karley, Parker, Pitchford and Douglas2004), but also by a large number of short-term and long-term studies of aphid seasonal abundance. The authors wish to acknowledge the contribution of many of these studies even though we did not have space to cite them all.