 0) planes. Experiments have revealed the structural evolution: the formation of amorphous spheres in the initial reaction stage, followed by surface crystallization and nanoplate outward growth accompanied by inward dissolution of the amorphous spheres. Citrate in the precursor solution plays a dominant role in the formation of such porous ZnO hollow spheres. A model is presented, based on citrate-induced amorphous sphere formation and kinetically controlled dissolution and crystal growth. The model describes the formation of the hollow spheres, thermodynamically and kinetically.
I. INTRODUCTION
The micro/nanostructured materials (microsized objects with nanostructures) are usually stable against aggregation. These materials present high activities and high specific surface areas.Reference Zhao and Jiang1 They have attracted much attention in the fields of adsorbents,Reference Ma, Zhang and Yuan2 catalysts,Reference Lu, Cai and Zhang3 and sensors.Reference Zhang, Zhu, Zhang, Wang, Zhao and Yu4 ZnO is also an environmental friendly material whose surface has functional groups, such as hydroxyl groups, which can be the active sites for adsorption.Reference Meyer, Rabaab and Marx5, Reference Kikuchi, Qian, Machida and Tatsumoto6 ZnO with micro/nanostructures could thus be a good material for environmental treatment. Micro/nanostructured ZnO shows structurally enhanced photocatalytic and adsorptive performances compared with the conventional ZnO nanomaterials.Reference Lu, Cai and Zhang3, Reference Wang, Cai, Lin, Wang and Liang7 For instance, Lu et al.Reference Lu, Gao and Wang8 prepared three-dimensional Ag/ZnO hollow spheres, which showed significantly enhanced photocatalytic effect. Our previous work has demonstrated that pyramid-like hierarchical micro/nanostructured ZnO had much stronger photocatalytic effect than the ZnO nanoneedles, nanoparticles, nanosheets, and even TiO2 (P25).Reference Lu, Cai and Zhang3 In addition, the porous plate-like micro/nanostructured ZnO showed significantly enhanced adsorption performance as compared to the commercial ZnO nanoparticles.Reference Wang, Cai, Lin, Wang and Liang7 Recently, micro/nanostructured ZnO hollow objects, such as flower-like,Reference Lu, Wang, Wang, Xie, Chen and Lin9 tube-like,Reference Chen, Wang, Han, Gu and Guo10 coralline-likeReference Kowsari11 and tabour-like,Reference Zhang, Fu, Sui, Yang, Cao, Li, Li, Zhou, Leng, Zhao, Chen, Zhang, Jing and Zhao12 etc., have attracted attention due to their unique hierarchical structures. The formation of the hollow structures was attributed to conventional hard templates,Reference Caruso, Caruso and Mohwald13 galvanic replacement,Reference Sun, Mayers and Xia14, Reference Selvakannan and Sastry15 Kirkendall effect,Reference Yin, Rioux, Erdonmez, Hughes, Somorjai and Alivisatos16 micelle templating,Reference Xu and Wang17 and Ostwald ripening.Reference Ostwald18
Herein, we report a novel hollow micro/nanostructure, or the porous nanoplate-assembled micro/nanostructured ZnO hollow spheres, based on a modified hydrothermal strategy, using citrate as structural director, and subsequent annealing treatment. The hollow spheres are honeycomb-like and microsized (∼5–20 μm in diameter). The shell layers are built by the vertically standing, cross-linked porous nanoplates with an exposed surface of nonpolar (10 0) planes. The nanoplates are porous with ∼12 nm mean pore size and ∼25 nm thickness. To the best of our knowledge, this is a new structure in the family of ZnO nanostructures, although the some other ZnO hierachical micro/nanostructures were also reported.Reference Lu, Cai and Zhang3, Reference Du and Yuan19, Reference Li, Yu, Fang, Wang, Gui, Xu and Chen20 Further experiments reveal the formation of amorphous spheres in the initial stage, followed by surface crystallization and nanoplate outward growth accompanied by inward dissolution of the amorphous spheres. Citrate in the precursor solution plays a dominant role in the formation of such honeycomb-like porous ZnO hollow spheres. A model is presented, based on citrate-induced amorphous sphere formation and then kinetically controlled dissolution and crystal growth.
II. EXPERIMENTAL
In a typical experiment, zinc acetate dihydrate [Zn(CH3COO)2·2H2O] (0.66 g, 3 mmoL) and urea [(NH2)2CO] (0.54 g, 9 mmoL) were dissolved in 40 mL distilled water. Then, 0.06 g (0.2 mmoL) of trisodium citrate dihydrate (C6H5Na3O7·2H2O or TC for short) was dissolved in 10 mL distilled water. The above solutions were mixed (final TC concentration is 1.2 g/L, pH value is below 9.5) and stirred for 30 min before transferring into a 65 mL Teflon-lined autoclave and heated at 160 °C for 12 h. After cooling to the room temperature, the white products were then collected and washed with distilled water and ethanol several times. The final products were obtained by subsequently annealing the white products at 400 °C for 2 h.
X-ray diffraction (XRD) patterns were measured on a Philips X’pert diffractometer (Eindhoven, Netherlands) using Cu Kα radiation of 0.15419 nm in 2θ range from 10 to 80°. Morphology of the products was observed on a Sirion 200 FEG field emission scanning electron microscope (FESEM; Hillsboro, OR). High resolution transmission electron microscopic (HRTEM) examination was conducted on a JEOL-2010 microscope with an energy-dispersive x-ray spectrometer (Oxford, Link ISIS, Oxford, UK). Nitrogen adsorption isotherms were measured at 77 K on a Micrometrics ASAP 2020 equipment (Norcross, GA). The differential thermal analysis (DTA) and thermal gravimetric (TG) measurements were carried out on a thermal instrument (Shimadzu Corp., Kyoto, Japan) with a heating rate of 10 °C/min.
III. RESULTS
A. Morphology and structure
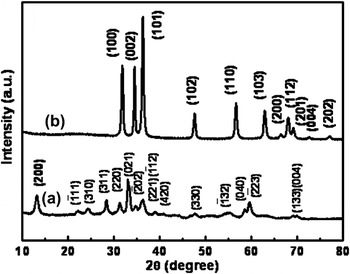
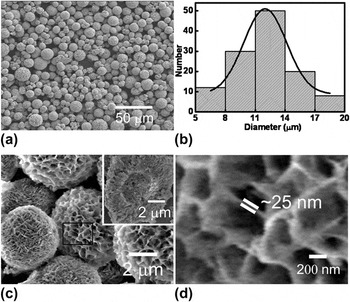
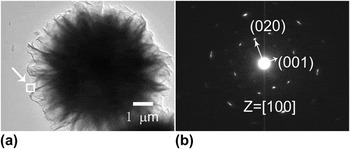
After reaction at 160 °C for 12 h, white products were obtained. The corresponding XRD pattern is shown in curve a of Fig. 1. All peaks are in agreement with those of monoclinic hydrozincite Zn5(OH)6 (CO3)2 (or ZnHC for short) phase (JCPDS Card No. 72-1100, space group C2/m) with lattice parameters of a = 13.62 Å, b = 6.300 Å, and c = 5.420 Å. FESEM observation has shown that the products consist of microsized spherical particles with rough surfaces. These spheres range from 5 to 20 μm in diameter centered around 12 μm, as illustrated in Figs. 2(a) and 2(b). Further, high magnification examination revealed that the spherical particles are honeycomb-like in morphology [Fig. 2(c)] or built of cross-linked nanosheets or nanoplates. The nanoplates are nearly vertically standing or radiate. Local magnification shows that the nanoplate is ∼25 nm in thickness, as illustrated in Fig. 2(d). By crushing the spheres with agate mortar, we found that they are hollow in structure with ∼5 μm in hollow size [the inset of Fig. 2(c)]. Figure 3 gives a typical transmission electron microscope (TEM) observation of a single hollow sphere. The selected-area electron diffraction (SAED) pattern indicates that the nanoplate is single crystalline with (100) planar surface.
X-ray diffraction (XRD) patterns of the product (a) before and (b) after annealing. Indexes in (a) and (b) correspond to the planes of the monoclinic Zn5(OH)6 (CO3)2 and wurtzite ZnO, respectively.

The morphology of the as-prepared ZnHC. (a) Field emission scanning electron microscopic (FESEM) image with low magnification. (b) Diameter distribution. The curve is the Gaussian fitting result. (c) The local magnified image. The inset is the image of a broken sphere. (d) The enlarged image corresponding to the rectangular area marked in (c).

Transmission electron microscopic (TEM) examination of a single honeycomb-like ZnHC hollow sphere. (a) TEM image. (b) The selected-area electron diffraction (SAED) pattern corresponding to a nanosheet arrow marked in (a).

After annealing at 400 °C for 2 h, the phase structure changes, as shown in curve b of Fig. 1. All peaks are in agreement with hexagonal wurtzite ZnO (JCPDS card no. 36-1451, space group P63mc) with lattice parameters of a = 3.249 Å, c = 5.206 Å. This means that final product ZnO is obtained by annealing the ZnHC products at 400 °C, which is in good agreement with the previous reports.Reference Wang, Cai, Lin, Wang and Liang7, Reference Jing and Zhan21, Reference Zeng, Yuan and Zhang22 The yield or productivity of our product is quite high, more than 70% based on the molar numbers of the zinc acetate dihydrate in the reaction solution and ZnO in the final products. It is easy to realize mass production using a large autoclave.
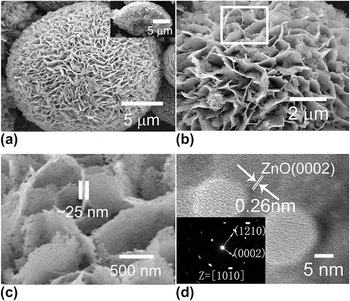
To determine the morphology of the annealed product, FESEM observation was carried out, as shown in Figs. 4(a) and 4(b). The morphology is similar to that of the honeycomb-like ZnHC hollow spheres. However, a close observation reveals a large number of pores distributed uniformly in the nanoplates within the honeycomb-like microspheres [see Figs. 4(b) and 4(c)]. Further, HRTEM examination shows that the nanoplate is single crystalline, as shown in Fig. 4(d). The fringes with a spacing of 0.26 nm fit well with the interplanar spacing of (0002) plane of ZnO structure. It is indicated, by indexing the SAED pattern [inset of Fig. 4(d)], that the ZnO nanoplates grow, along with [0001] and  axes, within the plane of
 [or (100)]. There exists a crystal orientation relation between the ZnHC nanoplate and the ZnO nanoplate in the honeycomb-like structure or ZnHC (100)//ZnO (100) or
 . The planar surface of such a ZnO plate is nonpolar. In addition, the pores within the nanoplates are seen in Fig. 4(d). The pores are around 10–15 nm in diameter. Although porous ZnO architectures obtained by thermal decomposition of zinc carbonate have been reported,Reference Wang, Cai, Lin, Wang and Liang7, Reference Zhang, Wang, Xu, Wang, Zhu, Zhang, Huang and Wu23 the porous nanoplate-built honeycomb-like ZnO hollow spheres, presented here, are a new structure in the family of ZnO nanostructures.
Morphology of the product after annealing. (a) FESEM image of a single sphere. The inset: a broken sphere. (b) Enlarged FESEM image of (a). (c): The enlarged image corresponding to the area marked in (b). (d) High resolution transmission electron microscopic image of a single sheet (inset: the corresponding SAED pattern).

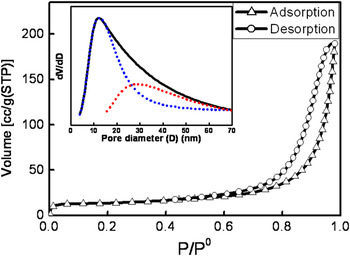
Figure 5 presents the nitrogen sorption isotherm. The isotherm is a typical type II sorption mode,Reference Brunauer, Deming, Deming and Teller24 which implies monolayer adsorption at low pressure and multilayer adsorption at high pressure. The specific surface area is estimated to be 46 ± 2.5 m2/g based on the Brunauer–Emmett–TellerReference Brunauer, Emmett and Teller25 equation. Pore diameter analysis shows two pore size distributions around 12 and 30 nm, respectively (see the dotted lines in the inset of Fig. 5). The former (12 nm) corresponds to the pores within nanoplates, and the latter (30 nm) corresponds to the spaces among nanoplates in the spheres. Such a porous micro/nanostructure should be stable against aggregation and keep the high active surface area during adsorption treatment in a solution. This material is easy to be separated from the solution and could exhibit high efficient adsorption performance in wastewater treatment, which has been confirmed in the weak acid or alkaline aqueous solution (as shown in Fig. S1).
Nitrogen sorption isotherm [the inset: pore size distribution (dotted lines: the fitting pore size distribution)] of the porous honeycomb-like ZnO hollow spheres (P and P0 are the pressure and saturated pressure of nitrogen, respectively).

B. Morphological evolution
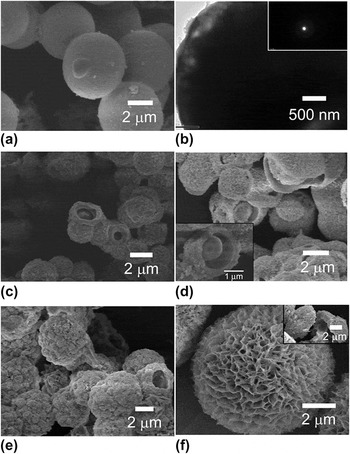
To reveal the formation of the honeycomb-like hollow spheres, the morphological evolution with the reaction time was examined, as shown in Fig. 6.
Morphologies of the products (ZnHC) after reaction at 160 °C for different times: (a) 5 min. (b) TEM image of a single sphere is shown in (a), the inset: the corresponding SAED. (c) and (d): 10 min (in different fields), inset in (d): FESEM image of a sphere with partially dissolved core part. (e) 1 h, (f) 2 h, the inset: a broken sphere.

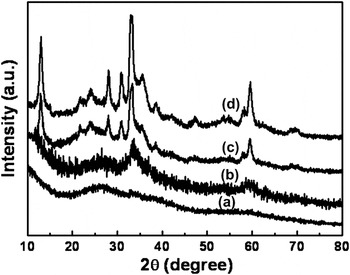
In the initial reaction state (say, in 5 min), a few 3–5 μm smooth spheres are formed [Fig. 6(a)]. TEM and XRD confirm that the spheres are amorphous [see the inset of Fig. 6(b) and curve a in Fig. 7]. Further reaction (10 min or longer) leads, on one hand, to appearance of the more smooth (or amorphous) spheres, and on the other hand, induces outward growth of “floc” on the surface of the preformed smooth spheres, as shown in Figs. 6(c) and 6(d). We can also see some spheres with a broken surface layer, which exhibit a partially dissolved core. The broken surface appears during product collection and FESEM sample preparation. XRD shows a diffraction peak at 2θ = 34° emerges [Fig. 7(b)], indicating that the surface layer is crystalline. This thin layer has been crystallized and is thus fragile. Crystallization of the preformed smooth spheres takes place in the surface layer after reaction for 10 min. Subsequent reaction induces continuous outward growth of the “floc,” leading to standing nanoplates. Meanwhile, the amorphous core dissolves and finally forms a hollow structure within 2 h, as shown in Figs. 6(e) and 6(f). The hollow core is comparable in diameter to that of the smooth amorphous spheres (3–5 μm in diameter). Such a process (dissolution and crystal growth) is slow compared with formation of the amorphous smooth spheres. After 2 h, almost all diffraction peaks of the phase ZnHC can be detected, as illustrated in Figs. 7(c) and 7(d). When the reaction time is longer than 2 h, the standing nanoplates grow while the hollow cores are unchanged in size. After 12 h, much larger micro/nanostructured honeycomb-like hollow spheres are obtained, as seen in Fig. 2.
The XRD patterns of the products (ZnHC) after reaction at 160 °C for different times: (a) 5 min, (b) 10 min, (c) 1 h, and (d) 2 h.

In a word, the results above indicate that when the reaction time is 5–10 min, 3–5 μm smooth amorphous ZnHC spheres are formed. After that, crystallization of the preformed smooth spheres starts in the surface layer. Then crystalline nanoplates grow outward on the crystallized surface layer of the spheres. Meanwhile, the amorphous core part underneath the crystallized surface layer dissolves continuously and forms a hollow structure within 2 h.
C. Influence of TC on morphology
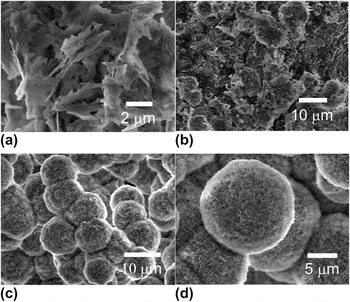
Further experiments revealed that TC in the precursor solution plays a dominant role in the formation of the micro/nanostructure. Figure 8 shows the morphological dependence on the TC content in the precursor solution. Without TC, only crystalline nanoplates are obtained and no amorphous phase is found during initial reaction, as shown in Fig. 8(a). The nanoplates are much thicker than those shown in Fig. 2(d). At a low TC concentration (0.6 g/L), nearly spherical aggregates are formed accompanied by some small nanoplates [Fig. 8(b)]. The regular honeycomb-like micro/nanostructured hollow spheres are formed (Fig. 2) only when the TC is about 1.2 g/L. When more TC is added, the morphology of the microspheres is similar, but the thickness of the standing nanoplates becomes thinner and the number density is higher, as shown in Figs. 8(c) and 8(d), corresponding to the TC contents of 2 and 4 g/L, respectively. If the TC content increases to more than 24 g/L, no product is obtained.
FESEM images of the products (ZnHC) obtained from the precursor solution with different trisodium citrate dihydrate concentrations. (a) 0 (g/L), (b) 0.6 (g/L), (c) 2 (g/L), and (d) 4 (g/L). Reaction temperature: 160 °C; reaction time: 12 h.

IV. DISCUSSION
During preparation of the precursor solution, the zinc acetate dihydrate and TC dissolve in water and the Zn2+ cations and C6H5O73− anions are released in the solution. When the precursor solution is heated at 160 °C, the following reactions took place.




First, the urea molecules in the solution hydrolyzeReference Zeng, Yuan and Zhang22 and release NH3·H2O and CO2 [see reaction (1)]. The NH3·H2O can release NH4+ and OH− ions in solution and then react with CO2 to produce CO32− anions. [reactions (2) and (3)]. Finally, the formed OH− and CO32− ions further react with Zn2+ to produce ZnHC molecules in the solution [reaction (4)].
A. Citrate adsorption-induced formation of amorphous ZnHC spheres
The concentration of ZnHC molecules in solution increases with reaction time. When the concentration reaches supersaturation, ZnHC colloids precipitate and grow. Correspondingly, the total free energy G for a spherical ZnHC solid phase should be the summation of its bulk and surface free energies and can be written as a function of its size,Reference Verhoeven26 or

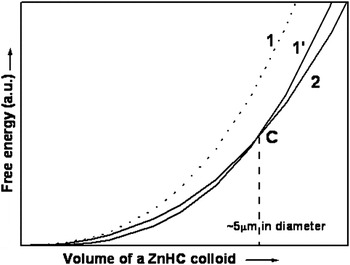
where R is the radius of the spherical phase, G v and σ are the free energy in unit volume and the specific surface energy for the sphere, respectively. Although the parameter values in Eq. (5) are not available, we can discuss qualitatively to understand the formation mechanism. Usually, the G v and σ for the amorphous ZnHC are larger than those of the crystal since the crystal ZnHC is more stable than the amorphous one in the normal case.Reference Wang, Cai, Lin, Wang and Liang7 That is, the total free energy G a of an amorphous sphere is larger than that (G c) of a crystalline phase with the same volume or G a > G c for all volume (or size). Considering the second derivative of G to R or G″ = f″(R,σ) > 0, the curves of G versus R should be up-concave from calculus. Figure 9 schematically illustrates such results. Curves 1 and 2 correspond to G a and G c versus size, respectively (curve 1 is higher than curve 2). This analysis means that precipitated ZnHC colloids should be crystal. However, the opposite is true in our case when the colloidal size is below ∼3–5 μm [Fig. 6(a)]. This discrepancy could be attributed to the existence of C6H5O73− in the solution.
Schematic illustration for the free energy of a solid ZnHC sphere as a function of its volume. Curves 1 and 1′ correspond to an amorphous ZnHC sphere without and with C6H5O73− adsorption, respectively. Curve 2 is for a crystal ZnHC sphere.

The C6H5O73− will adsorb on the ZnHC colloids, which was previously reported.Reference Tian, Voigt, Liu, Mckenziei, Mcdermott, Rodriguez, Konishi and Xu27, Reference Kuo, Kuo and Huang28 Such adsorption will decrease the colloidal specific surface energy σ. When R is very small, the second term in the right of Eq. (5) is dominant or 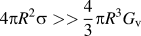 . If there is a significant decrease in σ value, curve 1 could decrease and be lower than curve 2 when the size is small enough, as schematically shown in curve 1′ of Fig. 9. In this case, a critical size Cs exists though the exact value is known. When the colloidal size is smaller than Cs, amorphous phase is more stable than crystallized phase. Otherwise, when the size is larger than Cs, the opposite is true. On this basis, in our case, we believe that the Cs falls in the range 3–5 μm due to the adsorption of C6H5O73−. When the colloidal size is smaller than 3–5 μm, the amorphous ZnHC phase is stable. When the size is bigger (>3–5 μm), the crystallized ZnHC phase will be more stable. Crystallization will take place starting in the surface layer of the amorphous spheres [Figs. 6(c) and 6(d)]. Meanwhile, crystal growth occurs outward on the crystallized layer due to attachment of the ZnHC molecules in the solution and form the rough surface morphology [Figs. 6(c) and 6(d)].
B. Kinetically controlled amorphous spheres’ dissolution and nanoplates’ growth
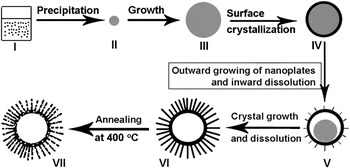
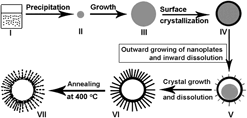
Once surface crystallized layer of the spheres is formed, further inward crystallization will induce a significant increase of elastic or distortion energy due to the crystallization-induced structural contraction.Reference Verhoeven29 Crystallization of the amorphous part underneath the surface crystallized layer should be difficult and would stop. The dissolution of the amorphous part should be easier since the chemical potential of the ZnHC molecules is higher in the core part than in the crystallized surface layer. So, after the surface layer of amorphous spheres crystallizes, the ZnHC molecules in the inner parts would dissolve and the hollow structure is thus formed, which was finished within 1–2 h in our experiment [see Figs. 6(c)–6(f)]. Meanwhile, ZnHC molecules in the solution, due to the reaction and dissolution, will diffuse to and attach on the outward growing crystal phase. Since crystal ZnHC is of layered structure along the plane (100),Reference Jing and Zhan21 it favors plate-like growth with exposed plane of (100) [Fig. 3(b)], leading to vertically standing nanoplates and formation of the final honeycomb-like hollow spheres (Fig. 2). Figure 10 schematically shows the formation process of the honeycomb-like ZnHC hollow spheres (stages I–VI).
The schematic illustration of the formation process of a standing porous nanoplate-built ZnO hollow microsphere. Stage I: supersaturated solution. Stage II: a precipitated amorphous ZnHC colloid with small size. Stage III: the amorphous ZnHC sphere with enough big size (say, ∼5 μm) due to growth. Stage IV: the amorphous sphere with crystallized surface layer (shell). Stage V: the sphere with outward growing nanoplates on the crystallized surface layer and partially dissolved core part. Stage VI: the standing nanoplate-built ZnHC hollow sphere. Stage VII: the standing porous nanoplate-built ZnO hollow sphere. Note: gray color corresponds to the amorphous phase and the black color to the crystallized phase.

C. Effects of TC
Based on the above discussion, citrate anions (C6H5O73−) released from TC in the precursor solution are crucial to the formation of the honeycomb-like micro/nanostructured ZnHC hollow spheres. It means that the amorphous spheres in the initial stage will not be formed during reaction, without the addition of TC in the precursor solution, due to the lack of C6H5O73− adsorption. This prediction has been confirmed, as shown in Fig. 8(a). Only crystal nanoplates were found but no amorphous phase was observed during initial reaction. Furthermore, after addition of TC, the C6H5O73− adsorption will also occur on the nanoplates. Increase of TC content leads to the formation of the thinner and denser nanoplates on the hollow spheres, as seen in Figs. 8(c) and 8(d). Furthermore, citrate is a chelating ligand, which can react with metal ions, form the complex, and control the release of metal ions.Reference Hao, Xu, Li and Qian30–Reference Sui, Fu, Yang, Zeng, Zhang, Zhao, Li, Zhou, Leng, Li and Zou33 So, if we add too much TC (say, 24 g/L or higher), a large amount of zinc cations would combine with citrate anions,

hence no product would be formed due to no adequate free Zn2+ in the solution.
D. Formation of porous honeycomb-like ZnO hollow spheres
When the obtained ZnHC phase was subsequently annealed at 400 °C, the following reaction would take place:

The preformed ZnHC decomposes into ZnO, H2O, and CO2. As previously reported,Reference Wang, Cai, Lin, Wang and Liang7 ZnHC nanoplates with the exposed plane of (100) should consist of zinc octahedrons Zn3(OH)6O2 and tetrahedrons Zn(OH)3O, which are held together by CO3 groups. Annealing induces collapse of the octahedrons and tetrahedrons in the ZnHC and contraction to Zn–O tetrahedrons, forming ZnO nanoplates with (100) or  planar surface, as seen in Fig. 4(d). The crystal orientation relation of ZnHC (100)//ZnO (100) comes from the structural contraction induced by release of CO2 and H2O.Reference Wang, Cai, Lin, Wang and Liang7 Formation of pores or voids in the ZnO nanoplates is attributed to the topotactic transformation or a contraction of the original structure, i.e., the Zn number density in wurtzite is higher compared to the precursor ZnHC, from which CO2 and H2O release. Such contraction of the original structure leads to voids (see stage VII in Fig. 10).
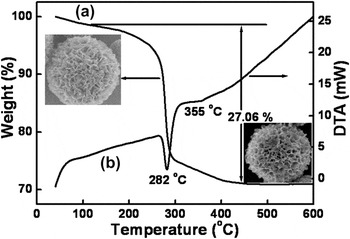
Further, the decomposition of ZnHC is demonstrated by DTA and TG measurements, as shown in Fig. 11. The mass loss below 120 °C is ascribed to the removal of a small amount of adsorbed water. The weight loss in the range from 120 to ∼300 °C (endothermal peak at 282 °C) is mostly attributed to the decomposition of ZnHC, which leads to the release of CO2 and H2O and leaves the porous ZnO [reaction (7)]. The last stage of mass loss takes place from 300 to 450 °C (endothermal peak around 355 °C) due to the complete pyrolysis of ZnHC. The total mass loss in the range from 120 to 450 °C is 27.06%, which is in good agreement with the theoretical value (25.87%) calculated from reaction (7).
Thermal analysis results of the as-prepared ZnHC. (a): Thermal gravimetric (TG) measurement. (b): Differential thermal analysis (DTA) curve. The up-left and down-right insets are the morphology of a hollow sphere before and after TG measurement, respectively.

V. CONCLUSION
In summary, we can fabricate the porous nanoplate-built honeycomb-like ZnO hollow spheres with high yield, based on a citrate-directed hydrothermal strategy and subsequent annealing treatment. Such honeycomb-like ZnO hollow spheres are 5–20 μm in size with 46 m2/g in specific surface area. The shell layers of the hollow spheres consist of the vertically standing and cross-linked single crystalline porous nanoplates. Citrate anions in the precursor solution play a dominant role in the formation of such structures. On the presence of citrate, we observe formation of amorphous spheres in the initial reaction stage, and then surface crystallization and nanoplates’ outward growth accompanied by inward dissolution of the amorphous spheres. A model is presented, based on citrate adsorption-induced amorphous sphere formation followed by kinetically controlled amorphous sphere dissolution and nanoplate growth. Due to the unique micro/nanostructure, such porous nanoplate-built honeycomb-like micro/nanostructured material can be used as an efficient adsorbent to remove the heavy metal ions [Cu(II), Pb(II), Cd(II), and Ni(II), etc.] from contaminated water. The material exhibits significantly structurally enhanced adsorption to the heavy metal cations, as typically demonstrated in Fig. S1.
ACKNOWLEDGMENT
This work was financially supported by the China Postdoctoral Science Foundation (Grant No. 2011M501407) and Natural Science Foundation of China (Grant No. 21001002).