Introduction
The second half of the twentieth century witnessed substantial decreases in fertility in Indonesia (McNicoll & Singarimbun, Reference McNicoll and Singarimbun1983; Hull, Reference Hull1987; Hull & Hull, Reference Hull and Hull1997; Jones & Hull, Reference Jones and Hull1997). For decades, demographers have studied the reasons for these shifts, including economic status (Hull & Hull, Reference Hull and Hull1997), ethnicity and religion (Tan & Soeradji, Reference Sujarwoto and Tampubolon1986), geographical development disparities (Hull & Hatmadji, Reference Hull and Hatmadji1990), migration (Hirschman & Guest, Reference Hirschman and Guest1990), education and family planning (Angeles et al., Reference Angeles, Guilkey and Mroz2005) and public service infrastructure (Grimm, Reference Grimm, Sparrow and Tasciotti2015). Yet recent dramatic shifts in fertility in Indonesia may have markedly influenced family life and well-being. However, the consequences of Indonesia’s fertility transition for family well-being require further investigation. Specifically, previous studies have rarely examined how, and to what extent, universalizing small family norms following a successful national family planning programme in the country has affected family well-being.
Two contrasting views of the relationship between small family norms and family well-being have been expounded in economic demography studies. The first argues that more children decrease family well-being and that a small family is the key to improving this (Malthus, Reference Malthus1978; Kelley, Reference Kelley2001; Raley, Reference Raley2001; Aligica, Reference Aligica2009). Malthusians argue that high fertility goes hand in hand with low family well-being (Malthus, Reference Malthus1978; Aligica, Reference Aligica2009). Because high birth rates yield large numbers of children relative to the number of working adults, savings that might otherwise be invested within families must be diverted to meet the immediate food, housing, basic health care and education needs of a relatively large numbers of children (Kelley, Reference Kelley2001; Raley, Reference Raley2001). This prevents families making the longer-term investments needed to lift themselves out of poverty. In contrast, lower fertility causes the number of working-age adults to rise relative to the rest of the population, laying the foundation for the so-called ‘demographic dividend’. With fewer children, parents can invest more in each child’s education, thereby increasing skills and human capital. Families with fewer children tend to save more for their retirement, so more money is available for investment (Kelley, Reference Kelley2001; Yount et al., 2014). All of these factors lead to improvements in family well-being.
In contrast, the second view argues that the linkages between fertility and family well-being occur at different stages of the transition from high to lower fertility. When fertility begins to decline, the process creates – but for only a limited period of time – a demographic ‘window of opportunity’ during which increased personal savings and investment become possible (Birdsall & Sinding, Reference Birdsall and Sinding2001; Williamson, Reference Vogl2001). When fertility is high, the proportion of the population made up of children and teenagers is large relative to that of working adults. As fertility rates drop, the ratio of potential workers (people aged 15–64) to non-workers (people aged 14 or younger, and people aged 65 and older) rises, meaning that more workers are responsible for fewer children. This reduction in the ratio of youthful dependants to working-age adults should enable families to increase their stocks of physical and human capital. However, this demographic window of opportunity does not guarantee improvements in family well-being.
Researchers have proposed three reasons for which small family norms do not guarantee improvements in family well-being. First, fewer children does not lead to better family welfare and well-being if families spend less on improving the skills and knowledge of their family members (Merrick, Reference Merrick2002). Second, with a lack of skills and knowledge in the younger generation, productive employment cannot be created and fewer members of the young generation can access better jobs (Kelley, Reference Kelley2001). Third, lack of economic and social policies from government prevent the large wave of potential workers acquiring skills and finding productive employment. Therefore, government support, in the form of economic and social policies that allow potential workers to acquire skills and find work, is needed to convert the accumulation of physical and human capital into economic welfare and well-being (Merrick, Reference Merrick2002). When this occurs, as it has in countries such as South Korea and Taiwan, a temporary surge in the accumulation of physical and human capital contributes to a rapid rise in family well-being (Birdsall & Sinding, Reference Birdsall and Sinding2001).
Thus, one of the key questions raised in this study is whether Indonesia will experience improvements in economic welfare and well-being similar to those witnessed in South Korea and Taiwan. Research on the effects of the rapid fertility decline in Latin America urges caution (Merrick, Reference Merrick2002). Economic growth has been slower in Latin America than it was in East Asia in the 1970s, in part because of the failure of Latin American countries to invest sufficiently in education, particularly for the poor. Moreover, economic policies in Latin America were less conducive to the creation of productive employment for the working-age population than those in East Asia. Similar policy failures in South Asia have increased the likelihood that India and Bangladesh, which are now moving into the later stages of their transitions into low fertility, may not benefit at all from the favourable demographic conditions created by those transitions (Williamson, Reference Vogl2001). The demographic window of opportunity is a one-off and relatively brief phenomenon (approximately two decades, depending on the speed of the transition), and it would be unfortunate if the successful efforts of Indonesia to achieve lower population growth failed to lead to improved well-being among its citizens.
Indonesia is often cited as having one of the most successful national family planning initiatives in the world (World Bank, Reference Williamson1992). This effort is being made through mass communication that the concept of small family norms is accepted, adopted and woven into the lifestyle of Indonesian’s families. The country doubled its contraceptive prevalence rate to nearly 60% between 1976 and 2002; it also halved its fertility rate from 5.6 children per woman in the 1970s to 2.4 children per woman since 2002 (UNFPA, 2014). Indonesia’s population is now composed of more working-age people than ever before, both in absolute numbers – at 157 million potential workers – and as a proportion of the total population, accounting for 66% of all Indonesians (UNFPA, 2014). Indonesia is also reported to be one of the top ten biggest upward movers in the UNDP’s Human Development Index (UNDP, Reference Tan and Soeradji2014). The country’s efforts to meet the Millennium Development Goals (MDGs) were quite successful, with several of the goals related to poverty reduction, health and education being reached. Between 1970 and 2015, the proportion of Indonesians living below the national poverty line fell from 60% to less than 11% (World Bank, 2014). Recent studies have also shown improvements in Indonesian family economic welfare and well-being both at national and sub-national levels over the last decade (Hanandita & Tampubolon, Reference Hanandita and Tampubolon2016).
Nevertheless, the country has recently begun to face the issue of increasing youth unemployment. The unemployment rate among young potential workers soared to 19.9% in 2013, the highest in the South-east Asian region (UNFPA, 2014). Access to university education also remains very low. The World Bank (2014) reported an increase in gross university enrolment rates in the country from 6% in 2004 to 11.5% in 2014. There are endemic disparities in access to university education between people living on Java Island and outside Java Island as most university facilities are located on Java (Sujarwoto & Tampubolon, Reference Sujarwoto and Tampubolon2016). The urbanization of productive-aged, highly educated people has also increased sharply in the last three decades. Indonesia’s population in urban areas increased from only 17.3% in 1971 to 49.8% in 2015 (UNFPA, 2016). With most productive, highly skilled people living in urban areas, most families in rural areas have lower levels of well-being and tend to be poorer (Resosudarmo & Vidyattama, Reference Resosudarmo and Vidyattama2006; Hill et al., Reference Hill, Resosudarmo and Vidyattama2008; Yusuf et al., Reference Yount, Zureick-Brown, Halim and LaVilla2014). Indonesia’s levels of inequality are also relatively high and are climbing faster than those of most of its East Asian neighbours. Yusuf et al. (Reference Yount, Zureick-Brown, Halim and LaVilla2014) reported a sharp increase in Indonesia’s Gini coefficient over the past 15 years, increasing from 30 in 2000 to 41 in 2013. Studies have also noted that decentralization reform in the last decade is contributing to deepening disparities across districts. Sujarwoto and Tampubolon (Reference Sujarwoto and Tampubolon2015), for example, found that only district governments that are able to formulate sound development plans, allocate budgets efficiently and deliver public services effectively are competent to transfer the benefits of decentralization to their citizens. As policies and resources are transferred to district governments during the process of decentralization, the potential of low fertility rates to improve family well-being depends on district governments’ ability to deliver better economic and social policies. Therefore, this study also considers in some depth whether disparities across socioeconomic groups and geography, as well as the effectiveness of district-level social and economic policies, relate to the universalizing of small family norms and family well-being in the country.
Following the 2007 definition of the Economic and Social Research Council, well-being in this study refers to ‘a state of being with others, where human needs are met, where one can act meaningfully to pursue one’s goals, and where one enjoys a satisfactory quality of life’. Well-being is enabled through investment in basic needs for survival, health and nutrition (Gough & McGregor, Reference Gough and McGregor2007). The OECD (2009, 2011) further suggested several indicators to measure well-being, including the presence of resources such as income, satisfactory housing and access to services. Based on this approach, the study used four indicators to measure family well-being: (1) household income/expenditure, (2) household housing conditions, (3) household access to basic health services and (4) household access to education services. Hereafter, family well-being refers to these measures. Small family norms are defined as a norm of parents with one or two children.
Methods
Data sources
The individual data used in the analysis were taken from the 2006–2014 Indonesian Socio-Economic Survey (Susenas) conducted by Indonesia’s Bureau Statistics. This is one of the oldest nationally representative surveys in a developing country and is the best-regarded of them (Friedman & Levinsohn, Reference Friedman and Levinsohn2002; Ravallion & Lokshin, Reference Ravallion and Lokshin2007); it is also the only such survey in Indonesia covering the entire archipelago (Pradhan et al., Reference Pradhan, Suryahadi, Sumarto and Pritchett2001; Biro Pusat Statistik, 2009). Conducted by the government’s Central Bureau of Statistics, it has been carried out annually since 1993 and is representative at the district level. The annual sample size is about 250,000 households (close to 1.2 million individuals; Biro Pusat Statistik, 2009) covering all districts in the country. The total sample in the present study consisted of 2.3 million families living in 483 districts across the archipelago.
The survey instrument contains a core questionnaire, which collects information on the socio-demographic characteristics of individuals and households, their jobs, education, housing conditions, access to immunization and consumption. This information was used to measure family well-being and control variables.
The Susenas data were linked to official statistics. First, levels of district spending on public services were used to determine whether the country’s fiscal decentralization reform has enhanced family well-being. District public services spending data were retrieved from the Ministry of Finance. Fiscal data from 2005–2013 (the year before the Susenas survey) were used as district public service spending in the Indonesian budgeting system requires at least a year to take effect. Second, district GDPs were included to examine whether district economic development affects family well-being. Third, district population was used to control whether population density affects family well-being. District GDP and population data from 2006–2014 were retrieved from Indonesia’s Central Bureau of Statistics. Fourth, the data on numbers of universities were retrieved from Indonesia’s Village Potential Census or Podes, 2006–2014.
Variables
Measures of small family norm and family well-being. In the Susenas survey, ‘family’ is defined as a group of people who reside together and eat from the same cooking pot. ‘Small family’ is defined as a binary variable (1=a family with parents having one or two children; 0=a family with parents having more than two children). There are some families with more than one women in the Susenas dataset: for example, when the household head has more than one wife (is polygamous). In this case, small family norm was calculated based on total number of children present from his wives. Sometimes there is a women in a household who is not the wife of the household head but a daughter or daughter-in-law. These were dropped from the analysis, and only the wife of the household head was used.
Following the OECD (2009), ‘family well-being’ was measured by means of four indicators. First, family consumption expenditure was measured with a dummy variable (1=a family with spending above US$1.25 per day; 0=a family with spending less than US$1.25 per day). The World Bank poverty headcount measure for low- to middle-income countries (US$1.25 per day) was used to determine whether a family was poor or not poor. Second, family housing condition was measured with a binary variable (1=a family house with an adequate roof, walls and floor; 0=a family house with inadequate roof, walls or floor). Third, children aged 13–15 within a household who had completed 9 years of school (junior secondary school) was used as a measure of human capital well-being. Fourth, access to complete immunization (DPT1-3, BCG, OPV0-3, HB0-3 and measles) for children was used as a measure of family well-being in terms of health care access. A binary variable (1=received complete basic immunization; 0=did not receive complete basic immunization) was created to measure immunization access of children within a family. The aggregate of all scores was calculated as a measure of family well-being.
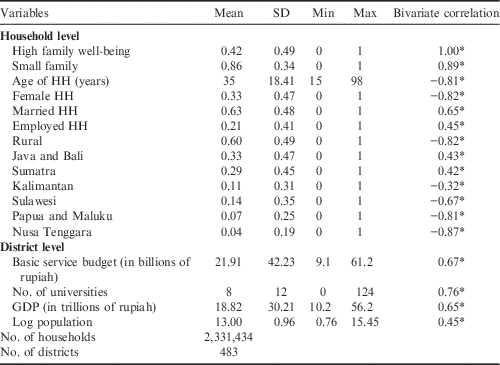
Control variables. Household head age, gender, marital status, employment status and rural residence were included as control variables. District GDP and public service spending were included to determine whether district economic capacity in economic development and basic public service delivery in decentralized Indonesia are associated with family well-being. District population was included to assess whether population density affects family well-being. The number of universities within a district was used to examine whether higher education supply factors are related to access to university education and family well-being. Table 1 shows the summary statistics of the variables used in the study.
Summary statistics (proportions) of household- and district-level variables, Indonesia 2006–2014

*p <0.01.
Statistical analysis
Several steps were taken to analyse the data. First, because the Susenas surveys are representative at the district level, data for small family and family well-being in the household were aggregated to calculate the low-fertility and high family well-being proportion. The average fertility and family well-being indicators for high- and low-fertility groups were calculated to identify trends in low fertility and high family well-being at the national level. The cut-off used for low fertility was 2.1 children per woman aged 15–49. Family well-being was calculated from the aggregate score of family consumption expenditure, family housing conditions, family access to basic education and complete immunization access for children within a family. High family well-being in this paper means the family has access to good housing, spends at least $US1.25 a day, had completed child immunization and the household head had 9 years of basic education.
Second, to identify disparities among the benefits of small family on family well-being, the prevalence of high family well-being by socioeconomic group and geographic location was calculated. The high family well-being prevalence of the low-fertility group was compared by age, gender, employment status and education status, urban/rural residence, island and district. Age was divided into two groups: younger household head (25–50 years) and older household head (65 years and older). Employment status was categorized into two groups: household with children aged 16 and above working in a formal job, and those working in a non-formal job. Education status was categorized into two groups: household with children age 16 or above educated at university or not. Indonesia’s islands were divided into six categories: Sumatra, Java & Bali, Kalimantan, Sulawesi, Papua & Maluku and Nusa Tenggara. Maps illustrating the distribution of low fertility and high family well-being across government districts were then created.
Third, to examine the link between small family and family well-being level, multilevel analyses were performed. These were used to assess the effect of district-level characteristics on family well-being, assuming that the association between the dependent variable and its covariates varied at the district and household levels (Ballas & Tranmer, Reference Ballas and Tranmer2012). Hence, the analysis accounted for the clustering of households in districts by separating household variance in well-being from district variance (Rabe-Hesketh & Skrondal, Reference Rabe-Hesketh and Skrondal2012). The links between district-level characteristics and family well-being could thus be examined appropriately. Previous studies that used this model were followed to examine the effect of district characteristics on family well-being (see, for example, Kawachi & Kennedy (Reference Kawachi and Kennedy1999) on district economic inequality and individual health; Sujarwoto & Tampubolon (Reference Sujarwoto and Tampubolon2015) on district public spending and citizen happiness; and Maharani and Tampubolon (Reference Hanandita and Tampubolon2014) on district public spending and immunization access).
The multilevel analyses were carried out in several steps. First, models were used to examine the link between small family and family well-being level. District-level variables were included (i.e. basic public service spending) to capture fiscal decentralization. To identify whether the effect of small family on family well-being varies by place of residence, the analyses were stratified into rural, urban and total samples. The regression model equation was as follows:
 $$E_{{ij{\asterisk}}} \,{\equals}\,{\beta}_{o} {\plus}\mathop{\sum}{{\beta}_{j} W_{j} {\plus}{\beta}_{{ij}} X_{{ij}} {\plus}{\rmu }_{j} {\plus}{\!}\in_{{ij}} } $$
with a household i nested in district j, and where E
ij*
=logit(P(E
ij*
=1) is a binary variable indicating family well-being level, a family with better well-being or not; W
j
is a set of district-level characteristics (i.e. GDP, public service spending and population density); X
ij
is a set of household-level characteristics (i.e. small family, household head’s age, gender, marital status and employment status); µ
j
is a random intercept varying over districts with a mean of zero and variance
 $\sigma _{\mu }^{2} $
; and ϵ
ij
is normally distributed with zero and variance
 $$\sigma _{{\epsilon}}^{2} $$
.
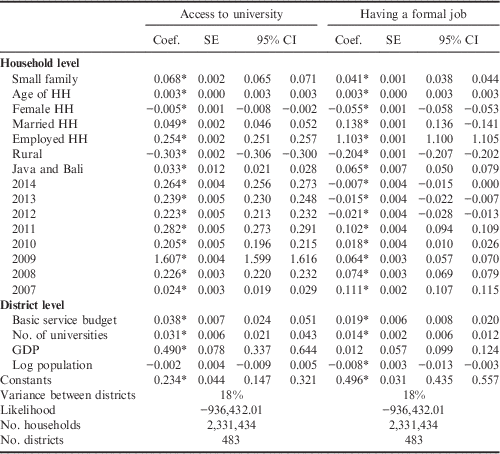
Second, multilevel analyses were used to examine the mechanisms by which small family improves family well-being level. In these analyses, E ij* =P(E ij* =1) is a continuous variable indicating proportion of family members (i.e. children and parents) who were educated at university (E ij1* ) and proportion of family members (i.e. children and parents) who had a formal job (E ij2* ). The variable W j represents a set of district-level characteristics (i.e. GDP, public service spending and population density) and X ij is a set of household-level characteristics (i.e. fertility, age, gender, marital status and employment status). A formal job is defined as a job within the formal sector such as a government office or company. Household- and district-level characteristics were included to control the means by which small family increases human capital and access to formal jobs.
Multilevel analyses were carried out using Generalized Linear Latent and Mixed Models (GLLAMM) commands in Stata 13. Rabe-Hesketh and Skrondal (Reference Rabe-Hesketh and Skrondal2012) explained that GLLAMMs are a class of multilevel latent variable models for (multivariate) responses of mixed type, including continuous responses, counts, duration/survival data, dichotomous, ordered and unordered categorical responses and rankings. For each of the models, the estimated coefficient, standard errors, district variances and log-likelihood as an indicator of model fit were reported. All models were estimated using maximum likelihood estimation.
Results
Trends in fertility and family well-being
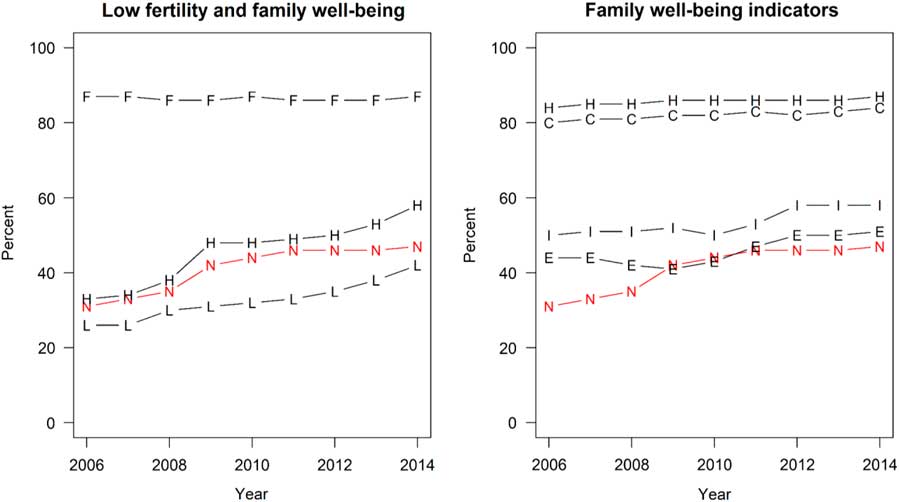
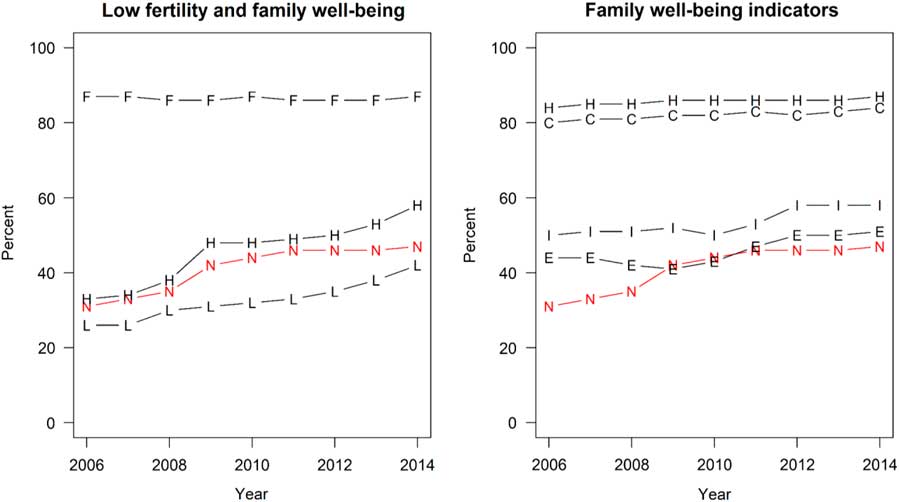
Indonesia’s Total Fertility Rate (TFR) remained stagnant in the years 2006 to 2014, with an average of 2.4 children per women aged 15–49 (OECD, 2014). This steady fertility rate was also reflected in the trend in the low-fertility measure in the Susenas dataset. Figure 1 (left panel) shows that there was a stable trend of low fertility in the study period, with an average of 86% of women aged 15–49 having two children or fewer. In the same period, families with high well-being at the national level increased substantially from 31% in 2006 to 47% in 2014. Increasing family well-being also appeared in both low-fertility groups (L) and high-fertility groups (H), but with marked differences. Figure 1 (right panel) illustrates the trends in family well-being indicators, i.e. access to basic education (E), daily consumption expenditure (C), housing condition (H), completed immunization (I) from 2006 to 2014. Improvements in all indicators were observed, with basic education being ranked lowest and basic housing conditions and daily consumption expenditure ranked highest.
Low fertility and family well-being indicators, Indonesia 2006–2014. Left panel: F=percentage of small families (families with two children or fewer); H=percentage of high family well-being families with two children or fewer; L=percentage of high family well-being families with three children or more; N=national percentage of high family well-being families). Right panel: H=percentage of families with good housing conditions; C=percentage of families spending at least US$1.25 per day; I=percentage of families with completed immunization; E=percentage of families where household head has completed 9 years of school.
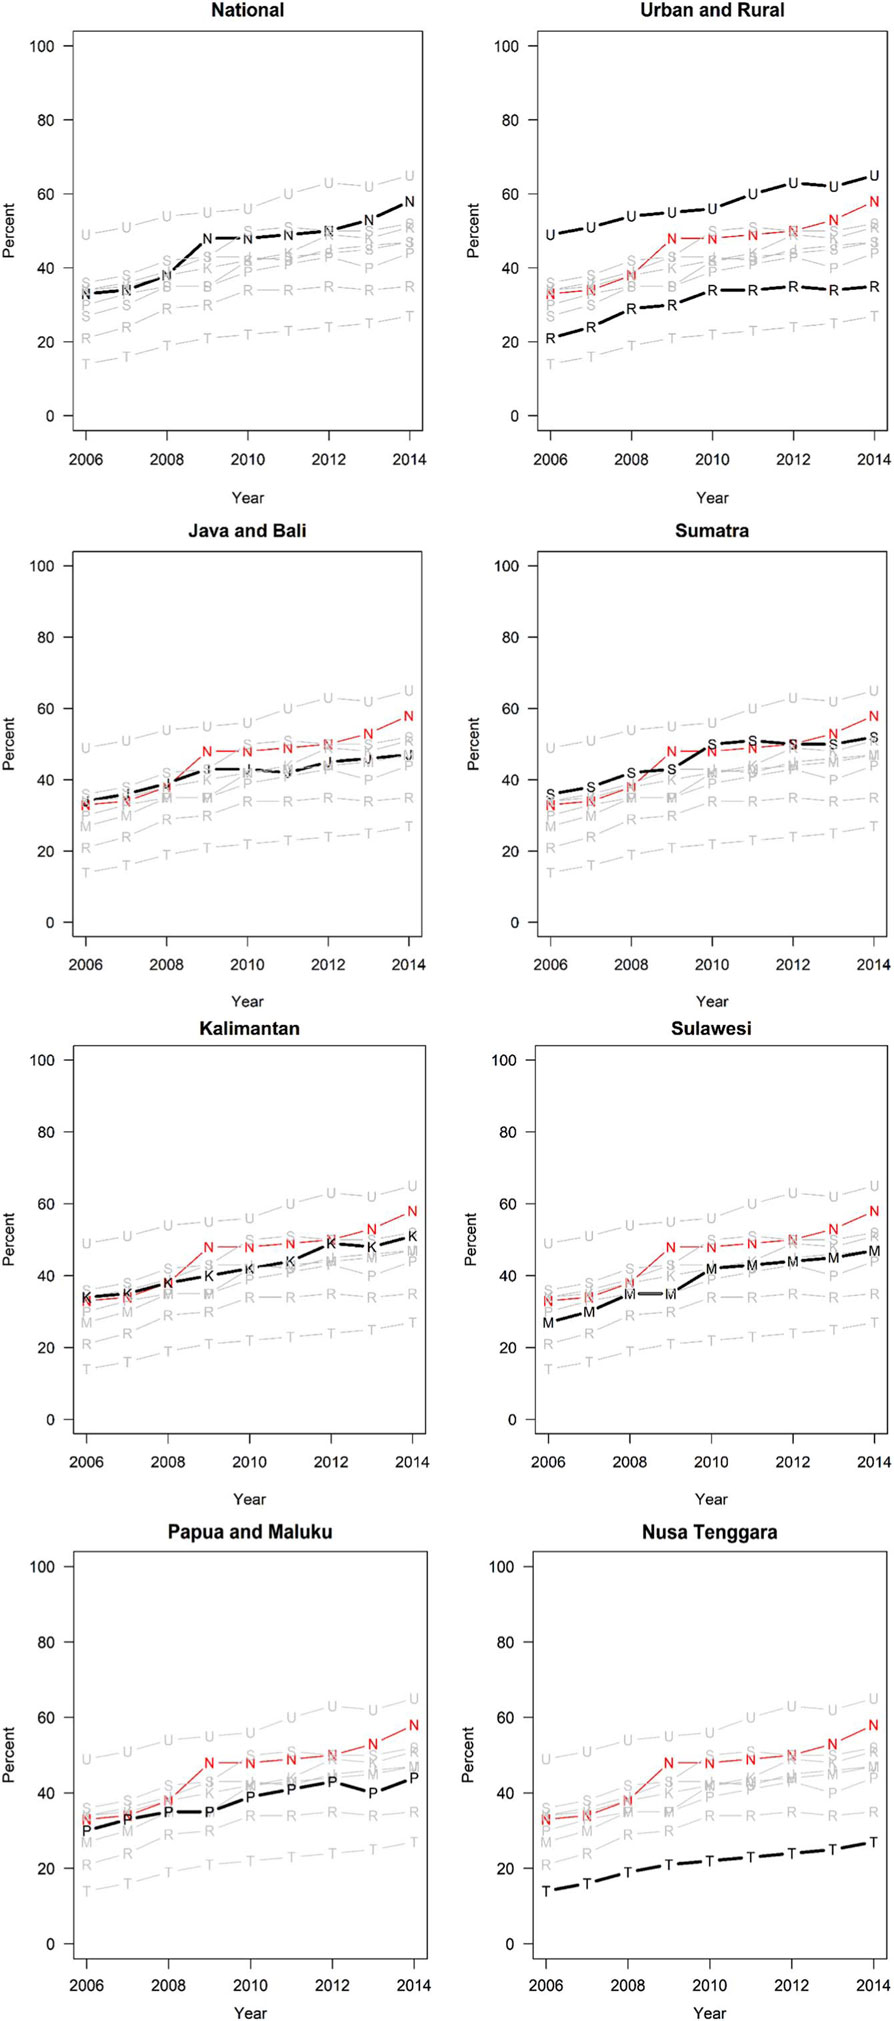
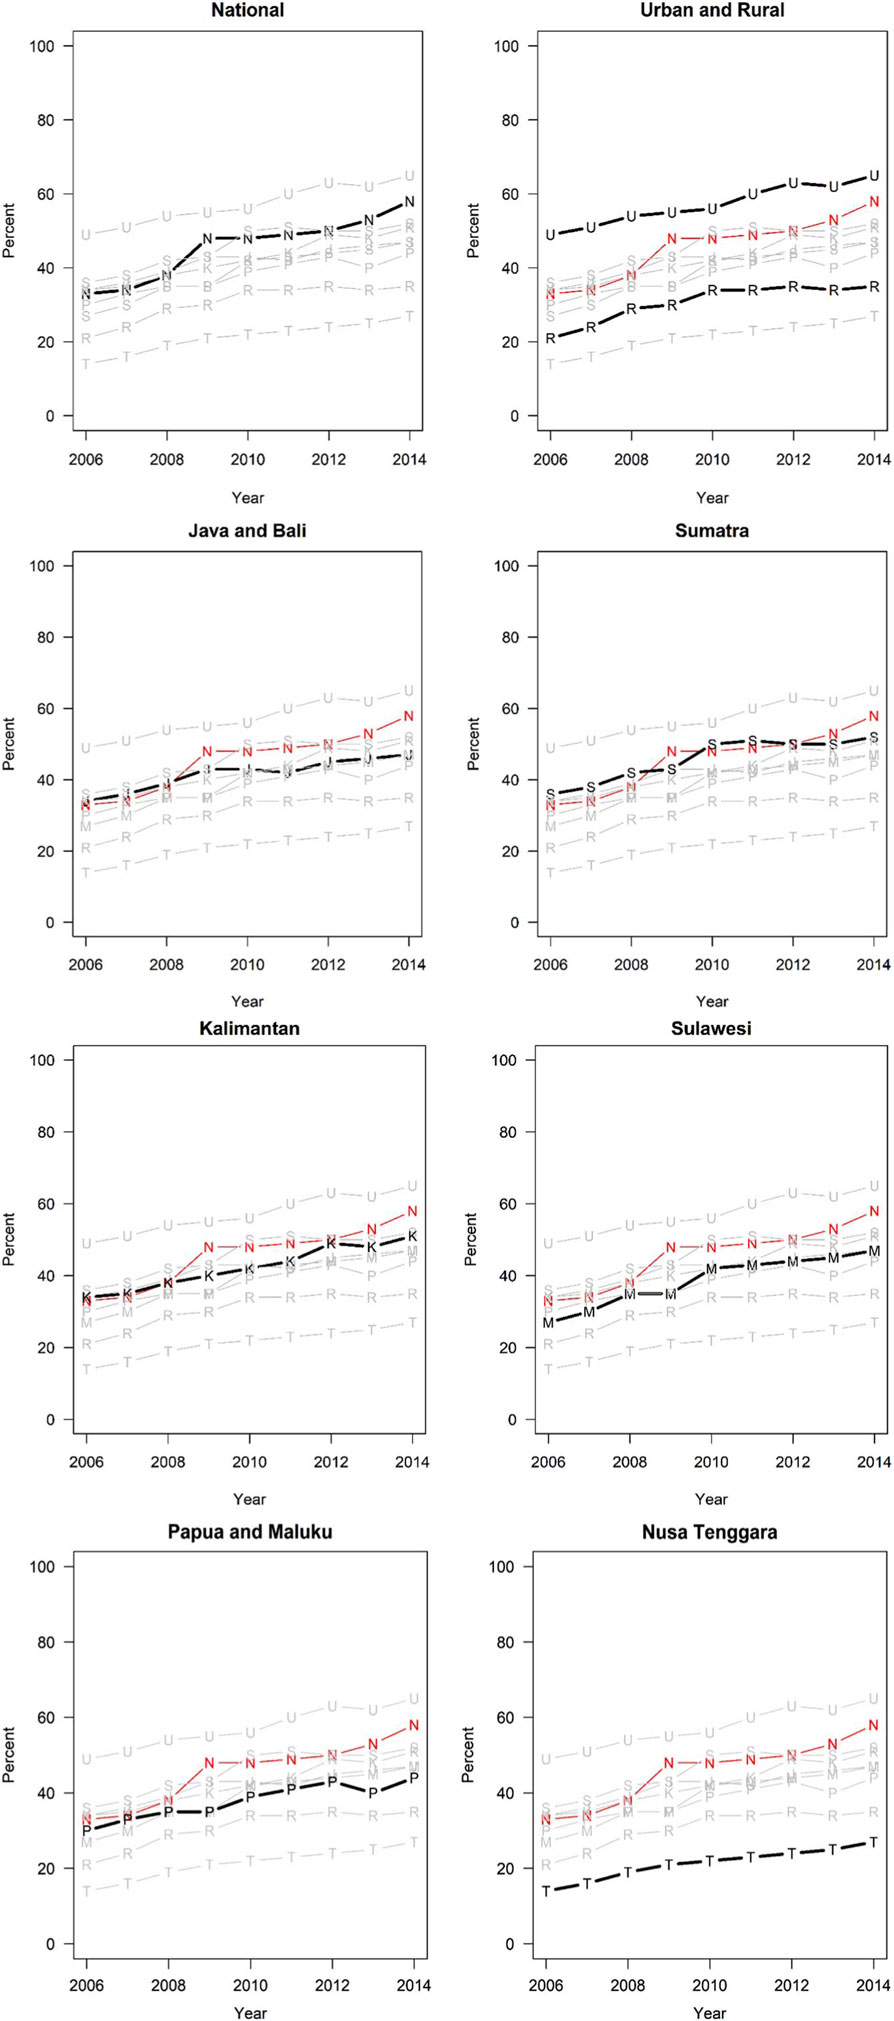
The study investigated whether disparities in family well-being existed by urban/rural residence and island groups over the study period (Fig. 2). Only the low-fertility group sample was used to examine the trend in family well-being. A disparity in high family well-being appeared between urban (U) and rural areas (R), as well as among islands. The gap in high well-being between urban and rural areas rose by 2% (from 28% in 2006 to 30% in 2014). Geographical variations in family well-being within the country were also prominent. While family well-being levels in Sumatra (S), Java and Bali (J) were close to the national average (N), that in Nusa Tenggara (T) was lower. The gap between Sumatra, Java and Bali and the remaining areas, especially Nusa Tenggara, widened over time. The gap in family well-being between Sumatra and Nusa Tenggara increased by 3% from 22% in 2006 to 25% in 2014.
Percentage of high family well-being families by urban/rural area and region, Indonesia 2006–2014. N=National, U=urban areas, R=rural areas, J=Java and Bali, S=Sumatra, K=Kalimantan, P=Papua and Maluku, M=Sulawesi, T=Nusa Tenggara.
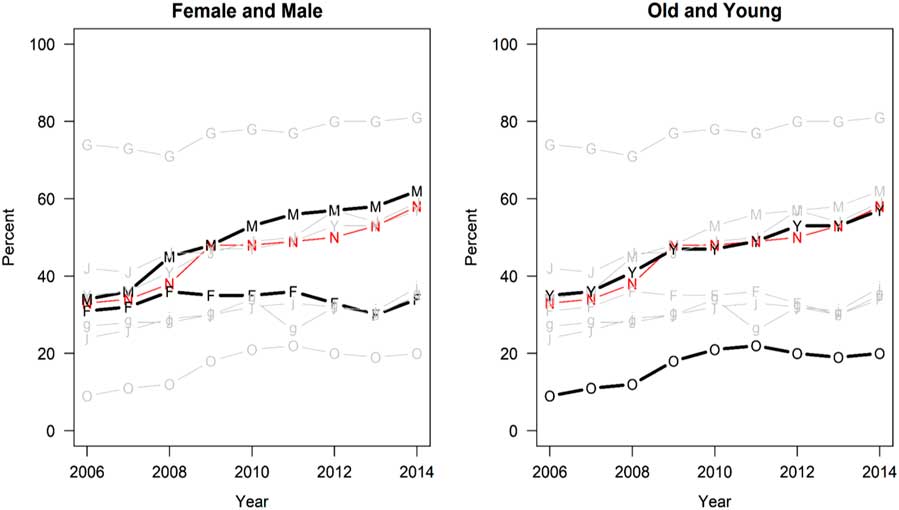
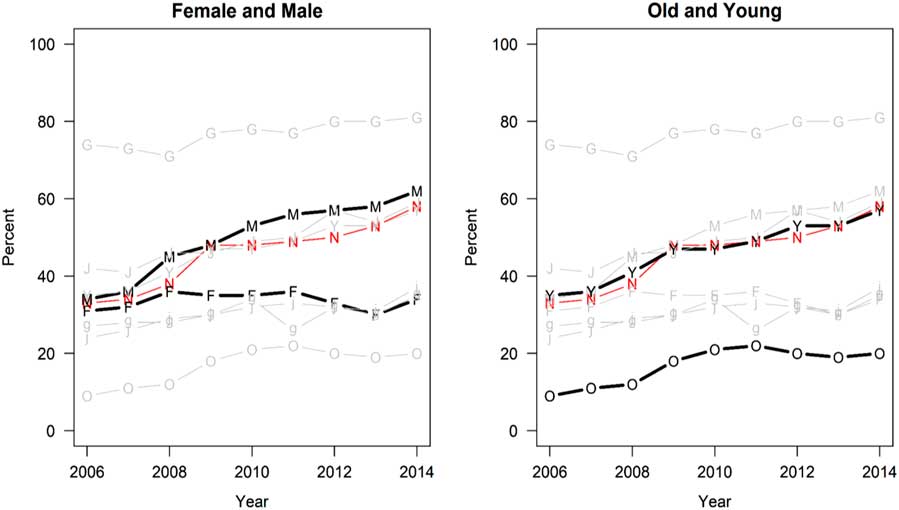
As for high family well-being by social group, gender and age in 2006–2014, families with male household heads had massively higher levels of well-being than those with female heads (Fig. 3). Likewise, families with older household heads had lower levels of well-being than those with younger household heads. The gap in well-being between older and younger families was marked (30%) and widened over the period examined.
Percentage of high family well-being families by gender and age of household head, Indonesia 2006–2014. M=male, F=female, O=older (65 years or older), Y=younger (25–50 years), J=formal job, j=non-formal job, G=university, g=high school education or below. All variables relate to household head.
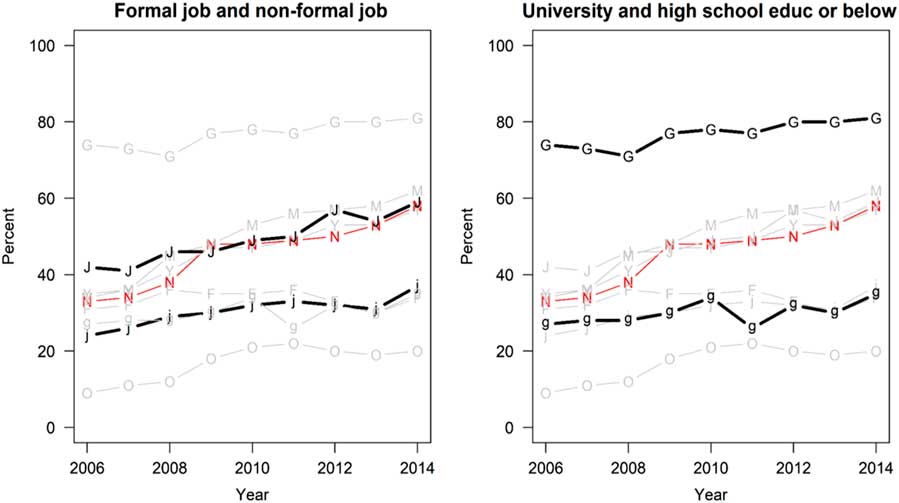
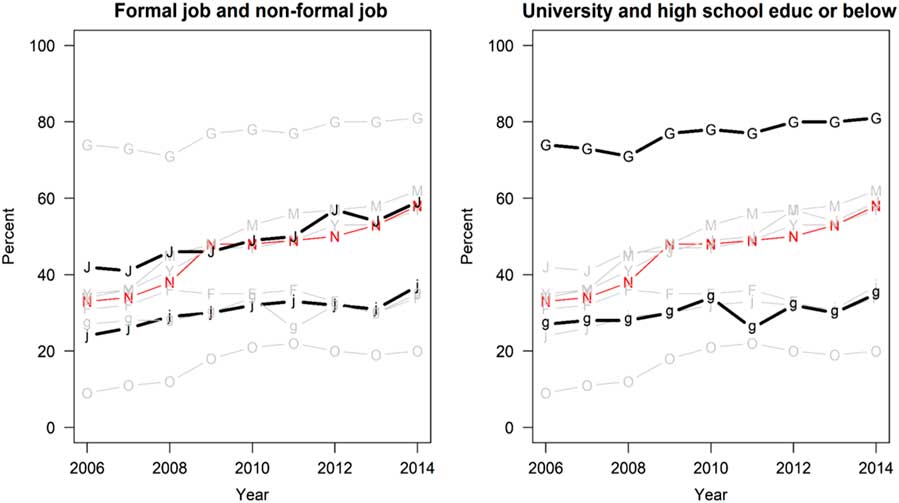
Disparities in high family well-being also occurred by education level and job status (Fig. 4). Families with a university-educated household head had higher levels of well-being than those with a household head with high school or lower education. A huge disparity in family well-being appeared between these two groups. Likewise, families whose head of household worked in a formal job had higher levels of well-being than those whose head of household worked in a non-formal job. Disparities in well-being between these groups increased continually over the period examined.
Percentage of high family well-being families by education and job status of household head, Indonesia 2006–2014. J=formal job, j=non-formal job, G=University, g=high school education or below, M=male, F=female, O=older (65 years or older), Y=younger (25–50 years). All variables relate to household head.
Geographical distribution of small family and high family well-being
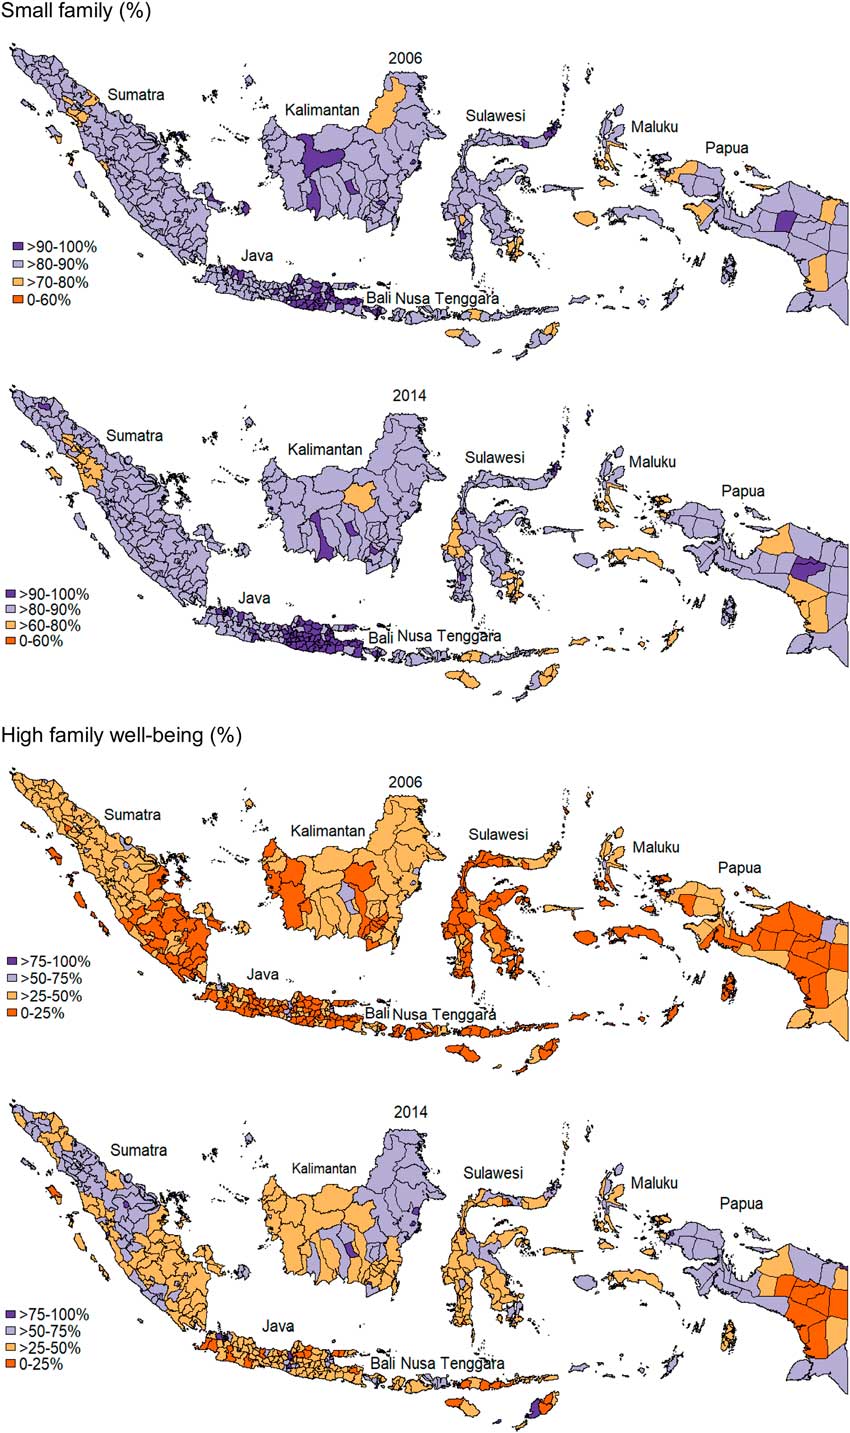
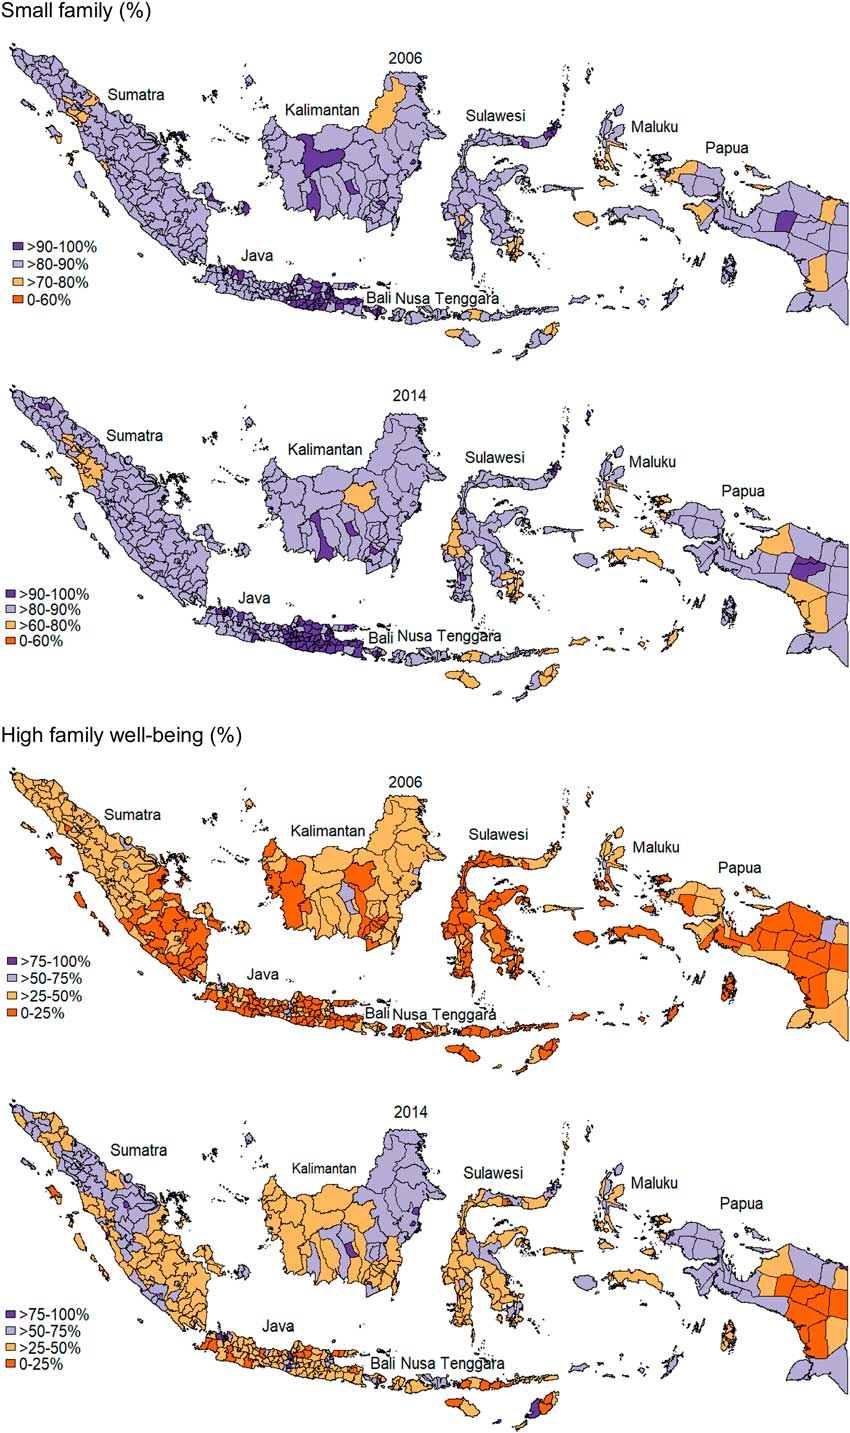
The percentage of small family and high family well-being at the most specific level of autonomous administrative area rather than across island groups was measured for the period 2006–2014 (Fig. 5). The upper panels of Fig. 5 show the percentage of small family in the districts of Indonesia in 2006 and 2014. The maps show that there was low fertility in most districts, with an average of 86% of women aged 15–49 years having 2 children or fewer in both years. Increasing family well-being appeared particularly in the districts of North Sumatra, Riau, Central and East Java, East Kalimantan, Central Sulawesi and West Papua provinces (see purple colour in lower panels of Fig. 5: high family well-being). However, disparities in family well-being increased over the study period, particularly in districts within the provinces of Sumatra, Papua, East Java and Papua.
Maps showing distribution of small family and family well-being, Indonesia 2006–2014.
The descriptive statistics showed that there was a strong association between small family and high family well-being, but the results’ bias with regard to household- and district-level characteristics may have affected this. To eliminate this bias, multilevel analyses were used to control for the association between small family and high family well-being using household- and district-level variables.
Multilevel analysis of small family and high family well-being
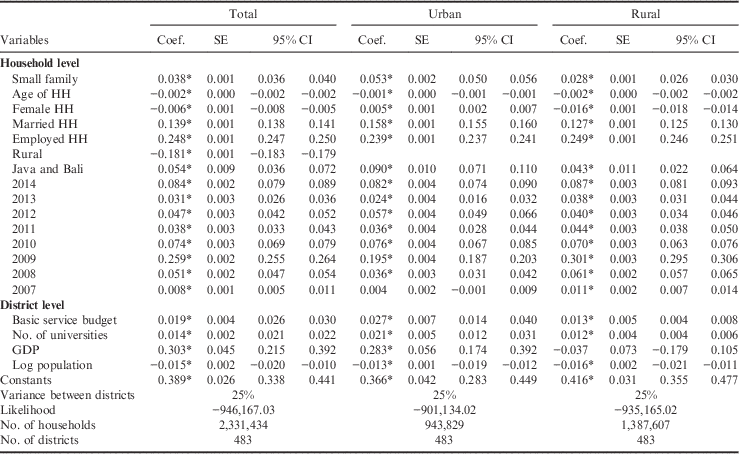
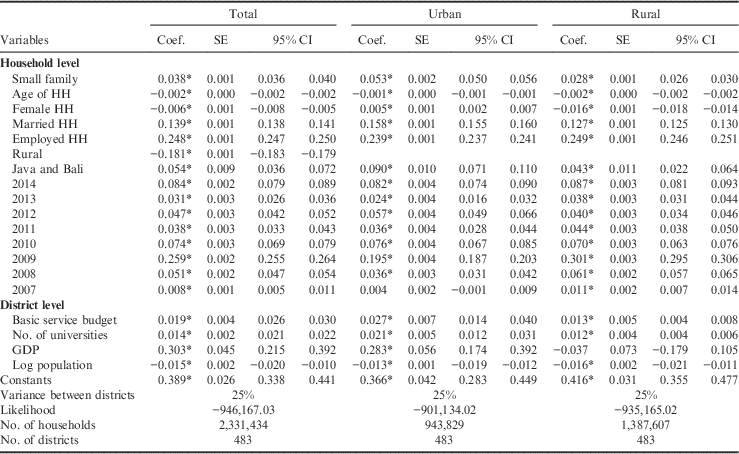
Table 2 presents the results of the multilevel analyses for the total, urban and rural samples. In all models, the association between small family and high family well-being was significant at p<0.05 for all household- and district-level characteristics related to family well-being. As expected, families with older household heads had lower levels of well-being than those with younger household heads. Likewise, families with female heads had lower levels of well-being than those with male heads. Families with married parents enjoyed higher levels of well-being than those with divorced and widowed parents. Across the models, a positive association was found between families with married parents and well-being. Families with employed household heads enjoyed higher levels of well-being than those with unemployed heads.
Multilevel analyses of small family and family well-being indicators for total, urban and rural samples
*p <0.01.
Families living in rural areas had lower levels of well-being than those living in urban areas. Families living on the islands of Java and Bali had higher levels of well-being than those living on other islands. Family well-being was demonstrated to improve over the period 2006 to 2014.
The association between district-level variables and high family well-being was found to be consistent, with the exception of the relationship between GDP and family well-being in the rural sample. Families living in districts that spent more of their budgets on basic public services had higher levels of well-being. Families living in districts with more university facilities were also likely to enjoy higher levels of well-being than those living in districts with fewer university facilities. Likewise, families living in richer districts were likely to have higher levels of well-being than those living in poorer districts. However, a significant association appeared only for the total and urban samples. As expected, greater overall district population had a negative association with well-being. The variances at district level were significant across all specifications. The estimation of these variances goes some way to ensuring that the remaining estimates (from low fertility to log population) were robust against unobserved district heterogeneities. This is worth bearing in mind when comparing these results with other results arrived at in the literature.
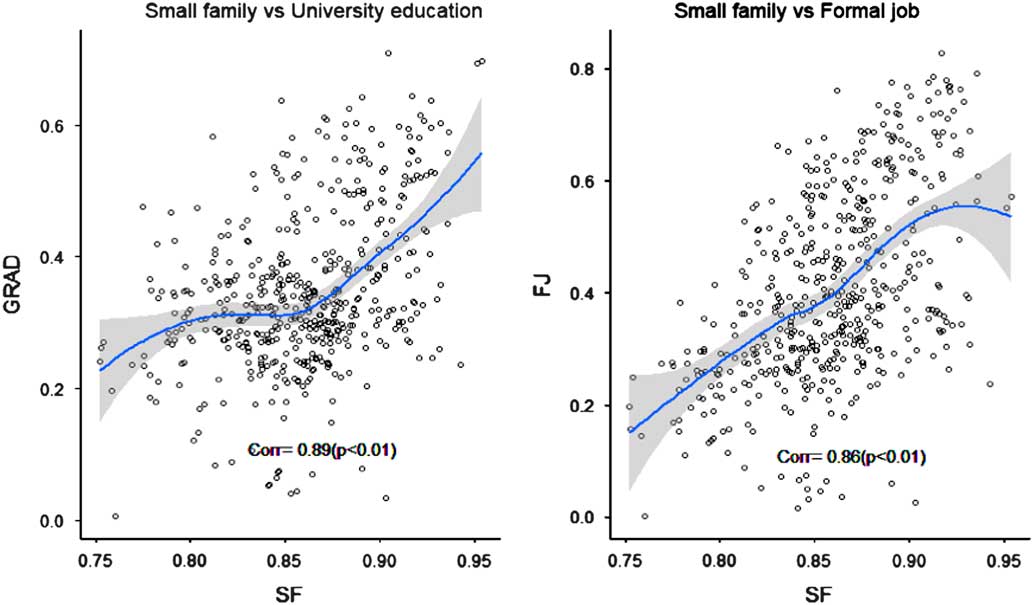
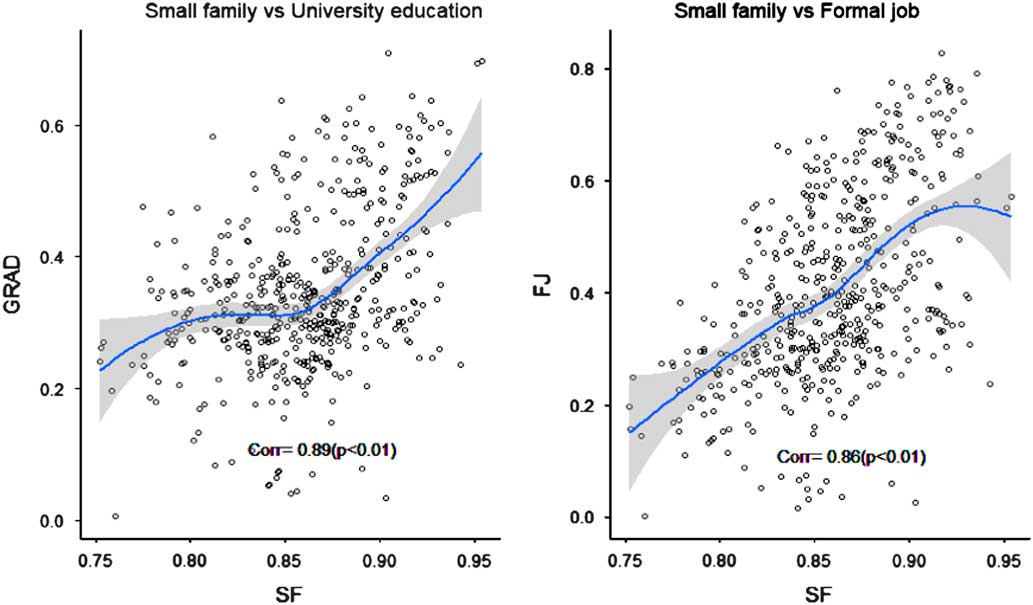
The link between small family and access to university education and formal jobs was also examined. First the association between the proportion in the low-fertility category and the proportion of family members who were educated at university level across all districts was plotted (Fig. 6, left panel). A strong association was found between district proportion of small family and family access to university education. A strong association was also found between small family and access to formal jobs (Fig. 6, right panel). It was found that districts with higher proportions of small families had better access to formal jobs than those with lower proportions of low fertility. However, this strong association may be biased, as other factors at the household and district levels may affect access to university education and formal employment. Therefore, multilevel analysis was performed including these as control variables. Table 3 presents the results of multilevel analysis of the relationships between small family, access to university and access to formal jobs. A strong association was found between small family and access to university education and formal jobs. Other household- and district-level variables also appeared to be significant. Children and parents living in families with older household heads were likely to have a greater opportunity to access university educations and formal jobs than those living in families with younger household heads. However, children and parents living in families with female heads were less likely to have access to university education and formal jobs. ‘Married’ families had better access to university education and formal jobs than ‘divorced’ or ‘widowed’ families. Families with an employed household head had better access to university education and formal jobs. However, families living in rural areas had less access to university education and formal jobs. People living in Java and Bali had better access to university and formal jobs than those living outside Java and Bali. Access to university education seemed to have increased from 2006 to 2014. In contrast, access to formal jobs appeared to have decreased over the same period. Families living in districts that spent more of their budgets on basic public services had better access to university education and formal jobs. Thus the presence of higher education facilities is important for families’ access to university education and formal jobs. Likewise, district GDP increased families’ access to university education and formal jobs, but the association was only significant for access to university education. Greater overall district population may decrease families’ access to formal jobs.
Scatter-plots of percentage of small families by university education and job status of household head. Sample was limited to the low-fertility category. SF=small family, GRAD=graduated from university, FJ=formal job.
Multilevel analysis of the relationship between small family, access to university education and formal jobs

*p<0.01.
Discussion
This study presents evidence of a steady low fertility rate and increasing level of family well-being in Indonesia over the last near-decade (2006–2014). A strong association between small family norm and high family well-being is also apparent over this period. The findings also provide evidence that improving access to university education and formal jobs may provide a channel by which small family increases family well-being. The data reveal a strong positive association between small family, access to university education and access to formal jobs. Throughout the period studied, families with higher educational levels and with formal jobs were likely to have higher levels of well-being than those with less formal education and those who had non-formal jobs. Access to university education appears to have increased for the small family category. All this confirms the benefits of small families on family well-being in Indonesia.
However, disparities in the benefits of a small family on family well-being were noted by geography and socioeconomic groups. A marked disparity in well-being was shown particularly between families living in urban and rural areas, as well as between families living on the six large islands. A huge gap in high family well-being was found to exist between the least developed islands (Nusa Tenggara and Papua) and the most developed islands (Java, Bali and Sumatra). Disparities in family well-being also appeared at the lowest autonomous administrative levels. A deepening disparity was shown in districts within the provinces of Sumatra, Papua, East Java and Papua. These findings echo those of Hill et al. (Reference Hill, Resosudarmo and Vidyattama2008) and Yusuf et al. (Reference Yount, Zureick-Brown, Halim and LaVilla2014), both of which showed a deepening economic inequality in the country over the last decade. While both studies showed a deepening disparity in economic welfare, the present study shows that a deepening disparity also exists in terms of family well-being.
The trend of deepening disparities in family well-being highlights the fact that spatial inequity remains a serious challenge for decentralized Indonesia. This study has presented evidence that the immense variations in family well-being across districts reflect heterogeneity in district governments’ capacities and resources to develop and implement policies for the improvement of families’ well-being and to quickly provide basic public services for the citizens. In all models, the percentage of district spending allotted to basic public services was found to be significantly associated with family well-being. These findings were consistent with those of Sujarwoto and Tampubolon (Reference Sujarwoto and Tampubolon2015), who showed that decentralization reform in Indonesia had increased citizen well-being through the improved capacity of district governments to deliver public services. Only competent district governments able to formulate sound development plans, allocate budgets efficiently and provide public services effectively can deliver the benefits of small family to its citizens, thus improving family well-being.
A large gap in well-being was also noted by socioeconomic group. Marked disparities in the well-being of families were found between those with female and male heads of household, older and younger heads of household, more- and less-educated heads of household and those with formal and non-formal jobs. In addition, the gaps between these social groups deepened over the study period. These results confirm the conclusions of a wide literature on economic development in developing countries, which has documented a gap in well-being based on gender, ageing population and human capital. Klasen and Waibel (2015), for example, demonstrated that having a female head of household has led to poverty and vulnerability in two South Asian countries. Likewise, Landes (Reference Landes2015) illustrated endemic poverty among older people in developing countries. As university education is expensive in many developing countries, disparities of human capital continue to deepen (Vogl, 2015).
The present study is not without its limitations. First, a considerable weakness is the cross-sectional nature of its data. The estimated coefficient should be viewed as a measure of association rather than of causation. Hence, the causal effect of small family norm on family well-being is something that future research, using available panel data on small family and family well-being as the most appropriate method, should seek to establish (Schultz, Reference Schultz2005). Second, the data used to calculate immunization were based purely on the verbal responses of parents who were not obliged to show an immunization card and whose answers regarding the completeness of their children’s immunizations may have been influenced by recall bias. Third, recall bias may also have influenced the low-fertility measure as the survey was also based on the verbal responses of parents (Radin et al., Reference Radin, Rothman, Hatch, Mikkelsen, Sorensen, Riis, Fox and Wise2015). Future data collection is therefore needed to improve the measurement of individual past experiences.
Despite these limitations, it was possible to present a number of implications for the fertility and well-being literature as well as for demographic policy in a developing country. First, the family well-being measure used in the study provides a useful complement to the measures of economic welfare generally used in Indonesia, such as poverty (Hanandita & Tampubolon, 2016). Using consumption expenditure data as the indicator of income also allows the results to be more sensitive to economic fluctuations than using asset ownership as a proxy for deprivation in living standards. The expenditure data that were used were also more reliable than income as a proxy of economic well-being. In developing countries such as Indonesia, it is not income but expenditure measured from consumption that more accurately captures levels of long-term economic resources (Deaton & Zaidi, Reference Deaton and Zaidi2002). Moreover, other indicators that have been used – basic childhood immunization and the completion of nine years of basic education – have also reached national development policy agendas, not only in Indonesia, but also in other developing countries (UNDP, Reference Tan and Soeradji2014).
Second, the multilevel analyses used in this study were able to examine how district government social policy in decentralized Indonesia may channel family well-being. Moreover, with these analyses it was possible to account simultaneously for the effect of household- and district-level factors on family well-being. Hence, the mechanisms by which low fertility affect well-being could be properly estimated by controlling for household- and district-level factors simultaneously (Birdsall & Sinding, Reference Birdsall and Sinding2001; Kelley, Reference Kelley2001). Using these analyses is thus the most appropriate method of testing hypotheses about the effects of varying district-level characteristics on family well-being in decentralized Indonesia.
Third, using national representative survey data from Indonesia, this study presented evidence supporting Malthusian theory. The finding of a strong association between small family norms and increased access to university education and formal jobs supports the literature in explaining that small family and low fertility can only increase family welfare and well-being if families invest more of their resources in improving the skills and knowledge of their family members; only then can they become productively employed and access better jobs (Kelley, Reference Kelley2001; Merrick, 2002).
From the point of view of policy, the findings suggest that improving human capital through improving access to higher education and providing better job opportunities should be the ultimate aim of national and district governments in decentralized Indonesia; it is in this way that the country can best realize the benefits of small family and low fertility and bridge well-being disparities. This is particularly important given the wide gap in higher education access found in the study, as well as the trend of decreasing access to formal jobs in recent years.