Introduction
22q11.2 deletion syndrome (22q11DS) is a neurogenetic condition characterized by a specific physical, cognitive and psychiatric phenotype. Most common physical abnormalities include cardiac defects and palatal abnormalities, while the cognitive phenotype is characterized by mental delay (IQ~70), visuo-spatial impairments and altered executive functions and social cognition (Swillen & McDonald-McGinn, Reference Swillen and McDonald-McGinn2015; Tang et al. Reference Tang, Antshel, Fremont and Kates2015; Bostelmann et al. Reference Bostelmann, Schneider, Padula, Maeder, Schaer and Scariati2016; Maeder et al. Reference Maeder, Schneider, Bostelmann, Debbané, Glaser and Menghetti2016). The psychiatric phenotype includes a high prevalence of attention-deficit hyperactivity disorders, anxiety disorders and schizophrenia spectrum disorders (Schneider et al. Reference Schneider, Debbané, Bassett, Chow, Fung and van den Bree2014a). In particular, 30–40% of patients with the syndrome will develop psychosis by adulthood (Schneider et al. Reference Schneider, Debbané, Bassett, Chow, Fung and van den Bree2014a) and the syndrome represents the third risk factor for the development of schizophrenia after having a monozygotic twin or both parents affected (McGuffin et al. Reference McGuffin, Owen and Farmer1995). Therefore, 22q11DS represents a valuable model for the research of neural biomarkers predicting the development of psychosis.
A number of studies have been conducted in order to identify risk factors for the conversion to psychosis in 22q11DS (Gothelf et al. Reference Gothelf, Schneider, Green, Debbané, Frisch and Glaser2013; Midbari Kufert et al. Reference Midbari Kufert, Nachmani, Nativ, Weizman and Gothelf2016; Schneider et al. Reference Schneider, Armando, Pontillo, Vicari, Debbané and Schultze-Lutter2016; Van et al. Reference Van, Butcher, Costain, Ogura, Chow and Bassett2016). The presence of anxiety disorders (Gothelf et al. Reference Gothelf, Schneider, Green, Debbané, Frisch and Glaser2013) and lower global functioning (Schneider et al. Reference Schneider, Armando, Pontillo, Vicari, Debbané and Schultze-Lutter2016) at baseline, a decline in verbal IQ (VIQ) (Gothelf et al. Reference Gothelf, Schneider, Green, Debbané, Frisch and Glaser2013; Vorstman et al. Reference Vorstman, Breetvelt, Duijff, Eliez, Schneider and Jalbrzikowski2015), preterm birth (Midbari Kufert et al. Reference Midbari Kufert, Nachmani, Nativ, Weizman and Gothelf2016; Van et al. Reference Van, Butcher, Costain, Ogura, Chow and Bassett2016) and the presence of an ultra-high-risk (UHR) condition (Schneider et al. Reference Schneider, Armando, Pontillo, Vicari, Debbané and Schultze-Lutter2016) have been showed to be predictive of psychosis conversion.
However, neuroimaging markers of psychosis are still lacking. Despite a significant number of studies investigated differences in brain morphology in patients with 22q11DS compared with healthy individuals (Gothelf et al. Reference Gothelf, Schaer and Eliez2008), investigations conducted within the 22q11DS population are still scarce. Such studies have indeed a number of advantages. First, as opposite to non-deleted patients with schizophrenia, which present a high genetic heterogeneity, patients with 22q11DS all share the same deletion, which confers a high risk to develop schizophrenia. Second, when comparing patients with 22q11DS to healthy controls, a number of factors can account for the differences observed between the groups, such as the cognitive impairments and the lower IQ. The studies conducted to date showed alterations in cortical thickness, volume and gyrification in association to more severe positive symptoms (Schaer et al. Reference Schaer, Debbané, Bach Cuadra, Ottet, Glaser and Thiran2009; Gothelf et al. Reference Gothelf, Hoeft, Ueno, Sugiura, Lee and Thompson2011; Kates et al. Reference Kates, Antshel, Faraone, Fremont, Higgins and Shprintzen2011; Jalbrzikowski et al. Reference Jalbrzikowski, Jonas, Senturk, Patel, Chow and Green2013; Schmitt et al. Reference Schmitt, Vandekar, Yi, Calkins, Ruparel and Roalf2015; Bakker et al. Reference Bakker, Caan, Vingerhoets, da Silva-Alves, de Koning and Boot2016), and reduced gyrification in association to higher negative symptoms (Mihailov et al. Reference Mihailov, Padula, Scariati, Schaer, Schneider and Eliez2017) in patients with 22q11DS. Furthermore, longitudinal investigations revealed altered developmental trajectories associated with higher positive symptoms severity in patients with the syndrome (Radoeva et al. Reference Radoeva, Bansal, Antshel, Fremont, Peterson and Kates2017; Ramanathan et al. Reference Ramanathan, Mattiaccio, Coman, Botti, Fremont and Faraone2017). The regions more frequently associated to a more severe symptomatology included frontal and temporal cortices (Schaer et al. Reference Schaer, Debbané, Bach Cuadra, Ottet, Glaser and Thiran2009; Gothelf et al. Reference Gothelf, Hoeft, Ueno, Sugiura, Lee and Thompson2011; Kates et al. Reference Kates, Antshel, Faraone, Fremont, Higgins and Shprintzen2011; Jalbrzikowski et al. Reference Jalbrzikowski, Jonas, Senturk, Patel, Chow and Green2013).
The majority of these studies classified patients based on arbitrary criteria, as for instance the definition of a cut-off in positive symptoms severity. However, more reliable UHR criteria have been developed during the past decades to capture the clinical high-risk state (Fusar-Poli et al. Reference Fusar-Poli, Borgwardt, Bechdolf, Addington, Riecher-Rössler and Schultze-Lutter2013). UHR criteria include attenuated psychotic symptoms (APS), brief limited intermittent psychotic episode (BLIP) and genetic risk and deterioration syndrome (Fusar-Poli et al. Reference Fusar-Poli, Borgwardt, Bechdolf, Addington, Riecher-Rössler and Schultze-Lutter2013; Armando et al. Reference Armando, Schneider, Pontillo, Vicari, Debbané and Schultze-Lutter2017, Table 1). It has been shown that 9.6% of non-syndromic patients at UHR convert to psychosis after 6 months, while the conversion rate after 4 years is 37% (Schultze-Lutter et al. Reference Schultze-Lutter, Michel, Schmidt, Schimmelmann, Maric and Salokangas2015). Similarly, 27% of patients with 22q11DS meeting the UHR criteria convert to psychosis after 2.7 years, while non-UHR patients show a significantly lower conversion rate (4.5%) (Schneider et al. Reference Schneider, Armando, Pontillo, Vicari, Debbané and Schultze-Lutter2016).
Demographic information

a Handedness was measured using the Edinburgh laterality quotient.
b IQ was measured using the Wechsler Intelligence Scale for Children (version III or IV) or the Wechsler Adult Intelligence Scale (version III or IV) (Wechsler, Reference Wechsler1991, Reference Wechsler1997, Reference Wechsler2004, Reference Wechsler2008).
c The information about psychiatry diagnosis was not available for one UHR subject.
P1, unusual thoughts/delusional ideas; P2, suspiciousness/persecutory ideas; P3, grandiosity, P4, perceptual abnormalities/hallucinations; P5, disorganized communication.
No studies to date investigated morphological alterations in patients with 22q11DS fulfilling the UHR criteria. The advantage of using this more specific diagnostic delineation, rather than considering the severity of positive symptoms only, is that it allows to define a more homogeneous group in which the risk of psychosis has been largely demonstrated and quantified. At the same time, as compared to the investigation of patients with a full-blown psychosis, the study of UHR populations has the advantage of being less affected by the confounds related to medication and it can give insights about alterations predicting the development of psychosis. Furthermore, we included in the study a naturalistic longitudinal sample of self-referred patients and families, rather than patients referred by a psychiatric service.
In this study, we investigated cortical volume, thickness, surface area and gyrification in patients with 22q11DS meeting the criteria for a UHR status. As control group, we included patients with the same deletion but not meeting the UHR criteria. We decided not to include a control group of healthy subjects in order to avoid the influence of confounding factors, such as the important cognitive delay characterizing patients with 22q11DS. In addition, several studies already compared brain morphology measures between patients with 22q11DS and healthy controls (for instance Schmitt et al. Reference Schmitt, Vandekar, Yi, Calkins, Ruparel and Roalf2015; Bakker et al. Reference Bakker, Caan, Vingerhoets, da Silva-Alves, de Koning and Boot2016; Radoeva et al. Reference Radoeva, Bansal, Antshel, Fremont, Peterson and Kates2017; Ramanathan et al. Reference Ramanathan, Mattiaccio, Coman, Botti, Fremont and Faraone2017) and showed differences between the two groups even in patients with low psychotic symptoms scores. Therefore, we argue that the comparison of patients with 22q11DS meeting or not the UHR criteria will allow us to better define the brain phenotype associated to a greater risk of psychosis in these patients.
In addition to testing differences in morphological brain measures, the development of cortical volume, thickness, surface area and gyrification was also tested using a mixed-model approach. Furthermore, in order to assess if alterations in brain morphology in UHR patients are associated to more severe clinical and cognitive outcomes 3 years later, we correlated the morphological measures with changes in IQ, global functioning and positive and negative symptoms severity. In addition to mass-univariate comparisons, multivariate statistical analyses were conducted to predict the UHR status starting from the structural imaging data. The UHR group being inherently heterogeneous, we indeed hypothesized that the use of a multivariate approach would be more sensitive in capturing subtle differences in UHR and non-UHR patients (Davatzikos, Reference Davatzikos2004). Indeed, it has been shown that multivariate analyses perform better than univariate statistics when mean differences between the groups cannot be detected (Arbabshirani et al. Reference Arbabshirani, Plis, Sui and Calhoun2017, Fig. 1).
Age distribution in UHR and non-UHR patients with 22q11DS. Thirteen UHR and eight non-UHR patients had at least one follow-up assessment. One UHR subject had two follow-ups, for a total of three time points, and one additional subject had three follow-ups, for a total of four time points.

Based on findings reporting alterations in cortical morphology in non-deleted UHR subjects compared with controls (for instance Fusar-Poli et al. Reference Fusar-Poli, Borgwardt, Crescini, Deste, Kempton and Lawrie2011; Mechelli et al. Reference Mechelli, Riecher-Rössler, Meisenzahl, Tognin, Wood and Borgwardt2011; Cropley et al. Reference Cropley, Lin, Nelson, Reniers, Yung and Bartholomeusz2016), we expected to observe reductions in cortical volume and thickness in frontal, parietal, temporal and limbic regions in UHR 22q11DS individuals. Furthermore, given the variability of cortical thickness with age and the findings about accelerated cortical thinning in non-syndromic at-risk individuals (Cannon, Reference Cannon2015), we expected to observe altered development of cortical thickness in UHR patients with 22q11DS.
Methods
Participants
Twenty-two patients with 22q11DS, aged 11.7–21.3 years, fulfilled the criteria for an UHR status (i.e. APS, BLIPS or genetic risk and functional decline, as defined in the Introduction section and in Table 1 of Armando et al. Reference Armando, Schneider, Pontillo, Vicari, Debbané and Schultze-Lutter2017) according to the Structured Interview for Prodromal Syndromes (SIPS) (Miller et al. Reference Miller, McGlashan, Rosen, Somjee, Markovich and Stein2002). One or more follow-up assessments at an interval of 3.7 ± 0.53 years were present for 13 UHR subjects (five females, age 14.3–28.3, Fig. 1). Two UHR subjects converted to psychosis (15%), four remained UHR (30%) and seven subjects remitted (55%) after the 3.7 ± 0.53 years interval. Among the subjects that remitted, four were considered resilient. Resilience was defined as remission and good functional outcome (de Wit et al. Reference de Wit, Wierenga, Oranje, Ziermans, Schothorst and van Engeland2016). Functional outcome was measured using Childhood Global Assessment Scale (CGAS; Shaffer et al. Reference Shaffer, Gould, Brasic, Ambrosini, Fisher and Bird1983) or the Global Assessment of Functioning (GAF), and a score ⩾65 was considered as an indicator of good functioning (Allen et al. Reference Allen, Chaddock, Egerton, Howes, Barker and Bonoldi2015; de Wit et al. Reference de Wit, Wierenga, Oranje, Ziermans, Schothorst and van Engeland2016).
As control group, 22 patients with 22q11DS not meeting the UHR criteria were individually matched for age and gender. Eight non-UHR individuals had a follow-up assessment after 3.8 ± 1.6 years (six females, age 15.6–25.3, Fig. 1). None of the non-UHR patients had converted to psychosis at follow-up.
Demographic information for the two groups of patients is reported in Table 1. There were no significant differences in age, gender or IQ between the two groups (p > 0.43).
The presence of psychiatric comorbidities was assessed using the Diagnostic Interview for Children and Adolescents Revised (DICA-R; Reich, Reference Reich2000), the psychosis supplement from the Kiddie-Schedule for Affective Disorders and Schizophrenia Present and Lifetime version (K-SADS-PL; Kaufman et al. Reference Kaufman, Birmaher, Brent, Rao, Flynn and Moreci1997) and the Structured Clinical Interview for DSM-IV Axis I Disorders (SCID-I; First et al. Reference First, Gibbon, Spitzer, Williams and Benjamin1996) for patients older than 18 years. Eighteen UHR and 13 non-UHR patients meet the criteria for a psychiatric diagnosis (p = 0.05). Eleven UHR and four non-UHR patients were medicated at the time of visit (p = 0.026, Table 1).
Written informed consent was received from the patients and their parents and our protocols were approved by the cantonal ethic commission of researches.
MRI acquisition and surface reconstruction
T1-weighted images were acquired using a Siemens Trio (N = 25, 16 UHR, nine non-UHR), a Siemens Prisma (N = 16, three UHR, 13 non-UHR) 3 Tesla MRI scanner, or a Philips 1.5 T Intera scanner (N = 3, three UHR, zero non-UHR) at the Center for Biomedical Imaging (CIBM) in Geneva. The sequences were acquired with a three-dimensional volumetric pulse. The parameters for the 3 T scanners are the following: TR = 2500 ms, TE = 3 ms, flip angle = 8°, acquisition matrix = 256 × 256, field of view = 23.5 cm, slice thickness = 3.2 mm, 192 slices. The 1.5 T scans were instead acquired with the following parameters: TR = 35 ms, TE = 6 ms, flip angle = 45°, NEX = 1, matrix size = 256 × 192, field of view = 24 cm2, slice thickness = 1.5 mm, 124 slices.
The structural scans were processed with the software FreeSurfer to reconstruct the internal and external cortical surfaces (Dale et al. Reference Dale, Fischl and Sereno1999). Cortical volume, thickness, surface area and gyrification were then computed (Fischl & Dale, Reference Fischl and Dale2000; Schaer et al. Reference Schaer, Cuadra, Tamarit, Lazeyras, Eliez and Thiran2008). More in details, cortical thickness was computed as the distance between the white and pial cortical surfaces. Gyrification was measured using the local gyrification index (lGI), which quantifies the proportion of cortex buried within sulci (Schaer et al. Reference Schaer, Cuadra, Tamarit, Lazeyras, Eliez and Thiran2008). These measures were compared vertex-wise and parcel-wise. For the parcel-wise analysis, average measures were extracted from 68 regions based on the Desikan parcellation (Desikan et al. Reference Desikan, Ségonne, Fischl, Quinn, Dickerson and Blacker2006).
Correlation analysis with outcome measures
In order to investigate if altered cortical morphology could predict more severe psychotic symptoms or cognitive and functional decline at follow-up, we conducted a post hoc correlation analysis between the morphological measures that significantly differed between UHR and non-UHR patients and the rate of change of: positive and negative symptoms (measured with the SIPS), full scale IQ (FSIQ) and VIQ, and global functioning (measured with the GAF). This analysis was conducted exclusively in the group of 13 UHR subjects for which a follow-up assessment was available.
Statistical analysis
Cross-sectional mass-univariate analysis
The vertex-wise mass-univariate comparison was performed using a general linear model in FreeSurfer. Thickness, volume and surface area were smoothed using a full width at a half maximum (FWHM) of 10 mm, while the lGI was smoothed at a FWHM of 5 mm. A Monte Carlo multiple comparisons correction was performed at a significance threshold of 0.05.
For the parcel-wise analysis, group comparisons were performed with analysis of variance in Matlab R2016b and false discovery rate was used to correct for multiple comparisons.
Cross-sectional multivariate analysis
The multivariate classification was performed using functions from the Pattern Recognition for Neuroimaging (PRONTO) toolbox. Support Vector Machine (SVM) classifier was used, including as features the values of cortical volume, thickness, surface area and gyrification extracted from the 68 parcels. The results of the classification were evaluated using three measures: sensitivity, specificity and accuracy. The sensitivity reflects the proportion of UHR patients correctly classified as such, while the specificity reflects the proportion of non-UHR patients correctly classified as such. The accuracy is the average of the previous two measures. Sensitivity, specificity and accuracy were estimated using a leave-one-subject-out cross-validation loop and the significance of the results was assessed by computing the accuracy confidence interval (CI) using the Wilson's score interval. The analysis was repeated with and without feature selection, performed through point biserial correlation.
Longitudinal mass-univariate analysis
The longitudinal analysis was performed using the average measures of cortical volume, thickness, surface area and gyrification extracted from the parcels. Given the structure of our data, characterized by subjects with 1–4 time points with variable time intervals between them and missing data, we adopted a mixed-model approach in order to achieve a higher statistical power. We used a method described in our previous publications (Mutlu et al. Reference Mutlu, Schneider, Debbané, Badoud, Eliez and Schaer2013; Schneider et al. Reference Schneider, Schaer, Mutlu, Menghetti, Glaser and Debbané2014b; Maeder et al. Reference Maeder, Schneider, Bostelmann, Debbané, Glaser and Menghetti2016), which models within-subject factors as random effects and population parameters (diagnosis and age) as fixed effects. The trajectories were estimated using a constant and a linear model. Then, the Bayesian information criterion (Schwarz, Reference Schwarz1978) was used to select the model that optimally fitted the data. Group differences in shape and intercept were finally evaluated using a log-likelihood approach.
Age, gender and type of scanner were used as covariates in all the analyses.
Results
Cross-sectional mass-univariate analysis
No significant results were obtained when comparing cortical volume between UHR and non-UHR patients with 22q11DS when performing the mass-univariate analysis, neither in the vertex-wise nor in the parcel-wise comparison (p > 0.62).
Cross-sectional multivariate analysis
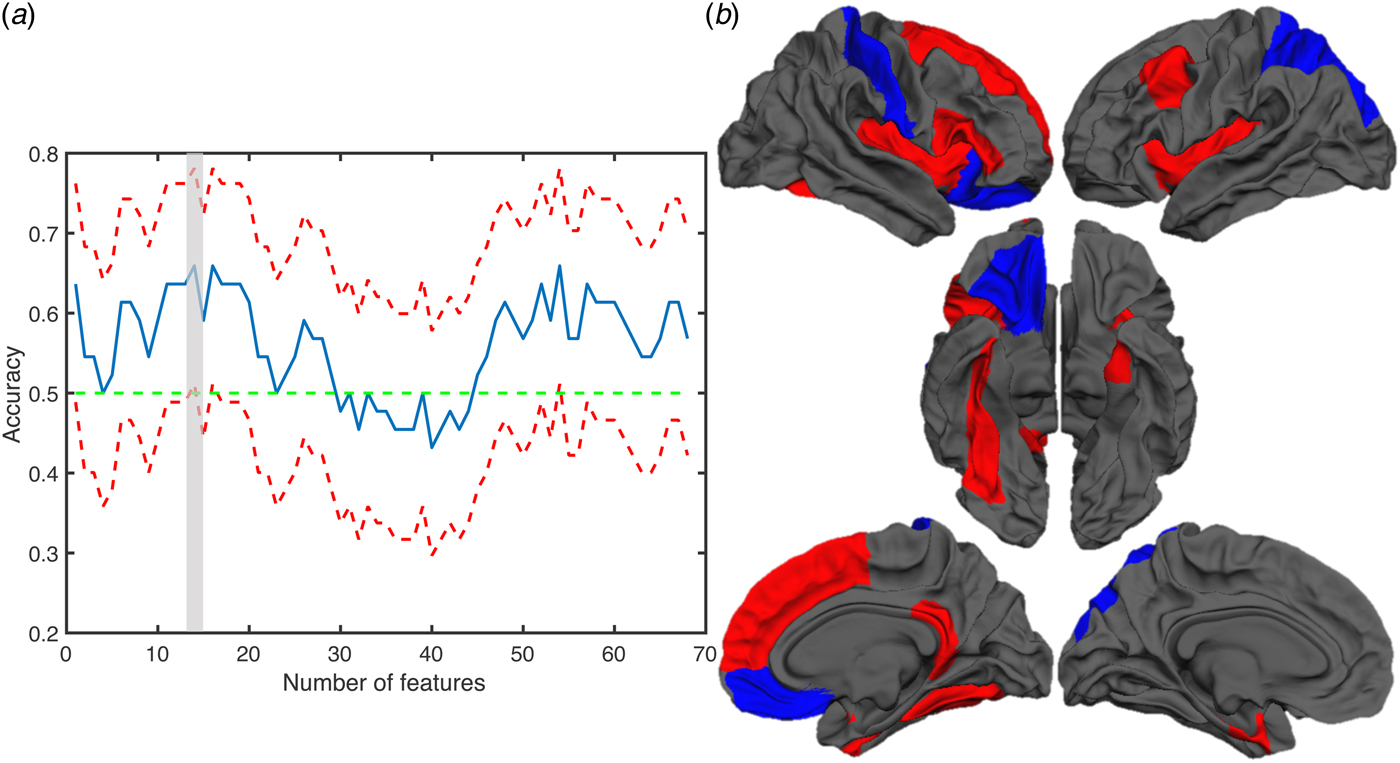
A significant discrimination of UHR and non-UHR patients was achieved when using multivariate classification with feature selection. In particular, altered cortical volume in 14 regions successfully discriminated UHR from non-UHR patients (accuracy = 66%, CI 51.1–78.1%, sensitivity = 63.6%, specificity = 68.2%; Fig. 2).
Results of the discrimination analysis with cortical volume. (a) Plot showing the accuracy for each number of features. The blue line indicates the accuracy while the red lines indicates the upper and lower confidence interval. (b) Brain maps showing the regions contributing to the classification of UHR and non-UHR patients. The blue and red colours indicate regions where cortical volume was reduced or increased in UHR patients, respectively.
No significant correlation was evident between average cortical volume in these regions and the rate of change of FSIQ, VIQ, GAF and positive and negative symptoms scores.
No significant discrimination was obtained with cortical thickness and gyrification.
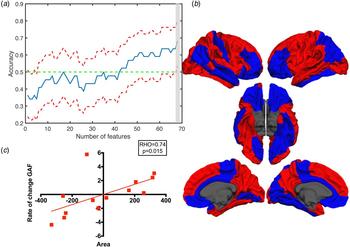
With the surface area, however, a significant classification was achieved with and without feature selection when including all the 68 brain regions (accuracy = 68.2%, CI 53.4–80%, sensitivity: 68.2%, specificity: 68.2%; Fig. 3). The correlation analysis between average surface area and the clinical and cognitive scores revealed a positive association between surface area at baseline and the rate of change in global functioning (Fig. 3c). Of note, the correlation between surface area and global functioning remained significant after covarying for the medication status (see supplementary material, figure S1).
Results of the discrimination analysis with surface area and association with changes in global functioning (GAF). (a) Plot showing the accuracy for each number of features. The blue line indicates the accuracy while the red lines indicates the upper and lower confidence interval. (b) Brain maps showing the regions contributing to the classification of UHR and non-UHR patients. The blue and red colours indicate regions where surface area was reduced or increased in UHR patients, respectively. (c) The plot shows the positive correlation between the surface area, averaged through the whole brain, and the rate of change of the GAF score.

Longitudinal mass-univariate analysis
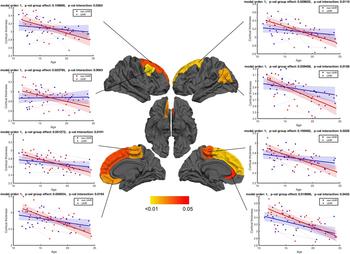
Significant different developmental trajectories were evident in UHR patients with 22q11DS, involving the bilateral superior frontal cortex, the right prefrontal cortex, and the left anterior cingulate cortices (ACC) and inferior parietal cortices (Fig. 4). In particular, UHR patients with 22q11DS showed higher thickness values before the age of 15 and increased cortical thinning during adolescence, which resulted in reduced cortical thickness by the age of 25 years.
Developmental trajectories in UHR and non-UHR patients. The brain maps show brain regions were significantly different cortical thinning was evident between UHR and non-UHR individuals. The more yellow the colour the more significant is the difference between the two groups. The plots indicate the developmental trajectories for each brain regions in UHR and non UHR patients.

Discussion
In this study, we compared measures of cortical volume, thickness, surface area and gyrification between UHR and non-UHR patients with 22q11DS.
In contrast to our hypothesis, the mass-univariate comparison did not reveal significant differences among patients with 22q11DS fulfilling or not the UHR diagnostic criteria. Studies conducted in non-syndromic UHR individuals showed reduced cortical volume (Fusar-Poli et al. Reference Fusar-Poli, Borgwardt, Crescini, Deste, Kempton and Lawrie2011; Mechelli et al. Reference Mechelli, Riecher-Rössler, Meisenzahl, Tognin, Wood and Borgwardt2011) in frontal, temporal and limbic regions, thus suggesting that the brain alterations characterizing UHR patients recapitulate the alterations observed in schizophrenia. However, other studies showed no differences in cortical volume or thickness in UHR individuals (Ziermans et al. Reference Ziermans, Durston, Sprong, Nederveen, van Haren and Schnack2009; Klauser et al. Reference Klauser, Zhou, Lim, Poh, Zheng and Tng2015). Therefore, even in the general population, it is not yet clear what are the brain alterations characterizing the UHR condition.
One factor that could explain these incongruences in the results is that patients at UHR are a heterogeneous group. For instance, 20–30% of them will convert to psychosis (Schultze-Lutter et al. Reference Schultze-Lutter, Michel, Schmidt, Schimmelmann, Maric and Salokangas2015), while 50% of them will remit (Addington et al. Reference Addington, Cornblatt, Cadenhead, Cannon, McGlashan and Perkins2011). Differences in cortical morphology have indeed been observed between converters and non-converters (Dazzan et al. Reference Dazzan, Soulsby, Mechelli, Wood, Velakoulis and Phillips2012; de Wit et al. Reference de Wit, Wierenga, Oranje, Ziermans, Schothorst and van Engeland2016). Therefore, including these subjects in the same group could have prevented ours and other studies from observing significant alterations. However, we partially reduced this heterogeneity by using a homogeneous cohort of patients with 22q11DS that share the same genetic deletion. The low sample size is another factor that may have prevented us from finding significant differences among UHR and non-UHR patients with 22q11DS. Future investigations should further disentangle the effects of sex and development. Indeed, in our recent investigation (Sannino et al. Reference Sannino, Padula, Managò, Schaer, Schneider and Armando2017), we found that differences between patients with 22q11DS having a different polymorphism in the catechol-o-methyltransferase (COMT) gene are associated to the sex and the developmental stage of the subjects.
When using a more sensitive multivariate approach, we were able to capture alterations in cortical volume and surface area in UHR patients with 22q11DS. This suggests that brain alterations characterizing UHR individuals with 22q11DS are subtle and cannot be detected with mass-univariate approaches. However, given our relatively low sample size and the cross-validation approach included in the analysis, we cannot conclude that our results are generalizable or that they have a clinical utility. Nevertheless, they provide an initial evidence for alterations in UHR patients with 22q11DS. In addition, our findings show that rather than localized in a specific brain region, alterations, especially in surface area, involve the entire brain. We further showed a predominant increase in cortical volume and surface area in patients with 22q11DS fulfilling UHR criteria. While initial investigations conducted in non-deleted UHR individuals mainly pointed to reduced grey matter, recent investigations reported contradictory results, suggesting the presence of higher grey matter volume in UHR individuals (Schaufelberger et al. Reference Schaufelberger, Lappin, Duran, Rosa, Uchida and Santos2011; de Wit et al. Reference de Wit, Wierenga, Oranje, Ziermans, Schothorst and van Engeland2016; Dukart et al. Reference Dukart, Smieskova, Harrisberger, Lenz, Schmidt and Walter2017; Palaniyappan et al. Reference Palaniyappan, Das and Dempster2017). For instance, Dukart et al. showed higher cortical thickness and grey matter volume in individuals with an ‘at-risk mental state’ and with first-episode psychosis. The investigation from de Wit et al. (Reference de Wit, Wierenga, Oranje, Ziermans, Schothorst and van Engeland2016) further showed that UHR individuals have a less steep decrease of surface area over development compared to controls. This observation suggests that altered maturation may result in larger surface area at the end of development in UHR patients with 22q11DS. Furthermore, the same authors showed that resilient UHR individuals have increased volume and surface area compared with non-resilient UHR and to controls, suggesting the presence of compensatory neural mechanisms that may prevent a worse outcome. This hypothesis was further supported by Palaniyappan et al. (Reference Palaniyappan, Das and Dempster2017). Therefore, we can speculate that our results could be driven by the resilient UHR individuals with 22q11DS. We found indeed a significant correlation between increased surface area and increased rate of change in global functioning. However, this assumption should be further tested after splitting the UHR group into the different sub-groups. In addition, while cortical thickness significantly decreases through adolescence, surface area is a relative stable measure (Raznahan et al. Reference Raznahan, Shaw, Lalonde, Stockman, Wallace and Greenstein2011). Therefore, our findings may suggest that the alterations in surface area characterizing UHR patients may represent an early biomarker predicting the increased risk of psychosis.
The cross-sectional comparison of cortical thickness (either with the univariate or the multivariate approach) in patients with 22q11DS with and without a UHR status did not reveal any significant difference. However, as mentioned above, cortical thickness undergoes a significant development during adolescence; therefore, these changes may have prevented us from observing differences in the cross-sectional analysis. Indeed, when using the mixed-model longitudinal approach, we found significant different developmental trajectories in UHR and non-UHR patients. In particular, UHR patients showed accelerated cortical thinning involving mainly frontal brain regions. These results are in line with the findings of Cannon (Reference Cannon2015) that showed similar altered trajectories in non-syndromic UHR individuals that convert to psychosis. Of note, despite showing an association between the UHR state and accelerated cortical thinning, our results do not allow to conclude that the accelerated thinning is a predictor for the development of psychosis, but it is rather a concomitant process (Palaniyappan, Reference Palaniyappan2017). Previous studies showed accelerated cortical thinning in patients with 22q11DS compared to controls (Schaer et al. Reference Schaer, Debbané, Bach Cuadra, Ottet, Glaser and Thiran2009; Ramanathan et al. Reference Ramanathan, Mattiaccio, Coman, Botti, Fremont and Faraone2017). Furthermore, accelerated thinning in frontal regions has been reported in patients with 22q11DS with higher positive symptoms (Ramanathan et al. Reference Ramanathan, Mattiaccio, Coman, Botti, Fremont and Faraone2017). However, our study is the first to explore cortical thickness trajectories in patients with a UHR status, thus providing insights into the alterations associated to an increased risk of developing psychosis.
The regions that showed altered developmental trajectories of cortical thickness in UHR patients with 22q11DS spanned through the frontal lobe, including the superior frontal, orbitofrontal, prefrontal cortices and ACC. Interestingly, these regions have shown quadratic developmental trajectories in the general population, with increased thickness in preadolescence and reduced thickness afterwards (Mutlu et al. Reference Mutlu, Schneider, Debbané, Badoud, Eliez and Schaer2013). While the presence of a quadratic trajectory could not be assessed in this study because of our low sample size, this observation suggests that the regions involved in higher psychosis risk are the ones that mature through adolescence and that are involved in higher order cognitive abilities, thus confirming the involvement of this developmental window in the psychosis progression.
Of note, we found that the ACC was among the regions showing accelerated cortical thinning in UHR patients. This finding gives a further evidence for the involvement of the ACC in the increased psychosis risk in 22q11DS, as confirmed by recent investigations using covariance of cortical thickness (Sandini et al. Reference Sandini, Scariati, Padula, Schneider, Schaer and Ville2017) and resting-state functional MRI (Debbané et al. Reference Debbané, Lazouret, Lagioia, Schneider, Van De Ville and Eliez2012; Scariati et al. Reference Scariati, Schaer, Richiardi, Schneider, Debbané and Van De Ville2014).
No differences in gyrification were evident between UHR and non-UHR patients. One hypothesis that could explain this lack of findings is that the reduced gyrification may be a characteristic of the 22q11DS population, not associated with a greater risk of psychosis. Indeed, numerous studies reported widespread differences in gyrification in patients with 22q11DS compared to controls (Schaer et al. Reference Schaer, Schmitt, Glaser, Lazeyras, Delavelle and Eliez2006, Reference Schaer, Cuadra, Tamarit, Lazeyras, Eliez and Thiran2008; Kunwar et al. Reference Kunwar, Ramanathan, Nelson, Antshel, Fremont and Higgins2012; Srivastava et al. Reference Srivastava, Buonocore and Simon2012; Schmitt et al. Reference Schmitt, Vandekar, Yi, Calkins, Ruparel and Roalf2015). The second hypothesis is that altered gyrification is associated to negative symptoms rather than positive symptoms. In our recent publication (Mihailov et al. Reference Mihailov, Padula, Scariati, Schaer, Schneider and Eliez2017), we indeed showed reduced gyrification in patients with 22q11DS with high negative symptoms, as compared to patients with low symptoms scores. However, this hypothesis needs to be further confirmed by investigations directly comparing gyrification between subgroups of patients expressing preferentially high positive or high negative symptoms.
This study comes with some limitations. First of all, despite having included a homogeneous longitudinal sample of patients sharing the same genetic deletion, our sample size remains low. Furthermore, we cannot exclude that confounding factors may have influenced our results. For instance, a recent study showed differences within a group of UHR patients presenting other psychiatric comorbidities (Modinos et al. Reference Modinos, Allen, Frascarelli, Tognin, Valmaggia and Xenaki2014). Eighty-three per cent of the patients with UHR included in this study met the criteria for one or more psychiatric comorbidities; however, these subgroups could not be differentiated because of the low sample size. In addition, while efforts have been made to reduce the effect of IQ in the results by using a control group of patients with 22q11DS not meeting the UHR criteria, our groups still differed in terms of psychiatric comorbidities and medication. This represents a limitation of the cohort being studied and we cannot completely exclude the effect of these confounding factors in our results.
To conclude, this study showed preliminary evidence for the presence of grey matter alterations in patients with 22q11DS meeting the criteria for a UHR status. In particular, our results suggest that accelerated cortical thinning in frontal brain regions may be associated to an increased risk to develop psychosis in patients with 22q11DS as in non-syndromic at-risk individuals.
Supplementary material
The supplementary material for this article can be found at https://doi.org/10.1017/S0033291717003920
Acknowledgements
The authors would like to thank the families that participated to the study for their availability as well as the MRI operators at Center of Biomedical Imaging (CIBM) and François Lazeyras for their help in the scanning acquisitions. The authors further thank Sarah Menghetti and Léa Chambaz for their involvement with the families and Frédérique Bena Sloan for the genetic analyses. This work was funded by the Swiss National Science Foundation (grant number FNS 324730_144260) and by National Center of Competence in Research (NCCR) Synapsy-The Synaptic Bases of Mental Diseases (grant number 51NF40-158776) to professor Stephan Eliez.
Declaration of Interest
The authors have no conflict of interest to declare.