

Highlights
-
• The vein of Trolard usually joins the superior sagittal sinus anterior to the marginal sulcus; but in a significant proportion of cases, this anastomosis is more anterior or posterior.
-
• Insertion location is significantly influenced by the presence of pathology.
-
• Preoperative assessment of the anastomosis is critical to prevent venous infarction.
Introduction
The venous anatomy of the human brain is a critical area of study in both neurosurgery and neuroradiology, given its implications for surgical planning, diagnostic imaging and understanding cerebral pathophysiology. Among the superficial cerebral veins, the vein of Trolard (VoT) (also termed the superior superficial anastomotic vein) stands out due to its significant role in connecting the superficial middle cerebral vein (Sylvian vein) to the superior sagittal sinus (SSS), a major midline venous sinus that drains blood from the cerebral hemispheres into the systemic circulation. Reference Rhoton1 This vein, first described by French anatomist Jean-Baptiste Paulin Trolard in the 19th century, exhibits considerable variability in its course and point of confluence with the SSS, a characteristic that complicates its identification and preservation during neurosurgical procedures. Reference vi Mortazavi, Denning, Yalcin, Shoja, Loukas and Tubbs2 One of the key questions surrounding its anatomy is its positional relationship to the central sulcus – the prominent groove separating the frontal lobe’s motor cortex from the parietal lobe’s sensory cortex. Understanding whether the VoT most frequently joins the SSS anterior to, posterior to, or at the level of the central sulcus has practical implications for anticipating its location in preoperative imaging and intraoperative navigation. This paper aims to address this question through a radiologic study, building on existing anatomical and neurosurgical literature to estimate the proportional distribution of its confluence points and to explore its visualization using modern imaging techniques.
The SSS, running along the midline of the cranial vault from the crista galli to the confluence of sinuses, serves as a critical landmark in cerebral venous drainage. Reference Standring3 The VoT, as one of the largest superior superficial anastomotic veins, typically courses from the Sylvian fissure upward across the lateral convexity of the hemisphere to join the SSS. Its path is not fixed, however, and its variability has been well-documented in anatomical and microneurosurgical studies. Rhoton describes the VoT as most commonly traversing the precentral, central, or postcentral regions, suggesting a broad distribution across the frontoparietal convexity. This variability is echoed across medical literature, stating the vein is “most often located in the postcentral region” and “its relation to the underlying cortex is variable.” Reference Oka, Rhoton, Barry and Rodriguez4,Reference Ozkal, Candan, Top and Yasın5 Such descriptions highlight the need for a more precise understanding of its confluence with the SSS relative to the central sulcus, a landmark readily identifiable on imaging and in surgery. Cadaveric and imaging studies provide some quantitative insight into this anatomical relationship, though they rarely offer explicit statistical proportions. An early paper by Oka and Rhoton studied the distribution of cortical draining and anastomotic veins. Reference Brannigan, McClanahan, Hui, Fargen, Pinter and Oxley6 Other groups have also looked at the anatomic variations noting greater positional variability compared to the vein of Labbé, with a tendency toward the parietal (posterior) region, though exact anterior–posterior proportions were not specified. The VoT additionally demonstrates considerable variation in its dominance relative to other major superior superficial anastomotic veins, particularly at the level of the postcentral vein and postcentral sulcus, with notable differences observed between hemispheres. Reference Shapiro, Chung, Sharashidze, Nossek, Nelson and Raz7–Reference Tanriverdi, Al-Jehani, Poulin and Olivier9 However, there is a paucity of studies into the exact location of the anastomosis and a review of the literature only yielded one such study.
The clinical significance of the VoT position cannot be overstated. Its proximity to the central sulcus places it near critical functional areas, including the primary motor and sensory cortices, making its preservation essential during procedures such as tumor resection or arteriovenous malformation repair. Reference Rhoton1 Damage to this vein can lead to venous infarction or postoperative edema, particularly if it represents a dominant drainage pathway. Radiologic identification of its confluence with the SSS, therefore, enhances preoperative planning, allowing surgeons to anticipate its course and tailor their approach accordingly. Magnetic resonance venography, CT venography and digital subtraction angiography have become indispensable tools for visualizing cerebral veins, yet VoT variability poses challenges to consistent detection and classification. A radiologic study focused on its confluence with the SSS relative to the central sulcus could refine these imaging techniques and provide a more standardized framework for its anatomical description. Synthesizing the available literature, an estimate of the VoT positional distribution, can be proposed, though precise percentages remain elusive without large-scale statistical data. The frequent association with the post-central sulcus, as noted by Ozkal and supported by Tomasi et al., suggests that approximately 60%–70% of VoT instances meet the SSS posterior to the central sulcus. Reference Oka, Rhoton, Barry and Rodriguez4,Reference Tomasi, Umana and Scalia10 The precentral occurrences described by Rhoton and the variability in Ikushima indicate that 20%–30% may lie anterior to the central sulcus, while the 28.6% confluence rate at the central sulcus suggests that 10%–20% align directly with this landmark. Reference Rhoton1,Reference Shapiro, Chung, Sharashidze, Nossek, Nelson and Raz7 These estimates are necessarily approximate, reflecting the emphasis on variability rather than fixed proportions in the literature. Factors such as population differences, sample size and measurement techniques likely contribute to this range, underscoring the need for further investigation.
This study seeks to address these gaps through a radiologic approach, utilizing MR imaging to map the VoT confluence with the SSS in a diverse cohort of patients. By correlating its position with the marginal sulcus, identified via structural MRI landmarks, we aim to provide a more definitive proportional distribution and assess the reliability of modern imaging modalities in detecting this vein (Figure 1). Such data could enhance neurosurgical precision, inform radiologic interpretation and contribute to the broader understanding of cerebral venous anatomy. The variability of the VoT, while a challenge, also presents an opportunity to refine our knowledge of its anatomy through systematic radiologic analysis, building on the foundational work of prior anatomical studies.
Representative examples of anterior and posterior vein of Trolard (VoT) displacement relative to the marginal sulcus. Gadolinium-enhanced T1-weighted MRI images illustrating variability in the insertion point of the vein of Trolard into the superior sagittal sinus. The dashed blue line outlines the marginal sulcus, while the red arrows indicate the point of VoT insertion. (A) Example of an anterior VoT insertion relative to the marginal sulcus. Sagittal and axial views demonstrate the anterior position of the vein with respect to the sulcal landmark. (B) Example of a posterior VoT insertion relative to the marginal sulcus. Sagittal and axial views illustrate a posterior venous entry point relative to the marginal sulcus.

Figure 1. Long description
Two-panel figure showing axial MRI scans of the brain demonstrating the measurement method used to locate the vein of Trolard insertion into the superior sagittal sinus. Both panels show contrast-enhanced axial MRI slices at the level of the cerebral vertex. Panel A shows a measurement line extending from the marginal sulcus anteriorly along the superior sagittal sinus to the point where the vein of Trolard enters the sinus on the left side. Panel B shows the same measurement technique on a different patient, with the measurement line indicating the distance from the marginal sulcus to the vein of Trolard entry point posteriorly. In both panels, the superior sagittal sinus appears as a bright enhancing midline structure, and the vein of Trolard is visible as a prominent cortical vein draining into it from the lateral convexity.
Methods
This study was conducted in accordance with institutional ethics approval. A single-center, retrospective analysis was performed on the most recent 400 consecutive patients admitted to the Neurosurgery Service. Both surgical and nonsurgical patients were included.
All available imaging was reviewed independently by two interpreters. In cases of disagreement above 25 mm between the assessors, consensus was achieved through review by the senior author. Ultimately, the interrater reliability was assessed by determining their correlation. A 3D T1-weighted MPRAGE (Magnetization Prepared Rapid Gradient Echo) sequence with intravenous gadolinium contrast was used in axial and sagittal planes to identify the entry point of the VoT at its anastomosis with the SSS. No dedicated MR venography or CT venography was performed as part of this study protocol.
The VoT was determined as the largest vein with the greatest intensity seen on both sagittal and axial imaging. In cases where two or more large superficial veins were present without a singularly dominant channel, the caliber of each vein was measured on axial and sagittal imaging. The subsequent vein with the largest caliber was designated as the VoT for measurement purposes.
The primary outcome measured was the distribution of entry sites of the VoT, using the marginal sulcus as the anatomical reference point. The effect of age, gender and pathology close to the sinus were also assessed on these distributions.
Statistical analyses were performed using the Kolmogorov–Smirnov test to compare the distributions of left and right entry locations across three groups: the full cohort, patients without pathology and patients with pathology involving the SSS. Data with a p-value less than 0.05 were accepted as statistically significant.
Results
A total of 400 consecutive patients admitted to the neurosurgery service were reviewed. Ten patients were excluded due to inadequate contrast-enhanced imaging that did not adequately visualize the vertex, leaving 390 patients for analysis. Our cohort contained 213 females and 177 males. Our median age was 58 years old (ranging from 20 to 90). 26 out of 390 patients (6.7%) were cases which required formal adjudication due to an initial >25 mm disagreement between reviewers. (Table 1).
Patient demographics. 400 consecutive patients presenting to neurosurgery were screened. Of these, 390 had appropriate imaging and were included in this radiologic study

Table 1. Long description
Table with two columns labeled “Group” and “Sample Size (n).” The full cohort consisted of 390 patients. By sex, 177 were male and 213 were female. The median age was 58 years, with a mean age of 55.5 for males and 58.2 for females. Sagittal pathology was present in 73 patients and absent in 317. Among those with sagittal pathology, 26 had left-sided pathology, 28 had right-sided pathology, and 19 had bilateral pathology.
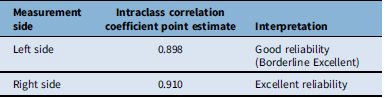
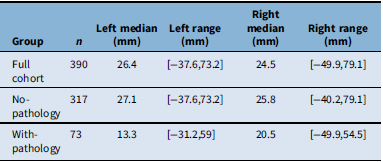
Insertion points of the VoT into the SSS were assessed relative to the marginal sulcus, with positive values indicating insertion anterior to the sulcus and negative values indicating posterior insertion. Across the full dataset, the median insertion point was located 26.4 mm anterior to the marginal sulcus on the left side and 24.5 mm anterior on the right. Distances ranged from 37.6 mm posterior to 73.6 mm anterior to the marginal sulcus on the left and from 49.9 mm posterior to 79.1 mm anterior on the right. As shown in Table 2, inter-rater reliability was excellent, with intraclass correlation coefficients (ICC) of 0.910 for right-sided and 0.898 for left-sided measurements.
Statistical analysis of inter-rater reliability: intraclass correlation coefficient using the two-way random effects model for absolute agreement, indicates excellent reliability for both the left and right sides

Table 2. Long description
Table with three columns labeled “Measurement Side,” “ICC Point Estimate,” and “Interpretation.” The left side had an ICC of 0.898, interpreted as good reliability at the borderline of excellent. The right side had an ICC of 0.910, interpreted as excellent reliability.
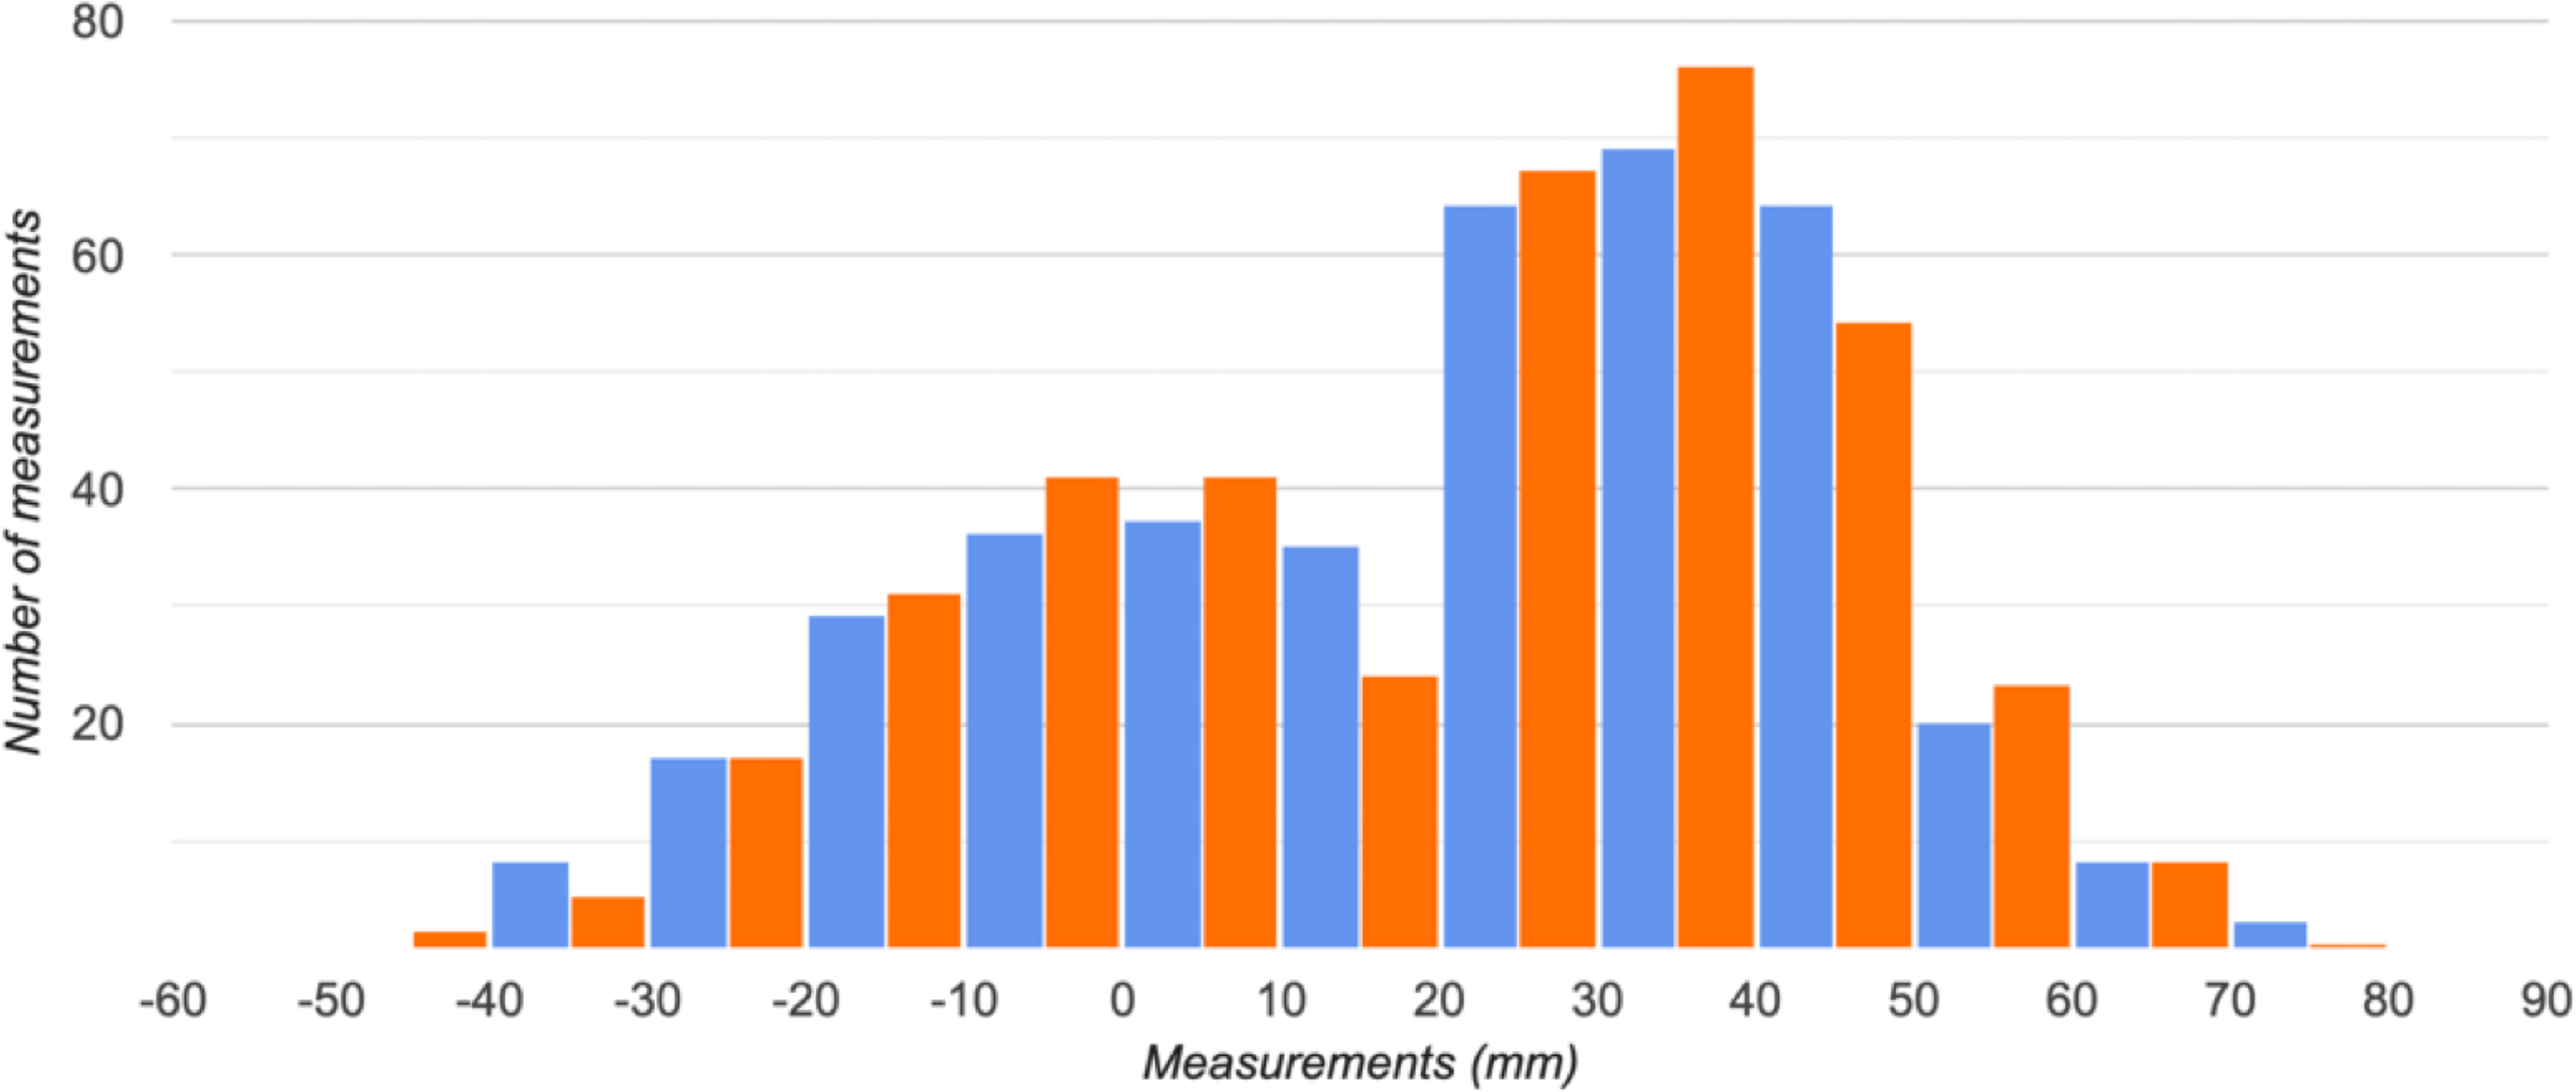
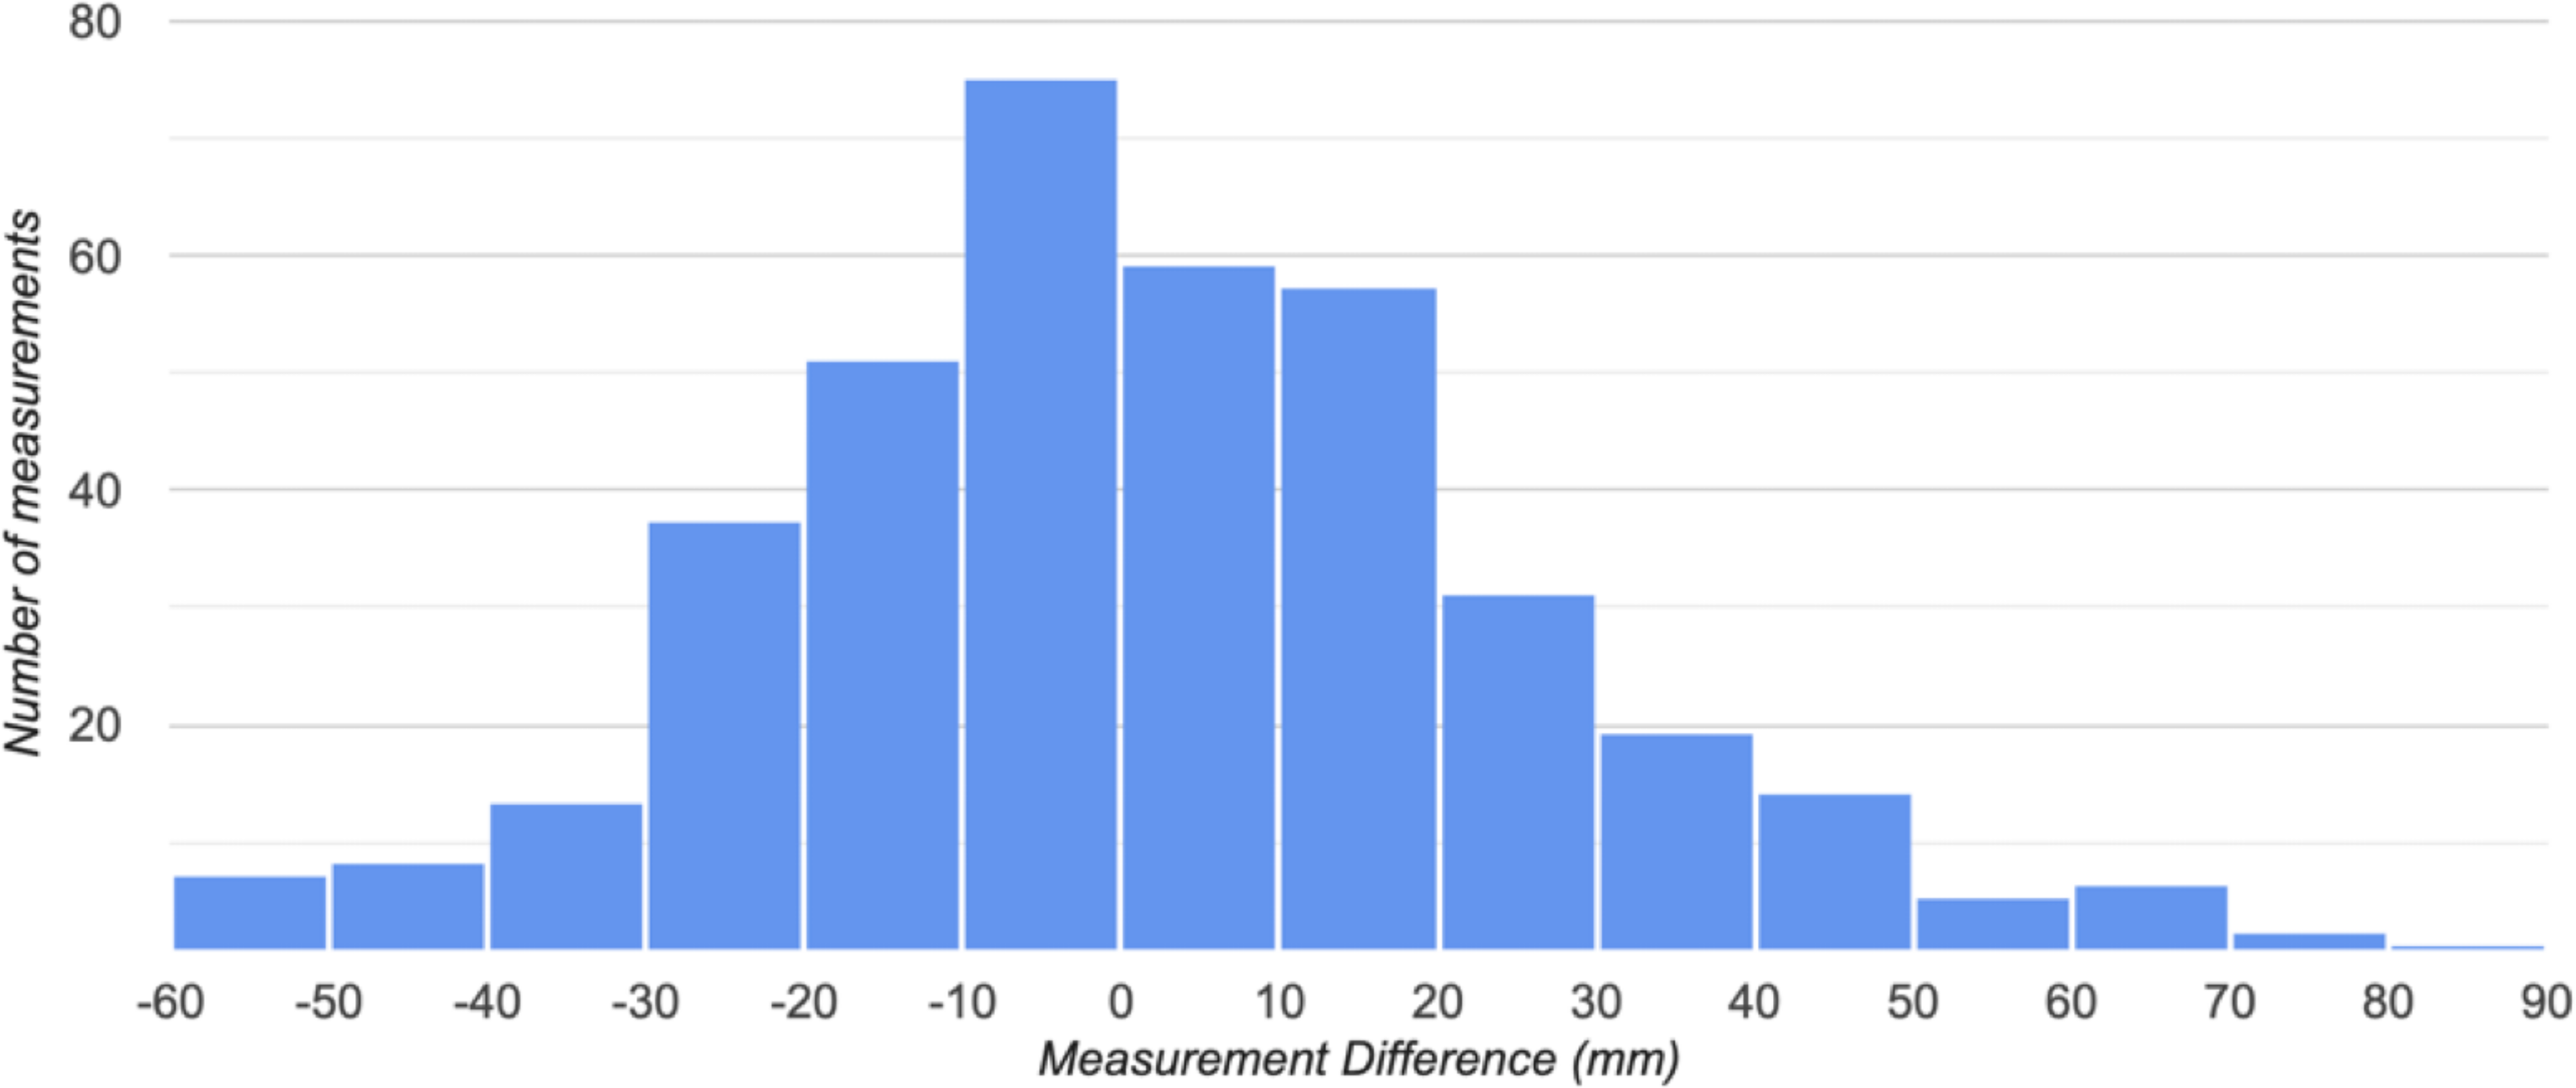
As shown in Figure 2, the point of insertion did not follow a normal distribution on either hemisphere. Instead, a bimodal pattern was observed bilaterally, with one peak occurring near zero (at or close to the marginal sulcus) and a second, larger peak representing insertions anterior to the marginal sulcus. A subset of insertions posterior to the sulcus was also identified on both sides. The insertions of the VoT are not always symmetric in the same patient. However, when the difference between the left- and right-sided insertion for each patient is presented as a histogram (Figure 3), 62% are less than 20 mm apart.
Distribution of insertion of the vein of Trolard to superior sagittal sinus. The left hemisphere (blue) and right hemisphere (orange) appear to have similar distributions.

Figure 2. Long description
Grouped bar chart titled “Frequency Distribution of Measurements.” The x-axis shows measurements in millimetres, ranging from negative 60 to 90. The y-axis shows the number of measurements, ranging from 0 to 80. Blue bars represent the left side and orange bars represent the right side. The bars are paired at each interval. The distribution shows two peaks: one near 0 mm and a larger peak between 10 and 30 mm, where bar heights reach approximately 70 to 80 counts. Below negative 40 mm and above 70 mm, counts drop below 10. The left and right side distributions closely overlap throughout the range. A legend in the upper right labels blue as “Left side (count)” and orange as “Right side (count).“
The frequency distribution of measurements between left- and right-side insertion of the vein of Trolard to superior sagittal sinus was compared for individual patients. The distance between these insertions is a normal distribution centered around 0.

Figure 3. Long description
Histogram with blue bars. The x-axis is labeled “Measurement Difference (mm)” and ranges from negative 60 to 90. The y-axis is labeled “Number of measurements” and ranges from 0 to 80. The distribution is approximately bell-shaped and centered near 0 mm. The tallest bar is at the 0 mm bin, reaching approximately 75 measurements. Adjacent bins at negative 10 and 10 mm each contain approximately 50 to 60 measurements. The counts taper symmetrically on both sides, dropping below 10 beyond negative 50 mm and beyond 50 mm. A small number of outliers extend to approximately 80 mm on the positive side.
When analysis was restricted to patients without pathology involving the SSS, results were consistent with the overall cohort. The median VoT insertion was 27.1 mm anterior to the marginal sulcus on the left and 25.8 mm anterior on the right. Negative values were again observed, reflecting occasional posterior insertions. Inter-rater reliability remained high (R = 0.920 right; R = 0.918 left), slightly exceeding that of the full dataset, although the difference was not statistically significant (Table 3).
Comparison of patients with and without sagittal pathology. Among patients with SSS pathology, the median insertion distances were reduced compared to both the overall and no-pathology cohorts, measuring 13.3 mm anterior to the marginal sulcus on the left and 20.5 mm on the right

Table 3. Long description
Table with six columns labeled “Group,” “n,” “Left Median (mm),” “Left Range (mm),” “Right Median (mm),” and “Right Range (mm).” Three rows of data are shown. The full cohort of 390 patients had a left median of 26.4 mm with a range of negative 37.6 to 73.2 mm, and a right median of 24.5 mm with a range of negative 49.9 to 79.1 mm. The no-pathology group of 317 patients had a left median of 27.1 mm with a range of negative 37.6 to 73.2 mm, and a right median of 25.8 mm with a range of negative 40.2 to 79.1 mm. The with-pathology group of 73 patients had a left median of 13.3 mm with a range of negative 31.2 to 59 mm, and a right median of 20.5 mm with a range of negative 49.9 to 54.5 mm.
In contrast, among patients with SSS pathology, the median insertion distances were reduced compared to both the overall and no-pathology cohorts, measuring 13.3 mm anterior to the marginal sulcus on the left and 20.5 mm on the right.
Inter-rater reliability, while still high, was modestly lower than in the other groups (R = 0.899 right; R = 0.895 left). The Kolmogorov–Smirnov test indicated a significant difference between the with and without pathology groups on the left side (D(73,317) = 0.21, p = .00892) (Figure 4A, and 4B). Of the 73 patients with sagittal pathology, the majority were meningiomas (n = 51; 27 parafalcine, 9 parasagittal, 13 convexity, 2 other), followed by gliomas (n = 15), hemorrhage or vascular lesions (n = 4) and metastases (n = 3). As such, the without pathology group’s cumulative distribution function was considered to be not equal to that of the with pathology group.
Frequency distribution of measurements comparing patients with and without sagittal pathology. (A) Left-side distribution. The Kolmogorov–Smirnov test indicated a significant difference between the groups with and without pathology (D(73,317) = 0.21, p = 0.00892). (B) Right-side distribution. Results of the Kolmogorov–Smirnov test indicated a significant difference between the two distributions (D(317,73) = 0.19, p = 0.0265). In both panels, blue bars represent the cohort without pathology, and orange bars represent the cohort with pathology.

Figure 4. Long description
Two-panel figure showing grouped bar charts comparing the frequency distribution of vein of Trolard insertion measurements between patients with and without sagittal pathology. Panel A shows the left hemisphere. Panel B shows the right hemisphere. In both panels, the x-axis is labeled “Measurements (mm)” ranging from negative 50 to 90, and the y-axis is labeled “Number of measurements” ranging from 0 to 80. Blue bars represent patients without pathology and orange bars represent patients with pathology. In both panels, the without-pathology group shows higher counts concentrated between 20 and 40 mm anterior to the marginal sulcus, with the tallest bars reaching approximately n=55 in Panel A and n=63 in Panel B. The pathology group shows lower, more evenly spread counts across the range, with bars generally below 15. Both groups show a tail of posterior insertions extending to approximately negative 40 mm.
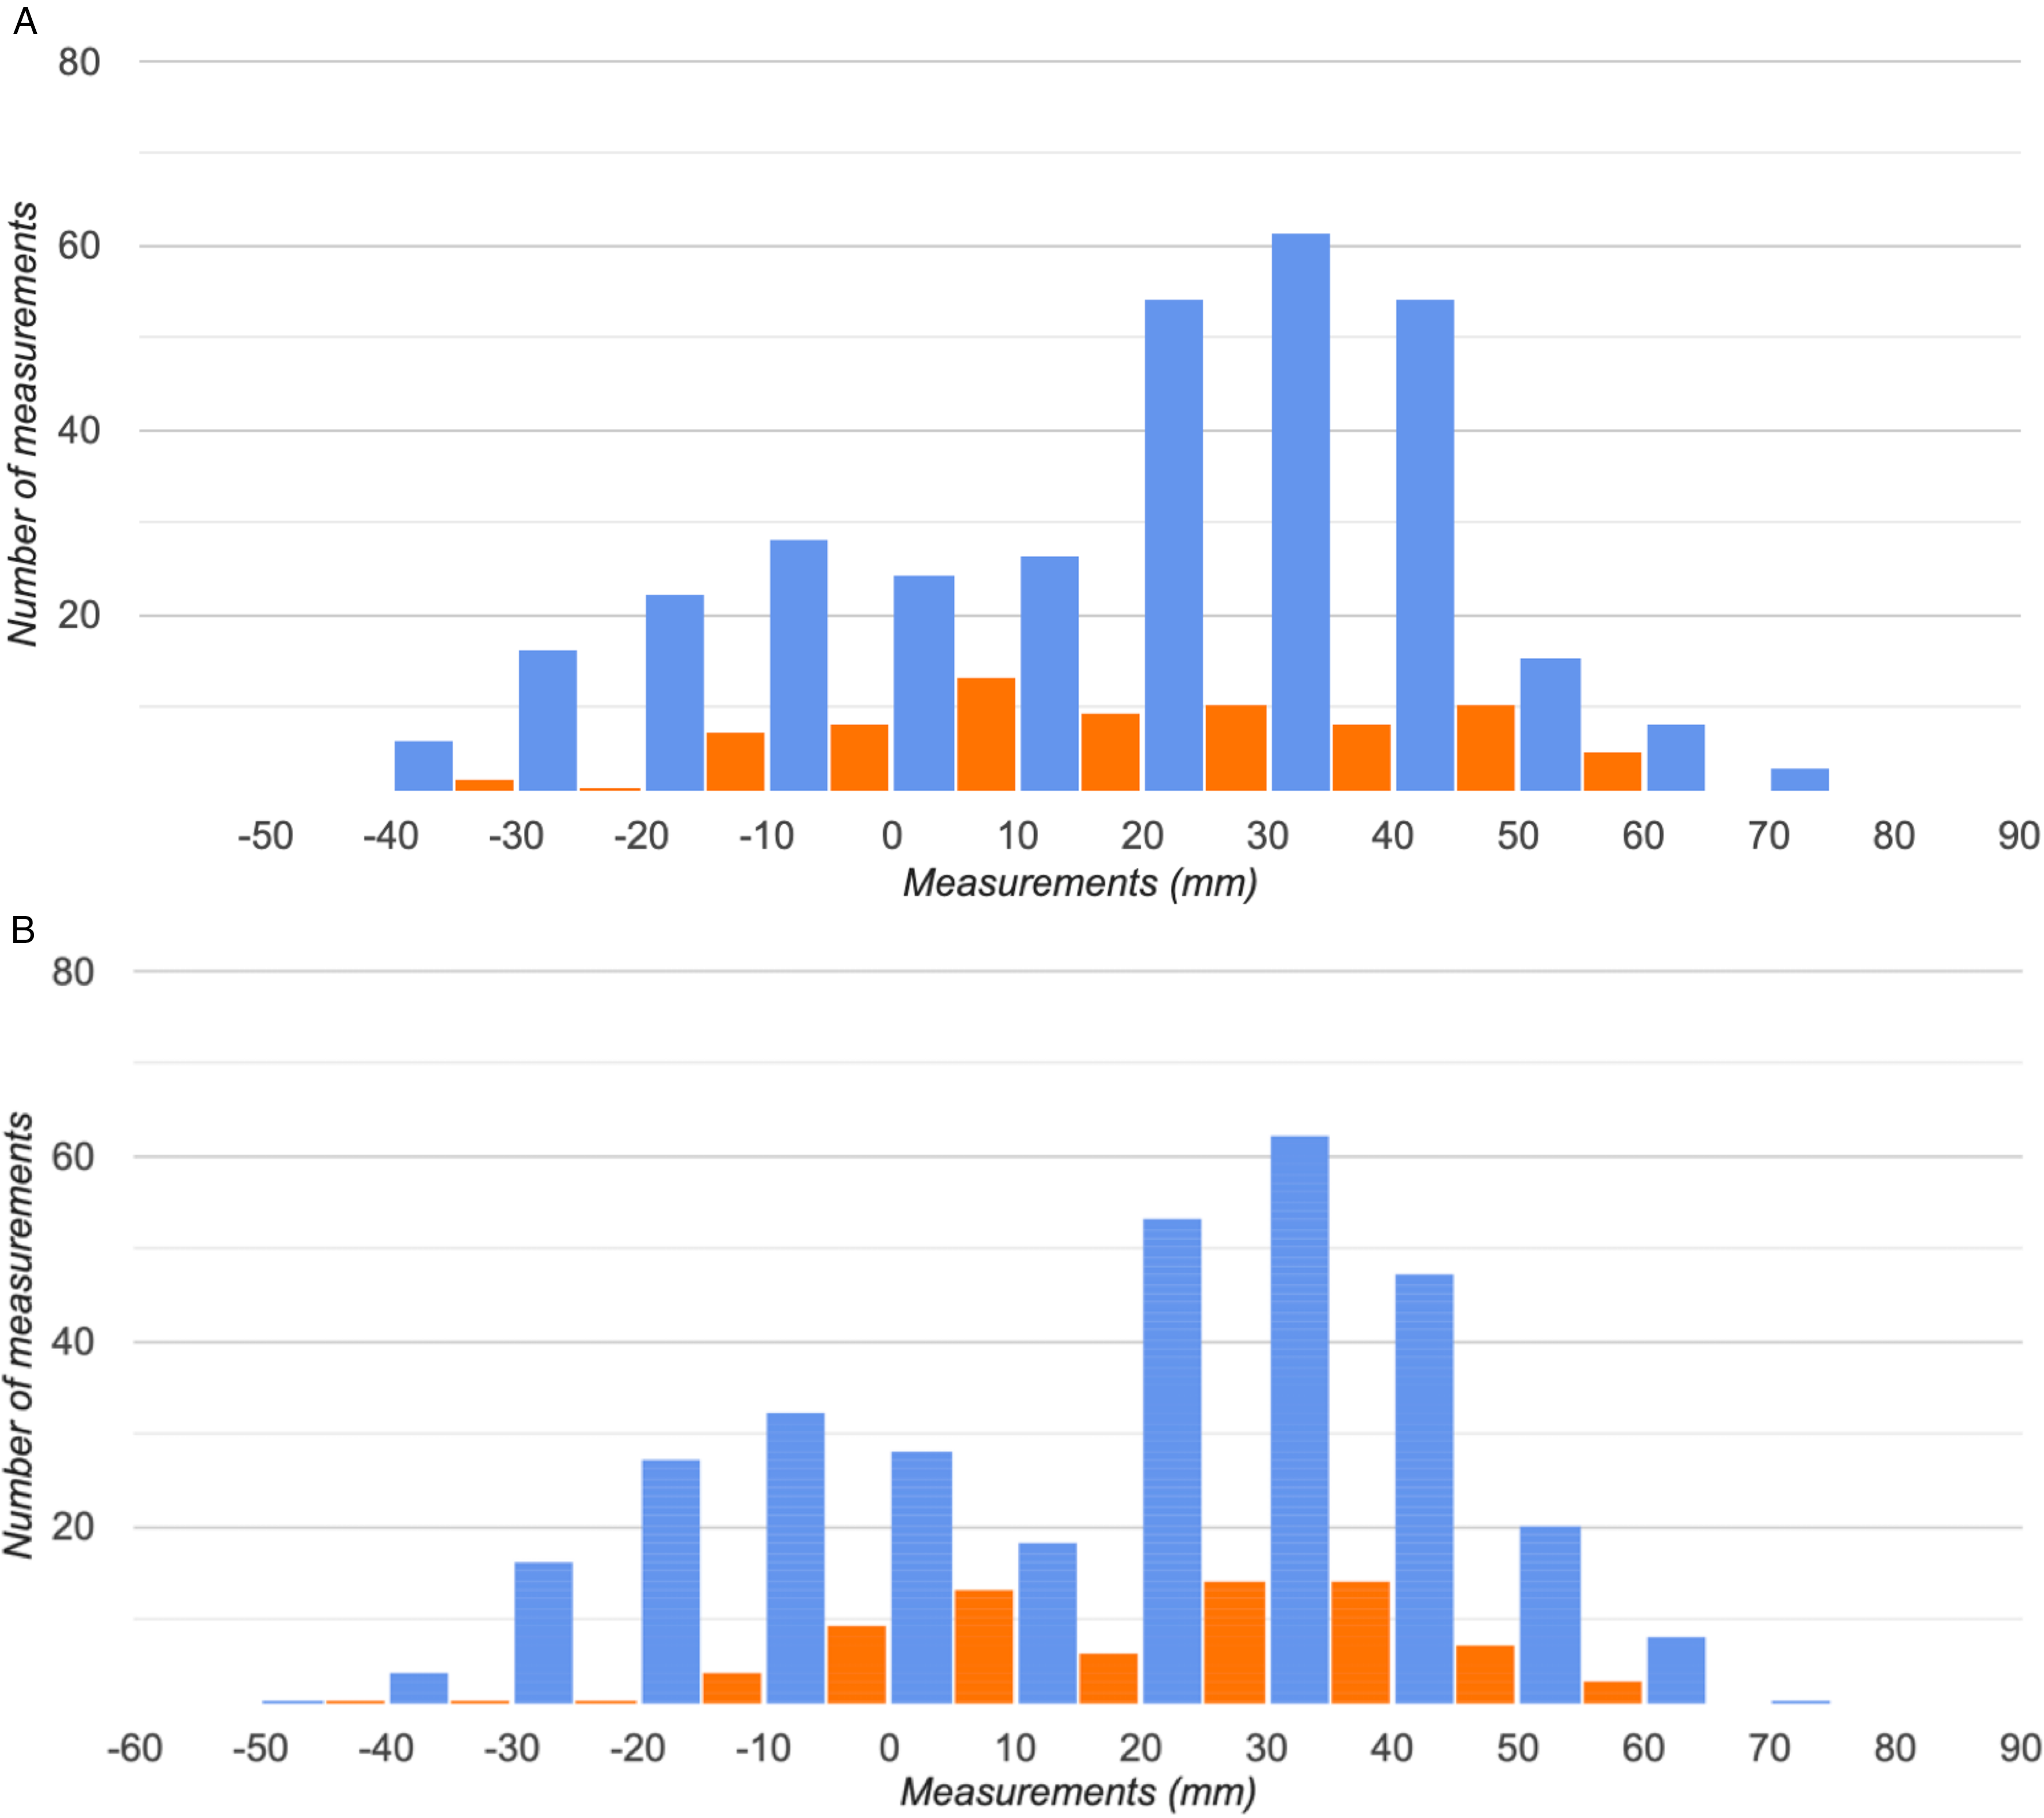
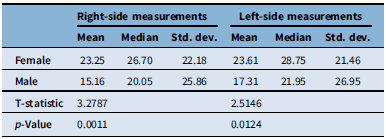
When stratified by sex, statistically significant differences were observed in the median insertion distances of the VoT. (Figure 5A and 5B). On the right side, the median insertion point was located 38.60 mm anterior to the marginal sulcus in females (IQR = 9.2–39.55) and 1.80 mm anterior in males (IQR = −7.05–36.6) (p = 0.000586). On the left side, the median insertion was 28.80 anterior in females (IQR = 8.1–39.25) and 4.40 mm anterior in males (IQR = −3.4–39.05) (p = 0.0182. Comparing the distributions for the left side, results of the Kolmogorov–Smirnov test indicated a significant difference between males and females D (213,177) = 0.15, p = 0.0182). Moreover, for the right side, the Kolmogorov–Smirnov test indicated a significant difference between the two distributions [(D(213,177) = 0.2, p = 0.000586) (Table 4). Notably, the standard deviation was greater among male patients on both sides, suggesting increased variability in the VoT’s confluence point relative to the SSS in males compared to females. Age did not significantly influence the insertion location in either sex (Figure 6).
Distribution of right- and left-sided measurements with respect to sex. (A) Left-side distribution. Results of the Kolmogorov–Smirnov test indicated a significant difference between the two distributions (D(213,177) = 0.15, p = .0182). (B) For the right side, results of the Kolmogorov–Smirnov test indicated a significant difference between the two distributions (D(213,177) = 0.2, p = .000586). In both panels, blue bars represent female subjects, and orange bars represent male subjects.

Figure 5. Long description
Two-panel figure showing grouped bar charts comparing the frequency distribution of vein of Trolard insertion measurements between female and male patients. Panel A shows the left hemisphere. Panel B shows the right hemisphere. In both panels, the x-axis is labeled “Measurements (mm)” and the y-axis is labeled “Number of measurements.” Blue bars represent females and orange bars represent males. In Panel A, the y-axis ranges from 0 to 60. The female distribution peaks at the 30 mm bin at approximately 50 counts and is concentrated between 20 and 40 mm. The male distribution is more spread out with a peak near 30 mm at approximately 29 counts and higher relative counts in the negative range. In Panel B, the y-axis ranges from 0 to 80. The female distribution peaks at the 30 mm bin at approximately 62 counts. The male distribution is again flatter and more spread, with counts generally below 15.
Correlation between patient age and left- and right-sided measurements. (A) Left hemisphere. The Pearson correlation coefficient is r = −0.0186. (B) Right hemisphere. The Pearson correlation coefficient is r = −0.0291. In both panels, the orange line represents the line of best fit. VoT = vein of Trolard; SSS = superior sagittal sinus.

Figure 6. Long description
Two-panel figure showing scatter plots of vein of Trolard insertion distance versus patient age. Panel A shows the left hemisphere. Panel B shows the right hemisphere. In both panels, the x-axis represents age in years ranging from approximately 20 to 90, and the y-axis represents distance from the marginal sulcus in millimetres ranging from approximately negative 60 to 80. Each blue data point represents one patient. A linear trendline is fitted through the data in each panel. In Panel A, the trendline is nearly flat with a Pearson correlation coefficient of negative 0.0186, indicating no meaningful correlation. In Panel B, the trendline is similarly flat with a Pearson correlation coefficient of negative 0.0291. In both panels, data points are widely scattered across the full measurement range at all ages, with no visible clustering pattern.
Summary of statistics for left- and right-sided measurements with respect to sex

Table 4. Long description
Table with two main column groups, “Right Side Measurements” and “Left Side Measurements,” each subdivided into “Mean,” “Median,” and “Std. Dev.” Two rows of data are shown by sex. For females, right side values were mean 23.25 mm, median 26.70 mm, standard deviation 22.18 mm, and left side values were mean 23.61 mm, median 28.75 mm, standard deviation 21.46 mm. For males, right side values were mean 15.16 mm, median 20.05 mm, standard deviation 25.86 mm, and left side values were mean 17.31 mm, median 21.95 mm, standard deviation 26.95 mm. The T-statistic was 3.2787 for the right side and 2.5146 for the left side. The p-value was 0.0011 for the right side and 0.0124 for the left side.
Discussion
The superficial venous anatomy of the cerebral convexity remains an area of both anatomic and surgical importance. The VoT, as the dominant superior anastomotic channel between the superficial middle cerebral vein and the SSS, has long been recognized for its variability and its proximity to eloquent cortical regions. Prior anatomic and radiologic studies have reported wide heterogeneity in its point of confluence with the SSS, ranging from anterior to posterior to the central sulcus. However, many of these investigations have been limited by small sample sizes or indirect measurements. The present study sought to address these gaps through a large-scale radiologic analysis of 390 patients, providing a quantitative description of VoT insertion relative to the marginal sulcus. To our knowledge, this represents the largest dataset to date specifically examining the VoT–SSS junction. By incorporating cases with SSS pathology, our study aimed to explore whether disease processes involving the SSS influence the venous drainage patterns of the VoT.
Our results demonstrate several consistent trends. Across the entire cohort, the VoT most commonly entered the SSS anterior to the marginal sulcus, with mean insertion distances of approximately 20 mm on both sides. Despite this general tendency, a bimodal distribution was observed, with the biggest peak at 34 mm anterior to the marginal sulcus and second peak occurring near or at the marginal sulcus itself. A small, but not insignificant number of patients were considered outliers with measurements more than 20 mm behind the marginal sulcus or more than 50 mm anterior to it. This pattern was symmetric across hemispheres and characterized by high inter-rater reliability (R ≈ 0.91–0.92), confirming the reproducibility of radiologic localization. Additionally, 4 (1%) patients had a VoT insertion of >70 mm to the marginal sulcus, highlighting our point regarding a non-zero number of patients have their dominant superior superficial anastomotic vein draining into the anterior third of the SSS. Importantly, the position of the VoT on one side did not predict its position contralaterally, consistent with the known independence of superficial venous drainage territories. When analyzed by sex, there were statistically significant differences observed in mean insertion points between male and female patients on both sides, suggesting that biological sex may in fact influence the location of the VoT–SSS confluence. The implications of these findings are clinically relevant. The point of VoT insertion into the SSS is a critical consideration during neurosurgical procedures near the vertex. Our study highlights the considerable variability in its location with respect to the marginal sulcus, underscoring that venous anatomy in this region cannot be assumed to follow a predictable pattern. The lack of correlation between left- and right-sided insertion points is of particular importance in surgeries involving both hemispheres or midline exposures, such as parasagittal meningioma resections or interhemispheric approaches. Each side must therefore be evaluated independently. With modern imaging modalities such as contrast-enhanced MRI and CT venography, surgeons can reliably identify venous anatomy preoperatively. Importantly, a small subset of patients have very anterior anastomosis and this challenges the over-simplified assumption that the anterior third of the SSS does not have important draining veins. Our findings reinforce the importance of routine preoperative venous evaluation, as preventable injury to the SSS or VoT remains a source of significant morbidity.
Several limitations must be acknowledged. Although our sample of 390 patients represents the largest cohort examined for this specific venous relationship, it remains modest relative to the true variability of cerebral venous anatomy. A larger sample size would enable more detailed subgroup analyses and more robust statistical modeling. For example, stratification by more granular demographic factors was not feasible in the present study but may yield additional insights into venous development. Another limitation is that our analysis focused on the VoT as a discrete, dominant venous channel. In practice, the cortical venous drainage pattern is more complex, with multiple and sometimes co-dominant veins converging on the SSS. Furthermore, in some cases, the VoT may drain into a parasagittal venous lake before entering the sinus, which could introduce measurement variability or minor inaccuracies in defining the true point of confluence.
Taken together, our findings challenge a long-standing neurosurgical dogma: that the anterior third of the SSS may be sacrificed with impunity. The demonstration of substantial variability in the anterior extent of VoT insertion suggests that, in some individuals, this vein may drain into the anterior SSS, making its sacrifice potentially catastrophic. Interruption of this venous outflow pathway could result in venous infarction and profound neurological deficits. Beyond its immediate anatomic implications, this study underscores the value of large-scale, quantitative venous mapping in refining operative safety near the vertex. Future work should therefore focus on expanding the dataset, which would enable more robust statistical modeling and subgroup analyses. This would allow investigation of other venous structures, stratification by pathology type and correlation with postoperative outcomes to provide tangible evidence supporting the need for preservation of the anterior SSS whenever possible.
Conclusions
This study represents the largest radiologic analysis to date examining the confluence of the VoT and the SSS. Our findings demonstrate that the VoT most commonly inserts anterior to the marginal sulcus in a bimodal distribution that is independent of age but significantly influenced by biological sex. The high degree of anatomical variability observed challenges the prevailing assumption of predictable venous drainage patterns at the vertex or the dogma that the anterior third of the sinus does not have major draining veins. These findings highlight the critical importance of routine, preoperative venous evaluation of each hemisphere to mitigate the risk of catastrophic venous injury during interhemispheric and parasagittal surgical approaches.
Author contributions
Conceptualization: Mos. F. AD, MT Methodology: Mos. F., AD, MT Formal Analysis: Mos. F, AD Investigation/Data Extraction: AD, MT Writing (Original Draft): Mor. F., Mos. F, AD, MT, Supervision: Mos. F.
Funding statement
This research did not receive any specific grant from funding agencies in the public, commercial or not-for-profit sectors.
Competing interests
The authors declare that there are no conflicts of interest to declare.