Introduction
The skin is the largest organ of the human body and protects it from the external environment. Its main functions are the regulation of temperature, sensation, water conservation, and immunological protection [Reference Hay, Augustin, Griffiths and Sterry1]. Skin wounds with a total area of more than 4 cm2 must be treated with a graft. When the healing process is not adequate, a wound can become chronic. Chronic wounds may not heal and lead to amputations or mortality [Reference Vig, Chaudhari, Tripathi, Dixit, Sahu, Pillai, Dennis and Singh2].
Recent biotechnological progress suggests that tissue engineering approaches have the potential to neutralize tissue and organ deficiencies [Reference Park, Ju, Lee, Kim, Lee, Moon, Park, Jeong, Yeon and Park3]. One of the main factors that influence the success of a graft is the type of tissue engineering scaffolding that is used. Some of the main criteria for the design of a tissue engineering scaffold for a specific type of tissue are the adhesion, infiltration, proliferation, and cell differentiation, as well as the development of new tissue in three dimensions [Reference Sundaramurthi, Krishnan and Sethuraman4]. Different techniques have been reported for the development of a functional scaffold for skin tissue engineering. Membranes synthesized by electrospinning have been classified as an optimal scaffolding option with useful biological and mechanical properties.
Electrospun nanofibers have exceptional properties such as a similar structure to the natural extracellular matrix (ECM), permeability, and the regulation scar formation [Reference Dias, Granja and Bártolo5, Reference Ranjbarvan, Mahmoudifard, Kehtari, Babaie, Hamedi, Mirzaei, Soleimani and Hosseinzadeh6]. Collagen is the most abundant protein in the ECM. This biomaterial is one of the most effective in the engineering of various tissues. The triple helix structure of collagen has a high content of the amino acid glycine and is very important for cell attachment and proliferation [Reference Ramanathan, Singaravelu, Raja, Nagiah, Padmapriya, Ruban, Kaveri, Natarajan, Sivagnanam and Perumal7]. Extracellular fibrous networks formed by the combination of collagen, elastin, and keratin allow tissues and organs to withstand stress and strain [Reference Chen and Liu8].
Commonly, the collagen used in tissue engineering is of mammalian and marine-animal origin. There has been much interest in alternative extraction sources of collagen, because of its high cost that limits its clinical applications. Chicken byproducts are economically and technologically viable substrates, which makes them an interesting option to obtain collagen [Reference Munasinghe, Schwarz and Nyame9, Reference Zhou, Li, Yu, Yang, Ma, Yagoub, Cheng, Hu and Otu10, Reference Cliche, Amiot, Avezard and Gariepy11, Reference Gojkovic, Marova, Matouskova, Obruca and Miloslav12]. Combinations of collagen and elastin have been electrospun for the synthesis of different scaffolds. The presence of elastin in nonelectrospun collagen scaffolds has been observed to decrease the rigidity of the scaffolds, modulate the contraction and degradation of the collagen, and improve angiogenesis and the formation of elastic fibers. The combination of collagen and elastin has the potential to improve the physical and biological properties of a dermal substitute [Reference Buttafoco, Kolkman, Engbers-Buijtenhuijs, Poot, Dijkstra, Vermes and Feijen13, Reference Rnjak-Kovacina, Wise, Li, Maitz, Young, Wang and Weiss14].
Extensive research on different types of scaffolds for skin tissue engineering has been reported in recent decades. In addition, numerous commercial options are available for the treatment of deep skin wounds. Although the scaffolds still have drawbacks, they have provided remarkable progress in the repair of skin tissue and wound healing [Reference Chaudhari, Vig, Baganizi, Sahu, Dixit, Dennis, Singh and Pillai15, Reference Chua, Khoo, Tan, Tan, Foo and Chong16]. The ultimate goal of tissue engineering in wound repair is providing patients with a skin substitute that can regenerate damaged tissue as quickly as possible with minimal or no scar formation [Reference Ho, Walsh, Yue, Dardik and Cheema17]. In this work, collagen was extracted from chicken skin and combined with elastin for the electrospinning synthesis of a cross-linked nanofibrous scaffold. The potential use of the scaffolding in skin tissue engineering was studied by evaluating the adhesion and cell proliferation of keratinocytes and human fibroblasts within the matrix and validating the use of a low cost alternative source of collagen, in the synthesis of scaffolds and its possible clinical application.
Results and discussion
Extraction of chicken skin collagen
Collagen stimulates biological interactions and restoration of the microenvironment of the cells. It is a nontoxic protein and easily absorbed by the body [Reference Sekuła and Zuba-Surma18]. Chicken skin may be a new source of collagen for tissue engineering applications. Lyophilized collagen was obtained and pulverized for later use. The yield obtained during the extraction of collagen was 43.86% wet and 1.45% after drying and lyophilization. The extraction yield of chicken skin collagen is similar to that obtained by Lin and Liu [Reference Lin and Liu19], who used bird legs and obtained yields of 0.7–1.6% collagen. It is possible to obtain a greater amount of collagen from chicken skin waste, considering that it is the largest organ in the bird body.
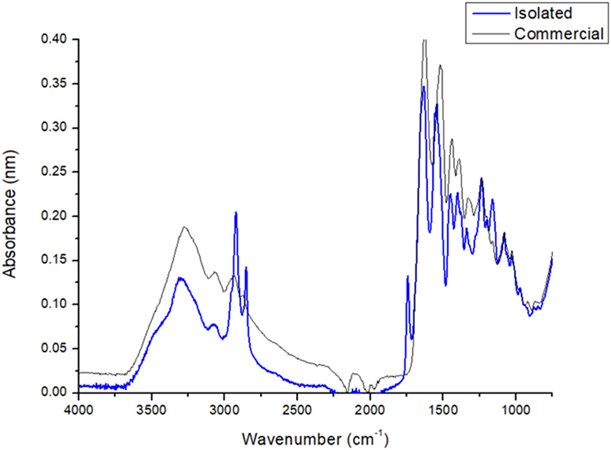
To confirm that the obtained extract was collagen, it was characterized by infrared spectroscopy and compared with commercial collagen (Everest NeoCell LLC, Oakland, California). The infrared spectrum of both collagens was obtained, and the results were similar (Fig. 1). Furthermore, the IR spectrum was compared with published spectra for collagen from other animals. The spectra were similar to those reported for some fish species, and the characteristic peaks of collagen were observed [Reference Muyonga, Cole and Duodu20, Reference Pati, Adhikari and Dhara21, Reference Singh, Benjakul, Maqsood and Kishimura22, Reference Woo, Yu, Cho, Lee and Kim23]. The IR spectrum of chicken skin collagen is characterized by five distinct peaks called amide A, amide B, amide I, amide II, and amide III.
Infrared spectrum of chicken skin collagen and commercial collagen reference.

The amide A peak of collagen is found near a wave number of 3273 cm−1. According to Doyle et al. [Reference Doyle, Bendit and Blout24], an extension vibration of free N–H occurs in the range of 3400–3440 cm−1. This peak indicates that the NH2 groups of the collagen are involved in hydrogen bonds, which probably occur with the carboxyl groups of the peptide chain. The amide B peak occurs at a wave number of approximately 2923 cm−1 and represents the asymmetric extension of CH2 [Reference Muyonga, Cole and Duodu20]. The amide I peak is located near a wave number of 1634 cm−1. This peak has a characteristic frequency range of 1600–1700 cm−1 and is mainly associated with the vibrations of carbonyl group extension (C=O bond) along the peptide chain [Reference Payne and Veis25]. It is also a marker of the secondary peptide structure [Reference Surewicz and Mantsch26].
The band of amide II occurs at a wave number of 1541 cm−1, whereas the band of amide III is located at a wave number 1235 cm−1. These bands represent the flexural vibrations of the N–H bond and the extension of the C–H, respectively [Reference Payne and Veis25]. There was also a peak at 1743 cm−1, which is attributed to the strong extension of C–H. Singh et al. [Reference Singh, Benjakul, Maqsood and Kishimura22] also observed this stretching pattern in fish skin. The ratio of the wave number of amide III to 1454 cm−1 is 1.17. An IR ratio of approximately 1 indicates the presence of a helical structure, which is characteristic of collagen [Reference Plepis, Goissis and Das-Gupta27].
Scaffolding synthesis by tissue engineering
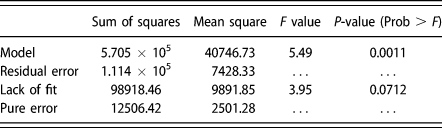
The results of the response surface are shown in Table I for the adjusted model of the diameter of the nanofibers. The analysis of variance (ANOVA) indicated a P-value less than 0.05% (P > F = 0.0011), which is indicated by test F and shows that the factors of the diameter of the nanofibers have variance. The coefficient of determination was R 2 = 0.84, which indicates that the mathematical model has a good fit to the experimental values. The least significant factors during the electrospinning process in the central composite design (CCD) were the voltage and the distance from the tip of the needle to the collector. Therefore, they were kept constant to determine the response surface of the diameter of the gelatin nanofibers. The parameters that result in the most significant differences were the concentration of the protein in the solution and the feed flow rate of the biopolymer.
Variance analysis of the model.

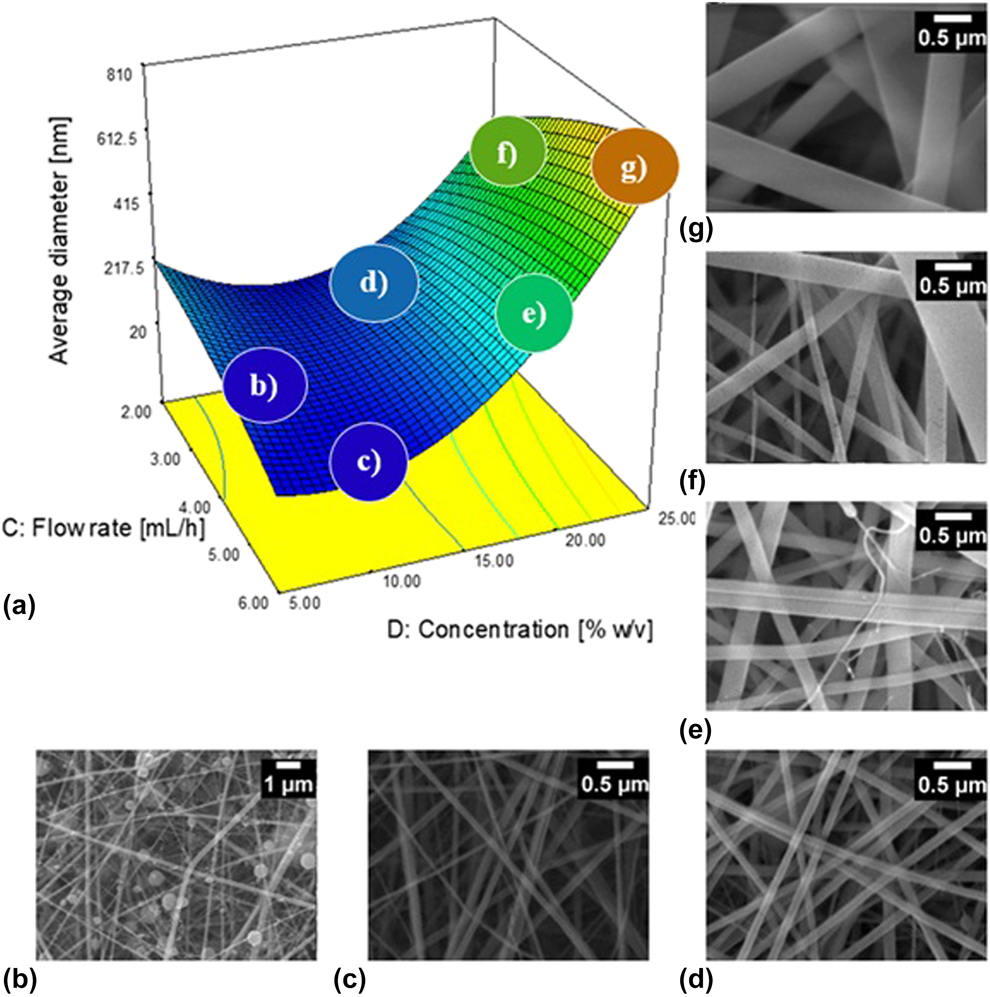
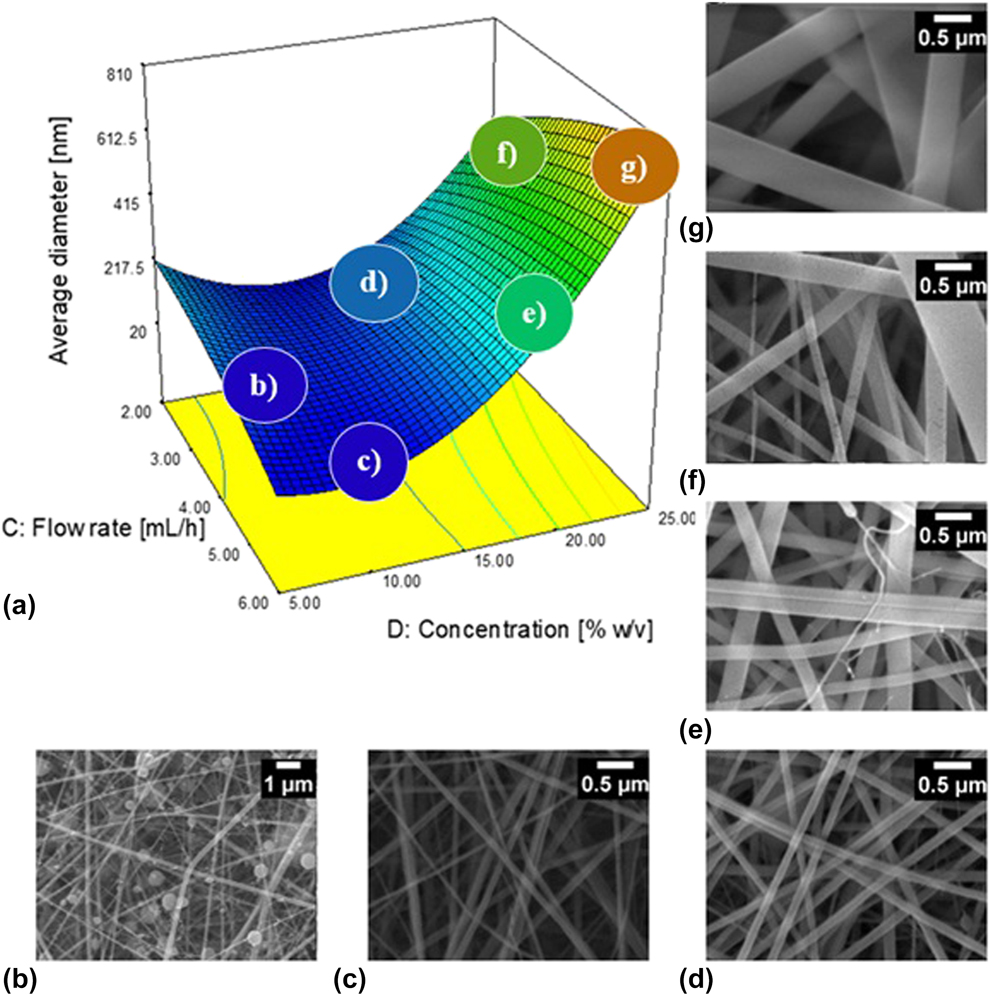
The predicted values of Y (the diameter of the fibers) were estimated based on the range of the factors in response surface methodology (RSM) as a response surface graph using a mathematical model. The model is a three-dimensional theoretical scheme that visually explains the relationship between the response and independent factors (Fig. 2) [Reference Mina, MohammadReza, Ruhollah Mehdinavaz, Keyvan and Masoud28, Reference Ortega-Arroyo, Martin-Martinez, Aguilar-Mendez, Cruz-Orea, Hernandez-Pérez and Glorieux29]. The average diameter of the nanofibers increased with their concentration in the solution. A smaller diameter of nanofibers (76 nm) was obtained at a concentration of 10% (w/v) and a flow rate of 4 mL/h. The graphs of the response surface showed that diameters that are more similar to those present in the ECM are obtained at a concentration of 13% gelatin fiber.
Response surface of the CCD (a), remaining constant at 12.5 kV and 12.5 cm, from the tip of the needle to the collector. SEM micrographs in each synthesis condition, to 5 (b), 10 (c), 15 (d), 20 (e), 22.5 (f), 25 (g) concentration of the protein (%w/v) respectively.
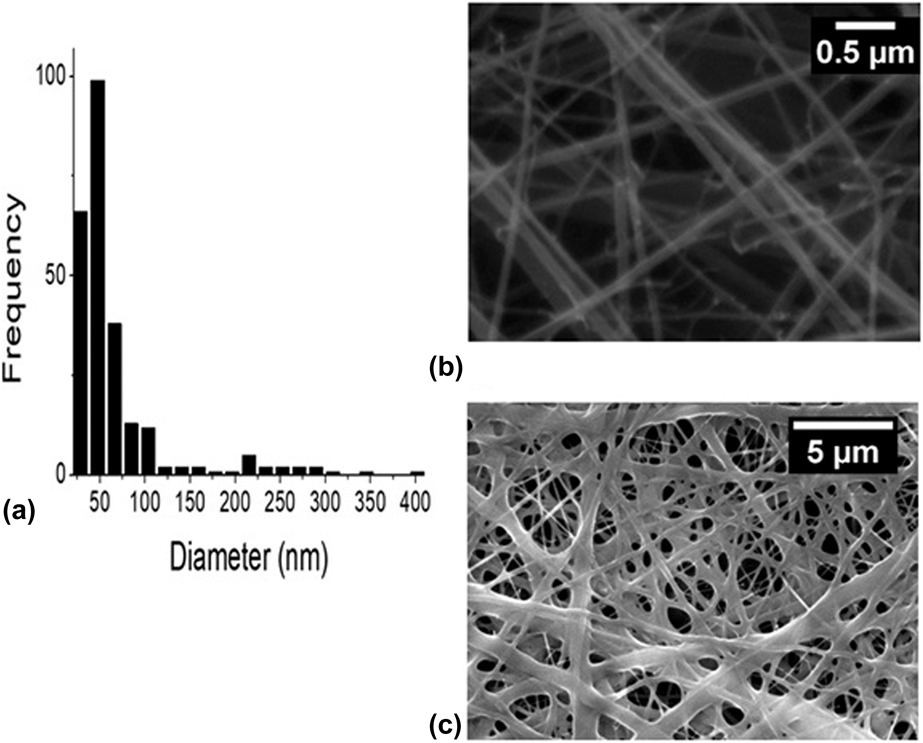
Using these results, the synthesis of collagen nanofibers with elastin was performed. With the preliminary information, it was proved that the diameter of the nanofibers can vary by increasing or decreasing the viscosity of the solution; the required diameter was obtained by varying the proportion of collagen. When adding elastin to the solution, the nanofibers showed a slight decrease in diameter. The weight ratio of 4:1 was the one that showed the desired characteristics. Figure 3(a) shows the distribution of the diameters of the nanofibers of the combination of the biopolymers, which were similar to those found in the ECM [Reference Bosman and Stamenkovic30]. Scanning electron microscopy (SEM) micrographs showed that the electrospinning of the combination of collagen and elastin was homogeneous [Fig. 3(b)]. The lowest diameter was 28 nm, and the highest diameter was more than 500 nm. The mean diameter was 79 nm. The largest proportion of fibers had diameters less than 100 nm. The micrograph also shows the cross-linking of the nanofibers by carbonyldiimidazole [Fig. 3(c)].
(a) Diameter distribution of collagen and elastin nanofibers. Micrograph structure nanofibers (b) uncross-linked and (c) cross-linked by CDI.

Adhesion and cell proliferation within the scaffolding
The cell adhesion and proliferation of human keratinocytes and fibroblasts within the scaffold were evaluated by the standard MTT assay to determine the cell number and viability. The surface of the polystyrene wells of plates was used as a target. Non–cross-linked scaffolds and cross-linked scaffolds with CDI and glutaraldehyde were placed in the wells, and the cells were seeded onto the matrix. The adherent and nonadherent cells on the scaffold were measured by removing the scaffold at the time of measurement and placing it in a clean well so that only the cells that adhered to the surface of the well were quantified and not those that adhered to the scaffold. The scaffold was then washed with phosphate buffered saline (PBS) to remove the cells with poor adherence.
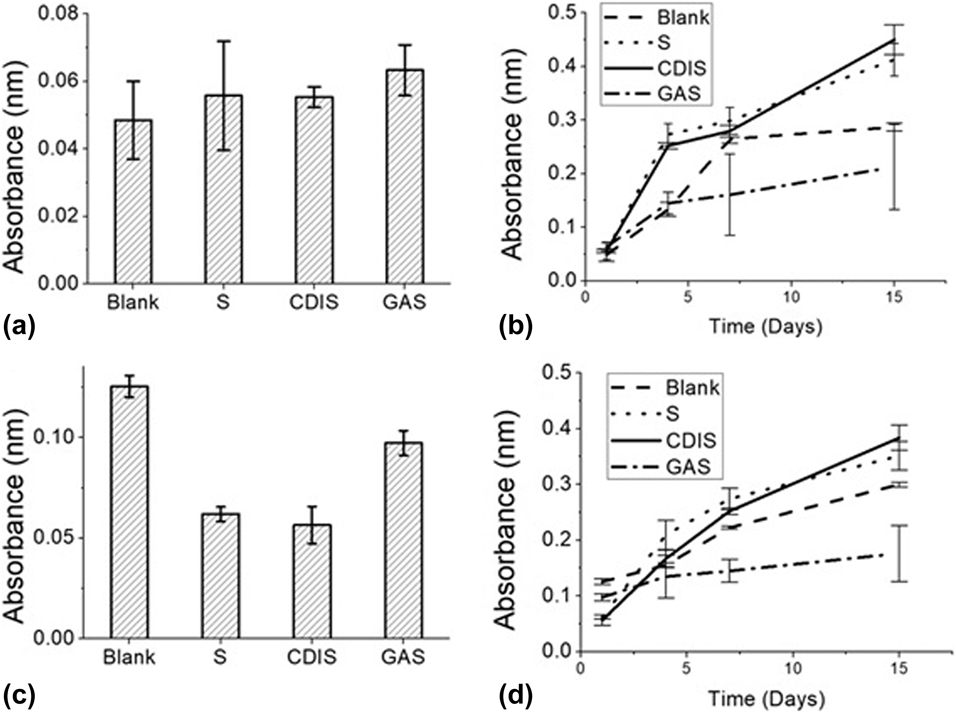
The cell adhesion on the scaffolds is shown in Figs. 4(a) and 4(c). The absorbance is reported for the targets and the cells that adhered to the surface of each scaffold. The cell proliferation was monitored on days 4, 7, and 15, and the mitochondrial activity of the cells was measured by the MTT assay, as was done with cell adhesion. Figures 4(b) and 4(d) show the kinetics of the cell growth in the different scaffolds over time.
Cell adhesion of (a) human fibroblasts and (c) human keratinocytes within the scaffolds; synthesized measured at day one of the culture. Cell growth kinetics within the scaffolds during fifteen days of culture, (b) human fibroblasts and (d) human keratinocytes. S: scaffold uncross-linked; CDIS: cross-linked scaffold with CDI; GAS: scaffold cross-linked with glutaraldehyde.

The tests conducted with glutaraldehyde as the cross-linking agent of the nanofibers showed cytotoxicity and low proliferation within the cross-linked scaffolds. The results coincided with those obtained by Lee et al. [Reference Lee, Yoo, Lim, Atala and Stitzel31], which showed a decrease in mitochondrial activity in the cross-linked scaffolds after 2 days of culture. Rho et al. [Reference Su Rho, Jeong, Lee, Seo, Jeong Park, Hong, Roh, Jin Cho, Park and Min32] also observed similar cytotoxicity behavior when using glutaraldehyde as a chemical cross-linker. Although glutaraldehyde is commonly used as a cross-linker, its residues and the unstable glutaraldehyde polymers retained in the cross-linking are implicated in the toxicity of the scaffolds [Reference Gough, Scotchford and Downes33]. CDI is an alternative cross-linker that has been used in different works showing cellular growth [Reference Jocic, Mestres and Tenje34, Reference Koch, Hammer, Ossmann, Schierle, Sack, Hofmann, Wecks and Boldt35]. There was cytotoxicity in adherent and nonadherent cells in scaffolds that were cross-linked and not cross-linked with CDI. These scaffolds supported cell adhesion and proliferation and also increased cell growth.
The growth kinetics of each scaffold were examined to observe the growth of the cells during the culture period, as shown in Figs. 4(b) and 4(d). In the scaffold cross-linked with glutaraldehyde, there was cell adhesion but no growth over time. In the non–cross-linked scaffolds and the scaffolds cross-linked with CDI, there was markedly higher growth after day 7 compared to the controls. In both cell types, there was greater growth in the scaffold cross-linked with CDI on day 15, which showed the highest growth rate. Chemical cross-linking is commonly used to improve mechanical properties and degradation rates, in addition to increasing porosity, cell proliferation, and migration within collagen scaffolds [Reference Haugh, Murphy, McKiernan, Altenbuchner and O’Brien36]. Cell growth in the cross-linked scaffold was greater during the study time; although at the beginning, results were similar to the non–cross-linked scaffold, at the end of the culture time the cross-linked scaffold exceeded it in growth. Probably, studying a longer culture time, a greater difference in cell growth could be appreciated. In addition, the non–cross-linked scaffold does not have sufficient rigidity and can be degraded by collagenases [Reference Powell and Boyce37].
These tests indicate that the scaffold cross-linked with CDI is appropriate for use in skin tissue engineering. It should increase the reproduction of cells present in the skin, which could provide faster wound healing. The arrangement of the ordered and uniform fibers could produce less obvious scarring and tissue that is more similar to that not affected by a wound.
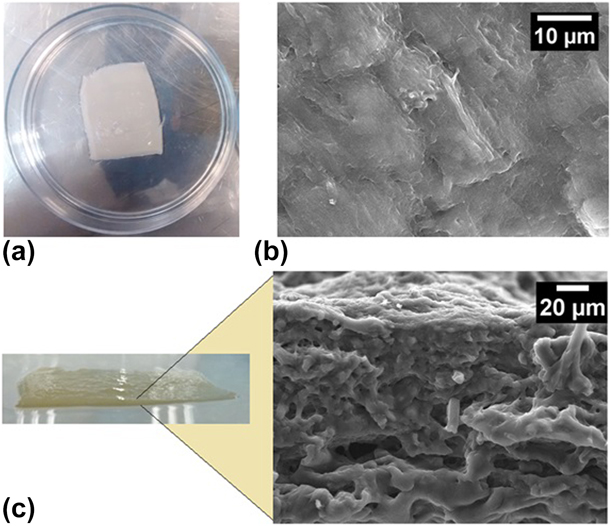
The SEM analysis showed the morphological changes on the surface of the scaffold after cell growth. Figure 5 shows the macrostructure and microstructure of scaffolds cross-linked with CDI on the eighth day of culture. The micrographs show the layer formed by the cells that adhered to the scaffolding. Figure 5(a) shows a scaffold cultured with cells. It has smooth texture and a light color, which are favorable characteristics for not causing the formation of scars.
(a) Scaffold cross-linked by tissue engineering with CDI. (b) Scaffold micrograph completely covered with human fibroblasts. (c) Transverse micrograph of the scaffold on the eighth day of culture.
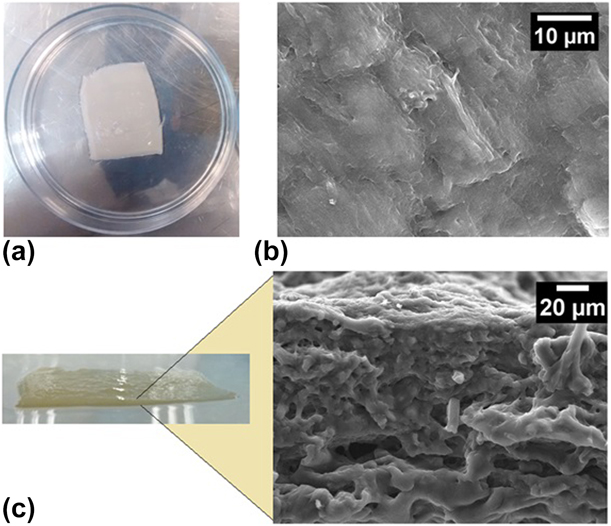
The SEM study of cells that adhered to the surface of the CDI scaffold showed that a large number of cells had already completely covered the surface of the nanofiber scaffold and formed a cellular monolayer, which happened for both cell types [Fig. 5(b)]. The SEM analysis confirmed the adhesion of the cells to the nanofiber scaffold and demonstrated desired interactions between the cells and the scaffold. The micrograph of the transverse view of the scaffold [Fig. 5(c)] shows the differences in structures resulting from cell growth within the scaffold. In the upper part, the adhered cells grow on one another, and in the lower part, the scaffolding acts as a support for the cells.
Conclusions
Collagen from byproducts such as chicken skin can be used for tissue engineering. The cross-linking agent can affect cell growth within the scaffolds. The results indicate that CDI does not present cytotoxicity when used as cross-linking agent. The composition and structure of the scaffold of collagen and elastin nanofibers provide a favorable environment for cell adhesion and proliferation. The developed scaffolding could be an option for applications in tissue engineering and the development of human skin substitutes.
Materials and methods
Extraction and purification of collagen
The procedure described by Lin and Liu [Reference Lin and Liu19] was used for collagen extraction with some modifications. Chicken skin was obtained from a chicken shop (Mexico City, Mexico). The skin was cut into small pieces and washed several times with water and then distilled water. The clean skins were liquefied in a domestic blender (Oster, Mexico City, Mexico) to obtain a homogenous mass. Fats and pigments were eliminated by centrifuging the blended skin at 1700 rpm for 30 min in an International Centrifuge Model K centrifuge (International Equipment Company). The supernatant containing the fats from the tissue was discarded. The solid phase was recovered and washed with 0.5 M acetic acid at pH 2.5 under agitation. It was then centrifuged again at 1700 rpm for 30 min, and the supernatant was discarded.
Dialysis
Segments of approximately 15 cm in length were obtained from a membrane with a 22-mm diameter and used for dialysis (Spectra/Por® Dialysis Membrane MWCO: 25,000). The membranes were immersed in distilled water to activate its pores. The protein was then added inside the membrane, immersed in beakers containing distilled water, and placed in a shaker (Benchmark Scientific Incu-Shaker™ 10LR, New Jersey) at 4 °C for 72 h. The dialyzed distilled water was changed every 24 h. At the end of the dialysis, the pH of the protein was adjusted to 7.
Lyophilization
Collagen dialyzed at pH 7 was transferred to 50-mL falcon tubes and frozen in a Panasonic® MDF-U33V-PA ultrafreezer at −80 °C. The frozen collagen was freeze-dried using a lyophilizer (Labconco FreeZone 4.5, Kansas City, Missouri). At the end of the process, the falcon tubes were removed and weighed to calculate the yield of the extraction. The solid lyophilized collagen was stored at 4 °C.
Infrared spectroscopy analysis
The lyophilized collagen was subjected to an infrared spectroscopy analysis using an FTIR spectrophotometer (Cary 630 FTIR, Agilent Technologies). To analyze the sample, the collagen was placed on the glass of the equipment, which had an attenuated total reflection (ATR) accessory. The infrared spectrum was obtained in the range of 4000 and 750 cm−1. To confirm the presence of collagen and its purity, commercial collagen (NeoCell) was used for comparison.
Preparation of collagen and elastin scaffold
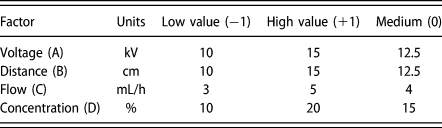
To determine the best conditions to obtain a diameter distribution similar to that present in the ECM, RSM was used with a CCD. Type b bovine skin gelatin (Sigma-Aldrich) was used to perform electrospinning experiments, analyze the process, and define the best conditions for the synthesis of collagen and elastin nanofibers. The factors studied were the concentration of the solution (% w/v), applied voltage (kV), distance from the tip of the needle to the collector (cm), and flow rate (mL/h) (Table II). The experimental model included 30 experiments with 6 replicas of the central points. All the experiments were conducted randomly. An ANOVA was then performed to evaluate the response surface models in terms of their fit to the experimental data.
Variables and levels of the composite central design.
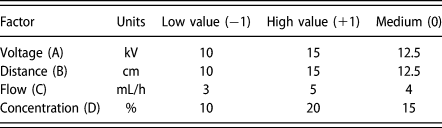
The morphology and diameter of the nanofibers and scaffolding were studied by combining the lyophilized collagen with bovine elastin (Sigma-Aldrich) at different weight ratios (6:1, 5:1, 4:1, 3:1, 2:1, and 1:1). The elastin remained at a constant weight and the collagen varied. The mixture of the biopolymers was placed in a 5-mL BD syringe. The solution was electrospun using a syringe infusion pump (NE-4000 Programmable 2 Channel Syringe Pump, New Era Pump Systems Inc.), and an electrical potential was applied using a Spellman high-voltage source CRT40X2199 (Spellman, New York). The optimum conditions determined with the experimental design shown in Table II. The fibers were collected in a static electrode made of a copper plate that was covered with aluminum foil. The prepared scaffolds were stored in a desiccator at room temperature for later use.
Crosslinking
Glutaraldehyde vapor and carbonyldiimidazole (CDI) (Sigma-Aldrich) were used for the cross-linking of the nanofibers. The scaffolds were placed in a desiccator and open steam cross-linker, and the glutaraldehyde was placed in a beaker at the bottom with a concentration of 25% v/v in aqueous solution (Sigma-Aldrich) for 24 h. The unreacted glutaraldehyde of the scaffolds was inactivated by immersion in a 0.2 M glycine solution overnight [Reference Rnjak-Kovacina, Wise, Li, Maitz, Young, Wang and Weiss14]. The scaffolds were immersed in a solution of CDI in 100% ethanol for 24 h.
Sterilization
The cross-linked scaffolds were repeatedly rinsed with PBS. Next, they were disinfected in 70% ethanol for 24 h and sterilized by UV radiation for 10 min.
Cell culture preparation
Normal adult human dermal fibroblasts (ATCCR PCS-201-012) and normal primary human adult epidermal keratinocytes (ATCCR PCS-200-011) were used for cell culture. The cell culture was prepared using the procedures described by the suppliers of the cell lines with minor modifications (Primary Dermal Fibroblasts; Normal, Human, Adult (ATCC® PCS-201-012™); Primary Epidermal Keratinocytes: Normal, Human, Adult (ATCC® PCS-200-011™)).
Start of cultivation
The initiation of the culture consisted of defrosting the corresponding cells by placing the cryovial that contained them in a water bath at 37 °C. To reduce the likelihood of contamination, the cryovial cap was kept out of the water. This heating process must be fast (approximately 2–3 min). The vial was removed from the water as soon as it thawed. After removal from the water, the vial was cleaned with sterile gauze and 70% ethanol and introduced into a laminar flow cabinet (LABCONCO Purifier Biological Safety Cabinet, Kansas City, Missouri).
Next, 9 mL of DMEM HAMS F12 medium was placed in a sterile, preheated 15-mL falcon tube. The contents of the vial were gently homogenized and transferred to the falcon tube with the medium. The tube was then centrifuged at 125 g at room temperature for 10 min. The supernatant was removed without undoing the cell, button, and 10 mL of DMEM HAMS F12 medium was added. The sample was homogenized, and 1 mL was transferred to a sterile 1.5-mL microcentrifuge tube.
A cell-counting and viability studies wre performed using a MUSE™ Cell Analyzer (EMD Merk-Millipore Corporation, Frankfurter, Germany). The cells were then seeded at the appropriate confluence in a sterile p100 plastic Petri dish with 12 mL of medium. Finally, the cells were incubated (BINDER C150-UL, Massachusetts) in a humid environment at 37 °C with 5% CO2.
Cultivation maintenance
The culture medium was replaced every two days in the following manner. In sterile conditions, the medium was removed while taking care not to disturb the cell layer. Next, 2 rinses with PBS were performed in the Petri dishes, and 12 mL of new preheated medium was added. Finally, the dishes were incubated again. The percentage of confluence during the cultivation period was monitored using an optical microscope.
Adhesion and cell proliferation evaluation
The adhesion and proliferation of the cells in the scaffolds was observed using the standard MTT assay (3-(4,5-dimethylthiazol-2-ilo)-2,5-diphenyltetrazole bromide) (Sigma-Aldrich, Mexico City, Mexico) at 1, 4, 7, and 15 days after the start of the culture. Human fibroblast and keratinocyte cells were seeded on the scaffolds at a density of 104 cells/cm2 in 24-well plates and incubated in DMEM HAMS F12 medium in a culture environment at 37 °C and 5% CO2. The medium was changed every 2 days. The medium was removed, and then nonadherent cells and poorly adherent cells were also removed by washing the wells with PBS (pH 7.2–7.6). MTT solution in DMEM medium (1:9) was added into each well and incubated at 37 °C in 5% CO2 for 3 h.
After 3 h, the MTT solution was aspirated from the wells and replaced with dimethyl sulfoxide (DMSO) (Sigma-Aldrich), which solubilizes the formazan crystals. The DMSO solution was transferred to a 96-well plate, and the absorbance of the released MTT-formazan product was measured at 570 nm in a microplate reader. Cells were also seeded in standard polystyrene 24-well plates and used as a control [Reference Shan, Peng, Liu, Chen, Xiong and Gao38, Reference Zeybek, Duman and Ürkmez39].
SEM
The morphology and diameter of the electrospun fibers were analyzed by scanning electron microscopy (SEM) (JSM-6390LV, JEOL, Tokyo, Japan). SEM with a voltage of 20 kV was used to obtain the micrographs and analyze them. The fibers were coated with gold for 1 min for the SEM observations. The mean diameter of the nanofibers was determined by analyzing the SEM images using the software Scandium SEM interface Ver. 8.20 of JEOL.
An SEM study was performed to observe the morphological changes and cell growth in the scaffolds that were synthesized during the culture. The surfaces and cross sections of the scaffolds were observed by SEM on day 8 of culture. The samples were fixed in 2.5% glutaraldehyde to enable observation. After the samples were processed by dehydration by increasing amounts of ethanol [Reference Li, Mondrinos, Chen, Gandhi, Ko and Lelkes40], the same procedure was used to observe the fibers in SEM.
Statistics
The software Design Expert Version 7.0 (Stat-Easy) was used for the statistical analysis of the experimental data. OriginPro 8.5 (OriginLab) was also used to analyze the data.
Acknowledgments
J. Jiménez Vázquez is thankful for the scholarship program granted by the National Council of Sciences and Technology (CONACYT) and the Institutional Support for Research Incentive Grant (BEIFI-IPN).