1. Introduction
With the continuous development of economic globalisation, international trade among countries has flourished, leading to a significant increase in the total volume of traded goods. Most goods are transported by ship, with maritime shipping accounting for 90% of the total. This proves the significant role of maritime shipping in global economic development. Additionally, expanding marine fisheries has resulted in more vessels navigating farther out into the oceans, raising risk and management challenges.
To mitigate these risks and enhance vessel management, analysing data such as the ship's automatic identification system (AIS) and predicting navigational trajectories with higher accuracy and speed have become a significant issue. Maritime traffic safety is one of the foremost concerns of maritime authorities. Trajectory prediction can help maritime authorities monitor vessels, contributing to marine traffic safety. Vessel monitoring also constitutes an indispensable component of intelligent maritime traffic systems (Shojaei and Dolatshahi, Reference Shojaei and Dolatshahi2017). Additionally, ship trajectory prediction is a prerequisite for collision detection and risk assessment (Zhen et al., Reference Zhen, Shi, Shao and Liu2022). In maritime contexts, predicting the future positions of vessels is critical for optimising energy consumption, ensuring navigation safety and improving regulatory efficiency, which is integral to numerous maritime surveillance and maritime situational awareness (MSA) tasks (Tu et al., Reference Tu, Zhang, Rachmawati, Rajabally and Huang2018). Therefore, improving the precision of ship trajectory prediction is crucial for enhancing maritime safety. Various factors will affect the motion state of a ship, such as ocean currents, marine environment and weather, etc. The ship trajectory characteristics can be summarised as having variance and being highly nonlinear (Liu et al., Reference Liu, Wang, Zhang and Ren2021).
Although the time-varying and nonlinear nature of the marine environment makes trajectory prediction more complex, the essence of trajectory information can be summarised as time series data. The motion state of the ship exhibits a certain continuity, and its trajectory does not have sudden jumps, indicating that its position at a particular moment is correlated with its past positions. Therefore, the trajectory prediction can be transformed into a time-series prediction problem. By selecting several positions on the trajectory with a specific time interval and utilising the continuity property of the trajectory, the past trajectory information can be used to predict the position at future timesteps. While numerous studies concentrate on time-series prediction tasks, only a few methods effectively balance prediction efficiency and accuracy. Research on time-series prediction tasks remains relatively limited within the maritime domain. Thus, the PGL model is proposed in this paper for ship trajectory forecasting, with improved performance of prediction accuracy and efficiency.
In this paper, the trajectory prediction problem is transformed into a time-series prediction problem and a novel hybrid particle swarm optimisation (PSO) and grey wolf optimisation (GWO) long, short-term memory (LSTM) neural network model is proposed (PGL model).
The LSTM neural network is utilised to capture the internal correlations of historical trajectory data. To improve the accuracy of prediction and reduce the training time for trajectory prediction, a hybrid PSO and GWO algorithm is introduced to optimise hyperparameters of LSTM. The main contributions of this paper can be summarised as follows:
(1) Utilising LSTM to effectively mine the internal correlations of the target's historical trajectory data, alleviate the vanishing gradient problem and better capture long-range dependencies in sequences.
(2) The hybrid PSO-GWO algorithm is introduced to overcome the inadequate global search capability and iteration speed of the PSO algorithm.
(3) The hybrid PGL model utilises a hybrid PSO-GWO algorithm to optimise LSTM hypermeters to enhance prediction accuracy and efficiency.
The remainder of this paper is structured as follows: Section 2 is an exposition on the background and related research. Section 3 provides a concise introduction to the PGL model along with its methodology. Section 4 describes the experiments and the subsequent comparison of results. Finally, Section 5 presents conclusions drawn from this study.
2. Background and related work
2.1 Time series forecasting
A commonly employed approach for time-series forecasting involves using discrete data points. In this case, the predictive task entails utilising an observed historical series{$\{{{P_1}^t,{P_2}^t, \cdots ,{P_T}^t|{P_i}^t \in {\mathrm{\mathbb{R}}^{{d_x}}}} \}$ at a time t to predict future values $\{{{Y^t}|\in {\mathrm{\mathbb{R}}^{{d_y}}}} \}$
 , where ${\mathrm{\mathbb{R}}^{{d_x}}}$
 and ${\mathrm{\mathbb{R}}^{{d_y}}}$
 are the dimensions of the input/output data. The time-series forecasting task can be classified into point forecasting and probabilistic forecasting. This classification depends on whether the prediction output is a single-point forecast or a probability distribution (Rong Li and Jilkov, Reference Rong Li and Jilkov2003). Point forecasting usually applies to scenarios requiring a single deterministic outcome, such as sales volume forecasting and inventory management, etc. Probabilistic forecasting is more suitable for areas where uncertainty and risk management must be considered, such as financial market and natural disaster forecasting. In this study, point prediction was used to predict ship trajectories.
2.2 Related work
In recent years, the research directions for time series mainly involved statistical and machine-learning methods (Ismail Fawaz et al., Reference Ismail Fawaz, Forestier, Weber, Idoumghar and Muller2019). The statistical methods primarily included traditional prediction methods, such as the Kalman filter, linear regression and various improved Kalman filtering algorithms.
Auto-regressive integrated moving average (ARIMA) models were proposed to improve forecasting accuracy (Zhang, Reference Zhang2003). To improve the availability of AIS dynamic data and to enhance vessel monitoring capabilities, a Kalman filtering (KF) algorithm was proposed (Jaskólski, Reference Jaskólski2017). The algorithm predicts the trajectory information by calculating position and heading estimates, which improves the ability to track and monitor vessel movements within traffic separation schemes (TSS) and navigational channel areas. A polynomial Kalman filter and machine learning were combined to predict a short-term time series (Hur, Reference Hur2021). In predicting short-term wind speed time series, an Extended Kalman filter based on a 3D wind field model and a nonlinear rotor model was utilised to estimate first, and then machine learning was used to predict wind speed. Univariate and multivariate harmonic decomposition methods were used to model and predict time series (Garibo-Morante and Ornelas Tellez, Reference Garibo-Morante and Ornelas Tellez2022). A state-space representation derived from Fourier series analysis was used to describe arbitrary signals, and the frequency values of the harmonic content were used to define the state variables. The signal was characterised using a time-varying linear state-space model to generate an optimal state observer (Kalman-Buki filter). Once the observer has converged and the state (harmonics) is constant, the observer model is ready for time-series prediction.
The traditional mathematical methods relied on assumptions such as data stationarity, linearity and normality. Still, in the real world, the motion of a vessel is affected by various factors and is often a nonlinear and dynamic change process. Moreover, although there are some improved traditional methods for modelling nonlinearities and time-varying properties, traditional approaches overlook the temporal correlations present in time-series data and fail to learn the manoeuvre characteristics of vessels thoroughly.
The optimal DMS strategy is applied to select the best model at each timestep within a moving window. This approach significantly enhances forecasting efficiency but needs to improve in predicting accuracy. A conditional time-series generative adversarial network (CTGAN) has been proposed (Jia and Ma, Reference Jia and Ma2023). It leverages a trajectory generator to capture the inherent dynamics of vessel movement and produce future trajectory suggestions. Meanwhile, an intent classifier is utilised to assess whether the trajectory suggestions align with hidden intentions. Through an adversarial training strategy, the trajectory generator and intent classifier form a closed-loop system, providing mutual feedback, thereby enabling the generation of intent-constrained trajectories for prediction. The Reformer model is proposed based on the Transformer model (Kitaev et al., Reference Kitaev, Kaiser and Levskaya2020) to achieve higher efficiency. The time complexity is reduced by substituting dot-product attention with a locality-sensitive hashing mechanism. In addition, it utilises reversible residual layers instead of standard residual layers. This enables activation storage to occur only once during the training process. The Reformer model performs comparable to the Transformer model when dealing with long sequences, exhibiting enhanced memory efficiency and faster processing speeds. An efficient transformer-based model, the Informer, is designed for long sequence time-series forecasting (LSTF). The ProbSparse self-attention reduces the computational complexity of attention mechanisms by focusing on the most important queries and effectively sparsifying the attention matrix. This approach improves the inference speed of LSTF (Zhou et al., Reference Zhou, Zhang, Peng, Zhang, Li, Xiong and Zhang2021). Despite this method's progress, it tends to fail in capturing the overall characteristics/distribution of time series in some cases. To further enhance the performance of the transform-based model, a frequency-enhanced model, named FEDformer, is proposed, combining the Transformer method with the seasonal-trend decomposition method. This can capture the global profile and detailed structures of time series (Zhou et al., Reference Zhou, Ma, Wen, Wang, Sun and Jin2022). A back-propagation (BP) neural network is introduced to online prediction under uncertain water conditions (Xu et al., Reference Xu, Liu and Yang2011). Recurrent neural network (RNN) is better suited for time series forecasting tasks than the BP neural network. Therefore, the gated recurrent unit (GRU) predicts unmanned underwater vehicles (UUV) trajectory and performs better than BP in prediction accuracy (Xu et al., Reference Xu, Liu and Yang2011). A convolution neural network (CNN)-LSTM model is proposed to improve prediction efficiency (Li and Li, Reference Li and Li2022). The incorporation of this CNN-LSTM architecture resulted in an enhancement of the algorithm's real-time performance. However, the accuracy and robustness of the predictions need improvement. A context-aware LSTM (CLSTM) model that considers high-dimensional environmental factors has been proposed (Mehri et al., Reference Mehri, Alesheikh and Basiri2023). Research indicates that water depth, wave direction and height are the most significant high-dimensional factors influencing ship trajectories. The model prioritises factors with more considerable influence, resulting in a relative improvement of 15 ⋅ 31% in trajectory prediction accuracy compared with the LSTM model. To improve the prediction accuracy of ship trajectory, a PSO-LSTM model that uses the PSO algorithm to optimise the number of hidden units and learning rate of the LSTM model is proposed (Wang et al., Reference Wang, Hu, Zhu and Gao2022). However, the PSO algorithm is susceptible to convergence towards local optima. Thus, this method cannot ensure that the hyperparameter corresponds to the global optimum. In addition, there is still potential for improvement in optimisation time using the PSO algorithm.
Drawing upon the synthesis of prior research, it is evident that considerable progress has been made within the domain of time-series forecasting. Transformer-based models exhibit notable advantages in terms of efficiency when tackling LSTF tasks. However, the enhancement in prediction accuracy remains relatively modest. Models based on LSTM networks, when integrated with various algorithms, have demonstrated noteworthy improvements in either computational accuracy or efficiency. Nevertheless, maintaining predictive accuracy with high computational efficiency remains an ongoing challenge. In addition, the predominant focus in prior research has gravitated towards domains such as terrestrial transportation, electricity load prediction, meteorological data and various other time-series forecasting applications. Notably, the exploration of datasets within the maritime domain has been circumscribed, presenting ample opportunities for the advancement of time series analysis and forecasting endeavours within the maritime sector. In response to these research gaps, this paper introduces the PGL prediction model explicitly tailored for maritime ship trajectories. This innovative model significantly enhances prediction accuracy and markedly improves computational efficiency.
3. Hybrid PSO-GWO LSTM method
The PGL framework begins by introducing two key components: the hybrid PSO-GWO algorithm and the LSTM architecture. The hybrid PSO-GWO algorithm is presented as a key optimisation tool. At the same time, LSTM is highlighted for its proficiency in handling sequential data, underscoring its essential role within the PGL model.
3.1 Hybrid PSO-GWO algorithm
The PSO algorithm is characterised by its simplicity, ease of implementation, relative robustness to control parameters and high computational efficiency (Mirjalili and Lewis, Reference Mirjalili and Lewis2014). Despite its many advantages, it may suffer from limited global search capabilities and become mired in local minima when dealing with constrained problems, especially complex multi-modal problems (Kothari, Reference Kothari2012). Given the limitation of global search capabilities, the algorithm's performance can apparently be influenced by the initial particle positions.
The GWO algorithm emulates grey wolves' leadership hierarchy and hunting mechanism in the natural ecosystem. This algorithm possesses the remarkable ability to approximate solutions of high quality and exhibits noteworthy characteristics associated with convergence (Mirjalili et al., Reference Mirjalili, Mirjalili and Lewis2014). Te GWO excels in global searching and exhibits adaptability to multi-modal problems, but GWO is unsuitable for high-dimensional parameter optimisation problems.
To overcome the shortcomings of the GWO and PSO algorithms, the GWO and PSO algorithms are combined to form the hybrid GWO-PSO algorithm. The hybrid algorithm utilises the global search capability and adaptability of GWO and takes advantage of the simplicity and efficiency of PSO. This combination seeks a harmonious equilibrium between global and local exploitation, enhancing overall efficacy in addressing optimisation problems.
The PSO algorithm initially optimises the parameter values, and the GWO algorithm is leveraged to perform additional optimisation, ultimately updating the position of the particle swarm, leveraging GWO's excellent global search capabilities to reduce the impact of initial particle positions and reduce the likelihood of getting stuck in local minima. In the hybrid PSO-GWO algorithm, the process can primarily be divided into three phases: (1) initialisation, (2) iterative optimisation, and (3) result output.
In the initialisation phase, this algorithm first creates a particle population and defines the dimensions of the solution vectors. The maximum number of iterations, as well as the upper and lower bounds of the search space, must be identified manually. Subsequently, the algorithm initialises the position and velocity of each particle while setting fundamental control parameters. The fitness value of each particle is calculated after initialisation.
Then, it updates the global best solution and local best solution, labelling the top three solutions as alpha wolf (α wolf), beta wolf (β wolf), and delta wolf (δ wolf). These ‘wolves’ play different roles in the GWO algorithm. Typically, alpha wolf represents the best fitness value, beta wolf denotes the second best, and delta wolf is the third best. The grey wolf updating employs specific weighting parameters to update particle positions and velocities, guided by the alpha, beta, and delta wolf positions. Then, the position of particles is updated again by a modified particle updating formula. It iteratively repeats the above steps in each iteration until the maximum number of iterations is reached.
(1) Initialisation phase
(2) Firstly, the PSO algorithm emulates the social interactions and navigation dynamics of particles within a multidimensional search space. A population of particles is initialised within the solution space, with each particle representing a potential solution to the optimisation problem. Assuming the position of a particle i in D-dimensional space at iteration t is represented as $x_i^t = [{x_{i1}^t,x_{i2}^t, \cdots x_{iD}^t} ]$
 , and its velocity as $v_i^t = [{v_{i1}^t,v_{i2}^t, \cdots v_{iD}^t} ]$.
(3) Iterative optimisation phase


Set the fittest solution of each particle as ${x_{ibest}}$ and set the min$\{{{x_{ibest}}} \}$
 as ${g_{best}}$
 . In grey wolf populations, grey wolves are divided into four types. The fittest solution is defined as alpha wolf (α wolf) to simulate the first-ranked wolf, and the second and third fittest solutions are named beta wolf (β wolf) and delta wolf (δ wolf) to simulate the positions of the second-ranked and third-ranked wolves, respectively. The remaining candidate solutions are assumed to be omega wolf (ω wolf) to simulate the positions of subordinate wolves (the fourth-ranked wolves). The solving is guided by the α, β and δ wolves, and the ω wolves are led by these three wolves.
The subsequent optimisation process of grey wolf updating can be delineated into two primary steps: encircling prey and hunting. Equations (1) and (2) (Mirjalili and Lewis, Reference Mirjalili and Lewis2014) are used to mathematically model the trapping behaviour of grey wolves. The formulas are listed as follows:


where t represents the current iteration number, A and C are coefficients, ${X_P}$ represents the position of the prey, and $X(t )$
 represents the position of the individual grey wolf in the t th generation. The calculation methods for A and C are as follows:


where ${r_1}$ and ${r_2}$
 are random values in the range [0, 1]. To simulate the approach to the prey, A is a random value chosen from the interval [−a, a], and $\vec{a}$
 decreases from 2 to 0 during the iteration process.
The mathematical model of the individual grey wolf tracking the location of prey is shown in Equations (5)–(7) (Mirjalili et al., Reference Mirjalili, Mirjalili and Lewis2014):


where ${D_\alpha }$ , ${D_\beta }$
 and ${D_\delta }$
 represent the distances between the α wolf, β wolf, δ wolf and other individuals, respectively. The updated position of α wolf, β wolf and δ wolf can be calculated as follows:


where ${X_1}$ , ${X_2}$
 , and ${X_3}$
 represent the positions updated by the α wolf, β wolf and δ wolf, respectively.
Subsequently, the positions of α wolf, β wolf and δ wolf are utilised to update the velocity of the particles. The position of each particle is updated according to the equation listed as follows:

where d denotes the dimension index. The matrix form expression of the formula is:

where ${X^{t + 1}}$ is the position matrix at the next iteration (t + 1), which contains the positions of all particles; ${X^t}$
 is the position matrix at the current iteration (t), which includes the current positions of all particles; ${V^t}$
 is the velocity matrix at the current iteration (t), which contains the current velocities of all particles.
After preliminary updating of the particle swarm, the position of the particles requires updating. The velocity update equation (Equation 13) (Mirjalili and Lewis, Reference Mirjalili and Lewis2014) involves both cognitive and social components, enabling particles to navigate towards their own best-known solution $p_i^t$ and the best solution found by the entire swarm ${g^t}$
 :

where w is the inertia weight controlling the particle's tendency to maintain its previous velocity, ${c_1}$ and ${c_2}$
 are acceleration coefficients dictating the influence of personal and global bests, and ${r_p}$
 and ${r_g}$
 are random values sampled from a uniform distribution. Set the fittest solution of each particle as ${x_{ibest}}$
 and set the min$\{{{x_{ibest}}} \}$
 as ${g_{best}}$
 .
Nevertheless, in the hybrid GWO-PSO algorithm, the global best value ${g^t}$ and each particle's personal best value $p_i^t$
 in the original formula are replaced by ${X_1}$
 , ${X_2}$
 , ${X_3}$
 . The new formula is listed as follows:

where ${r_1}$ , ${r_2}$
 and ${r_3}$
 are random values sampled from a uniform distribution.
Throughout the entire iteration phase, repeatedly execute the steps mentioned above until the required number of iterations is achieved.
(1) Result output phase.
When the iteration termination condition is met, the best position can be calculated by taking an average of α wolf, β wolf and δ wolf, as show in Equation (15) (Mirjalili et al., Reference Mirjalili, Mirjalili and Lewis2014) :

Hybrid PSO-GWO.

3.2 Introduce LSTM neural network
The traditional feedforward neural network does not effectively process time-series prediction, and the gradient explosion problem cannot be effectively suppressed by it (Kamboj, Reference Kamboj2016; Kiliçarslan, Reference Kiliçarslan2023). Recurrent backpropagation, as a method to learn to store information over extended time intervals, often suffers from prolonged training times, due to insufficient, decaying error backflow (Lipton et al., Reference Lipton, Berkowitz and Elkan2015). Conversely, an LSTM neural network can relief gradient explosion and capture trajectory characteristics (Hochreiter and Schmidhuber, Reference Hochreiter and Schmidhuber1997).
LSTM tackles the challenge of learning long-term dependencies by utilising specialised units and utilising multiplicative gate units to control access to the data flow. The LSTM network introduces a memory cell and incorporates specific gates to control the access and updating of the memory cell. One of these gates, the output gate, regulates the flow of information from the memory cell. Another gate, the input gate, determines when external data should be input into the memory cell. The forget gate is a mechanism that resets the content of the memory cell. In the LSTM network, the current timestep's input data and the previous timestep's hidden state are fed into the three gates (input gate, forget gate and output gate). Figure 1 illustrates the concise structure of the LSTM. These data are processed through three fully connected layers with sigmoid activation functions to calculate the input, forget, and output gate values. Consequently, the values of these three gates are constrained within the range of 0 to 1.
LSTM structure diagram

As the structure of LSTM is shown in Figure 1, the mathematical expression for the LSTM neural network is introduced. Assume there are h hidden units, a batch size of n, and d input numbers. Therefore, for input ${X_t}\epsilon {R^{n \times d}}$ and the hidden state of the previous timestep ${H_{t - 1}}\epsilon {R^{n \times d}}$
 , the values of the input gate, forget gate and output gate can be calculated by Equations (16)–(18) (Hochreiter and Schmidhuber, Reference Hochreiter and Schmidhuber1997) as follows:


where ${W_{xi}}$ , ${W_{xf}}$
 , ${W_{xo}}\; \epsilon {R^{d \times h}}$
 and ${W_{hi}}$
 , ${W_{hf}}$
 , ${W_{ho}}\; \epsilon {R^{h \times h}}$
 are weight parameters, ${b_i}$
 , ${b_f}$
 , ${b_o}\; \epsilon {R^{1 \times h}}$
 are bias parameters, and $\; \sigma ({\cdot} )$
 is the Sigmoid function.
As show in Equation (19), the computation of candidate memory cell is similar to the calculation of the three gates described aove. But it uses the tanh function as the activation function, which has a value range of (−1, 1) to control the candidate memory cell. The equation at timestep t is derived as:

where ${W_{xc}}\; \epsilon {R^{d \times h}}$ and ${W_{hc}}\epsilon {R^{h \times h}}$
 are weight parameters, and ${b_c}\; \epsilon {R^{1 \times h}}$
 is the bias parameter.
For the computation of the memory cell, the input gate controls how much new data from the hidden memory unit is incorporated. In contrast, the forget gate controls how much of the memory cell content should be retained. The specific mathematical expressions are:

Suppose the value of the forget gate remains 1 and the value of the input gate remains 0; then, the past memory cells will be preserved and passed to the current timestep over time.
This design is being introduced to alleviate the vanishing gradient problem and better capture long-range dependencies in the sequence. Finally, we can use Equation (21) to determine the hidden state through the above values, the calculate expression is listed:

With the constrain of activation function, the value of ${H_t}$ is ensured within the interval (−1, 1). When the output gate approaches 1, it effectively passes all memory information to the prediction part. However, when the output gate approaches 0, it retains all information within the memory cells without updating the hidden state.
3.3 PGL structure and methodology
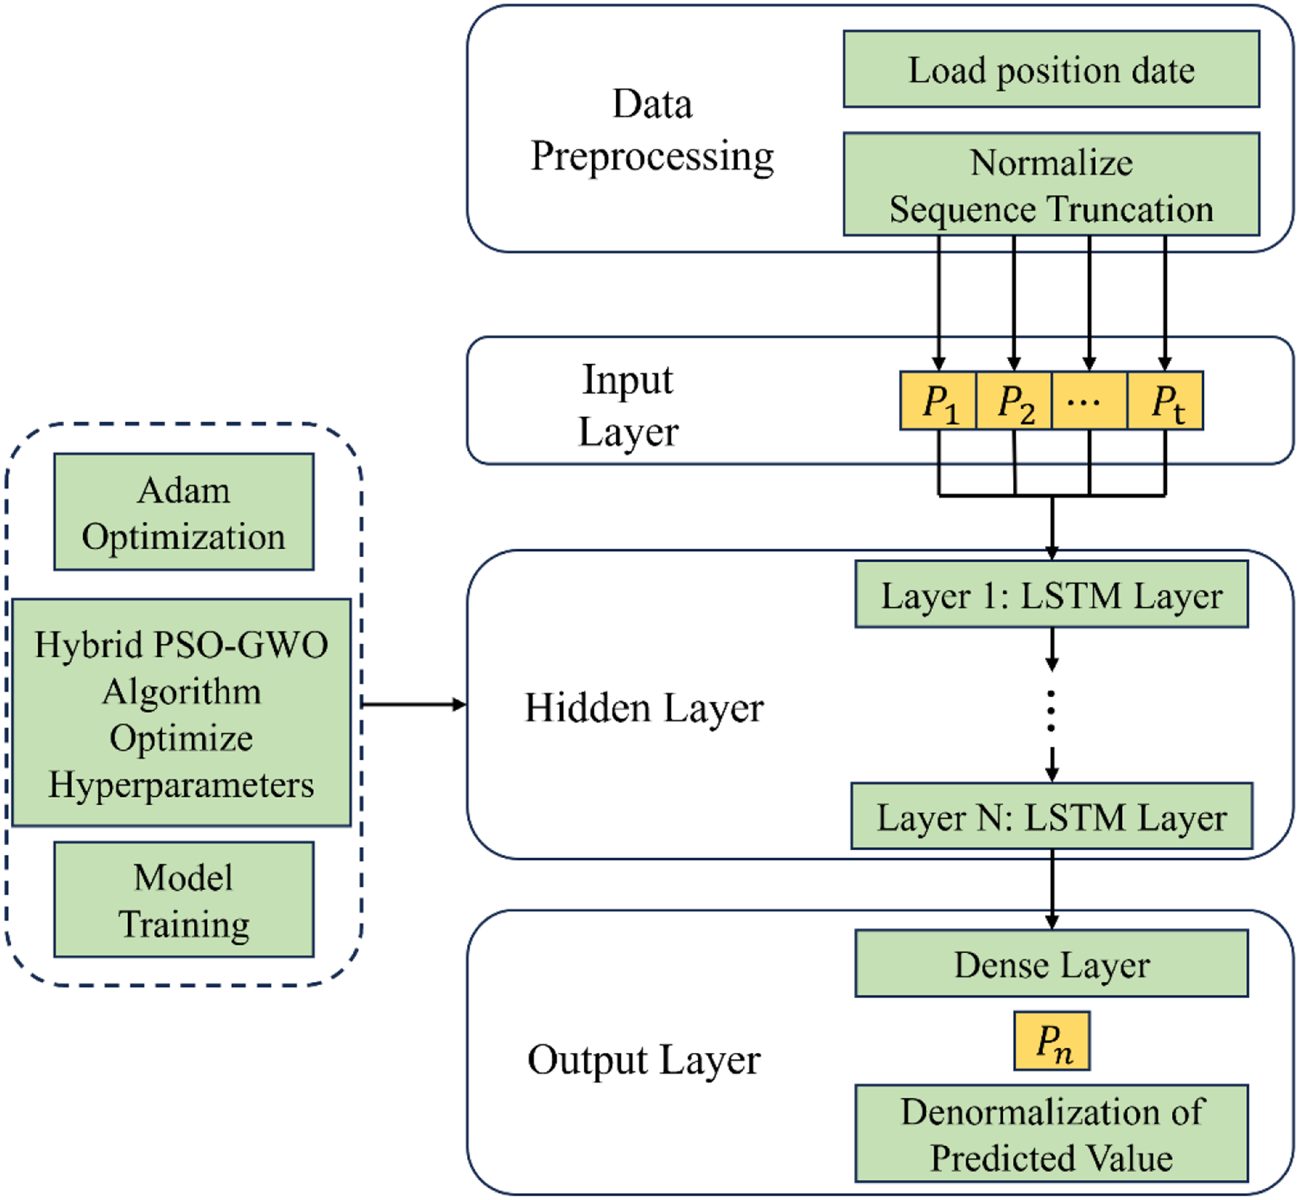
Within the data processing segment, PGL employed a stack of multiple LSTM layers, complemented by dense layers serving as the input and output layers. Notably, the optimisation of hyperparameters has been tackled by introducing a hybrid PSO-GWO algorithm. The comprehensive framework of PGL is depicted in Figure 2.
PGL model structure

The fundamental premise of this study revolves around rolling sequence prediction methodology. In this approach, the dataset is thoughtfully divided into numerous distinct sequences. Subsequently, these individual sequences are sent into an LSTM model, where each sequence predicts its respective coordinates. Furthermore, the hybrid PSO-GWO algorithm is tailored to address the intricate challenge of determining the optimal LSTM hyperparameters. It can elevate hyperparameter optimisation and overcome the limitations encountered in the previous PSO algorithms.
Before utilising the LSTM model to predict position, operating basic data pre-processing can efficiently prevent overfit and improve prediction accuracy. For reasons like signal interference, decoding errors, etc., data missing is a typical problem; the presence of blank entries in the dataset can impact the accuracy of the model predictions. Consequently, it is necessary to impute the missing data. Basis spline (B-Spline) is a widely used mathematical tool in computer graphics, curve and surface design. It is a type of polynomial interpolation method applicable for data fitting, smoothing and shape control (Wang et al., Reference Wang, Pottmann and Liu2006). In this study, we utilise third-order spline B-curves for interpolation to mitigate data discontinuities. The third-order B-spline basis functions possess local support, which limits their influence on adjacent points, making them highly useful for curve smoothing and shape adjustments. Then, overfitting is mitigated, and model generalisation is enhanced by employing dropout and regularisation techniques; detailed data pre-processing information can be found in Section 4.2.
The hybrid-PSO-GWO algorithm is introduced to optimise the number of hidden units, the prediction horizon and the number of hidden layers. The fitness function of the hybrid-PSO-GWO algorithm is listed as:

The mean absolute error (MAE) is employed to gauge the disparity between predicted and actual values, visually representing prediction errors. Unlike other metrics, MAE does not excessively accentuate larger error values, rendering it a more representative measure of overall predictive accuracy. The calculation expression is:

The sequence data are not directly inputted to the LSTM layer. Initially, a dense layer serves as the input layer, which is used for feature extraction and input transformation. This aids in converting the original data into higher-level abstract features, enabling the LSTM layer to understand and process the data better. Through the stacking of multiple LSTM layers, the network extracts and learns features from the sequence. A dense layer is the output layer to adjust the data dimensions and produce the final prediction. During training, parameters are optimised within the parameter space by combining the hybrid GWO-PSO algorithm module and the ADAM optimiser to obtain the best parameter settings and improve prediction performance. The basic steps of model training are:
Step 1: Dataset loading and pre-processing. The initial stage of our research involves loading the dataset, followed by data pre-processing procedures. These pre-processing tasks encompass data cleansing, missing values, and feature scaling or encoding. This meticulous process ensures the dataset is optimal for subsequent analysis.
Step 2: Dataset partitioning. Subsequently, the dataset is divided into the training and test sets. Then, the data is divided into multiple prediction sequences according to the predicted step size, as mentioned in Section 2.1. The training set is designated for training the PGL model, and the test set is reserved for evaluating the model's predictive accuracy.
Step 3: Parameter initialisation and model instantiation. The third step entails the initialisation of crucial model parameters and the instantiation of the PGL model. Prudent parameter initialisation is paramount to facilitate effective model training and convergence.
Step 4: Training the PGL model. The training dataset is introduced to the LSTM layers in this critical phase. Concurrently, the hybrid PSO-GWO algorithm is used to fine-tune hyperparameters. The overarching objective is to minimise the fitness value within the established research space. This optimisation process culminates in an intricately calibrated model adept at discerning intricate data patterns.
Step 5: Model evaluation on the test set. Ultimately, the efficacy of the PGL model is assessed by exposing it to the test dataset. This evaluation phase serves as a litmus test for the model's predictive accuracy and capacity to generalise to unseen data instances. It provides valuable insights into the model's real-world applicability and performance.
4. Experiment results comparison and analysis
The experiment involved utilising three models: LSTM, PSO-LSTM and PGL, all of which were trained using identical datasets. Subsequently, these trained models were tested by the same test dataset. The comparative assessment of predictive accuracy among these methods was conducted based on mean squared error (MSE) and MAE.
4.1 Dataset description
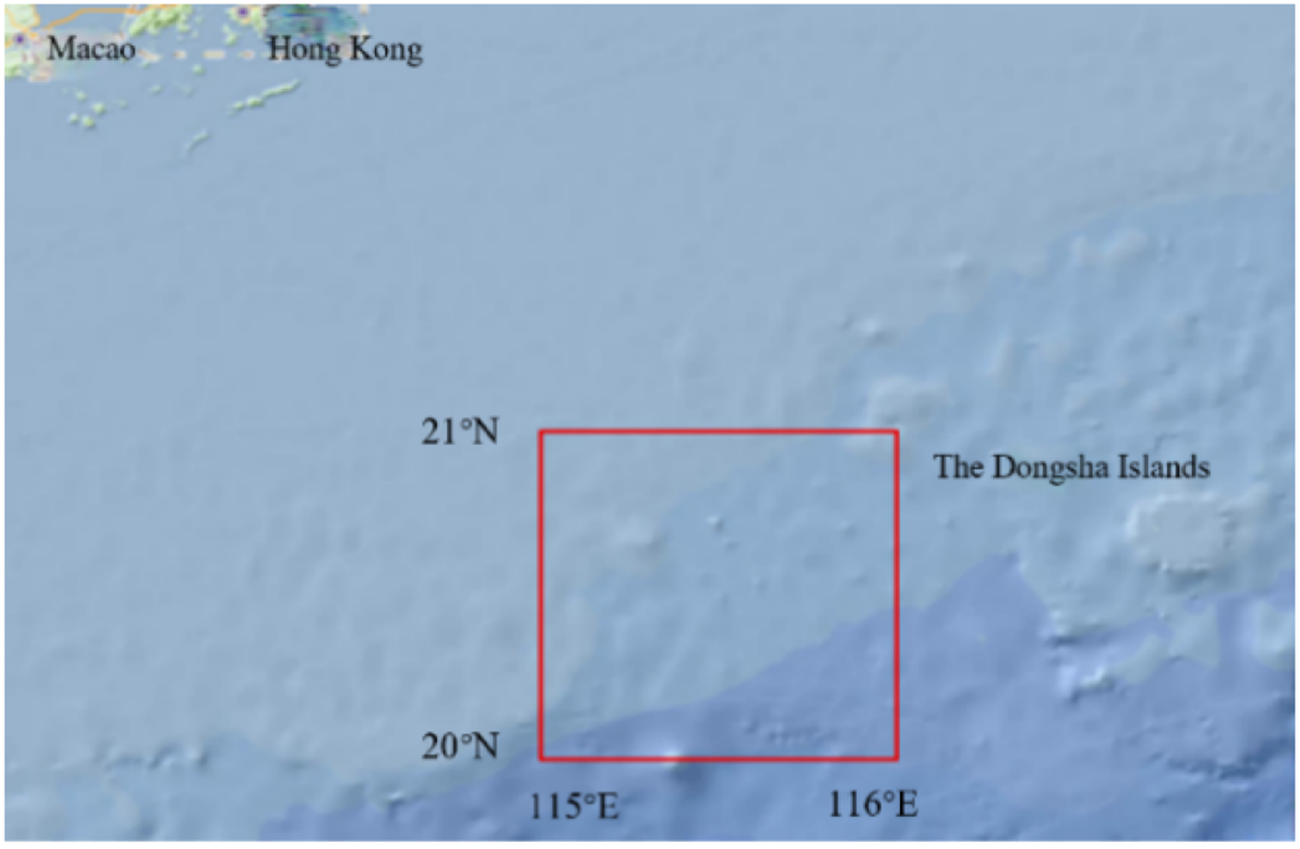
The dataset utilised in this study consists of Global Navigation Satellite System (GNSS) positioning data from shipborne BeiDou navigation devices. This dataset primarily collects BeiDou navigation device positional information from ships operating within the South China Sea over five days. It contains ship identifiers, longitude and latitude coordinates, timestamps of data upload, velocity, and heading information. The partial dataset information is listed in Table 1; speed over ground (SOG) represents the current moment's speed over ground in knots, while heading indicates the vessel's current heading in degrees. Figure 3 displays the latitude and longitude range of the dataset.
Information of datasets

The latitude and longitude range of the dataset

4.2 Data pre-processing
Due to the intricate maritime environment in real-world scenarios, signal loss or device malfunctions often lead to inaccuracies and missing positional reports. Therefore, data pre-processing is imperative to address these issues.
Data cleaning is a fundamental stage in data pre-processing. Its primary objective is to uncover and address errors within the data, ultimately enhancing its quality and usability. For this dataset, detecting and addressing outliers or anomalous points can prevent them from affecting the results unreasonably. A distance threshold-based outlier detection method is employed; if a data object is far from most other data points, it should be considered an outlier. Distance-based approaches are considerably simpler than statistical methods because defining a distance metric for a dataset is much easier than determining its distribution. Typically, this method involves assigning an outlier score to each data object. The most straightforward approach is to calculate the outlier score of a data object and its K-nearest neighbours. The smaller the sum of distances to the K-nearest neighbours, the lower the outlier score, and, conversely, the larger the sum of distances, the higher the outlier score. Therefore, a distance threshold is set; once the outlier score exceeds this threshold, the data point is classified as an outlier. Distance-based methods are straightforward and user-friendly. However, the technique only sets a fixed distance threshold and does not consider changes in ship speed. Therefore, we set the distance threshold for the period based on the average speed per hour to improve the accuracy of the judgement. In addition, the distance between neighbouring points cannot exceed the maximum sailing distance for that period, so the data point ${P_i}$ serves as the centre of a circle, and the maximum ship travel distance within that time frame acts as the radius (Chakraborty et al., Reference Chakraborty, Chaterjee, Malakar and Sarkar2022). Any data points beyond this distance threshold are considered outliers and removed from the dataset.
On the other hand, data imputation is applied to address the gaps in the original data and those created by removing outliers. In this case, a cubic spline B-curve interpolation method is used to fill in and compensate for missing data values. The formula for a cubic spline curve is provided as:

where ${P_i}$ represents data point, ${F_{i,k}}(t )$
 represents the kth-order B-spline basis functions; the formula of ${F_{i,k}}(t )$
 is as follows:

where $\left( {\begin{array}{*{20}{c}} m\\ {k + 1} \end{array}} \right)$ represents the factorial.
This approach helps in restoring completeness to the dataset by filling in missing values using a smooth spline curve, ensuring that subsequent analyses or modelling are not compromised by data gaps.
4.3 Experiment results
The LSTM, PSO-LSTM and PGL were utilised to predict the ship trajectory based on the same dataset. All experiments were conducted on the same computer configuration:
• Graphics Card: RTX 3070 Ti laptop edition
• CPU: Intel Core i7-12700
The optimised hyperparameters were: num_layers, representing the count of LSTM layers; seq_length, denoting the length of the input sequence; and hidden_size, indicating the quantity of hidden units. The upper bounds within the search space for these hyperparameters were set as [10, 12, 320], whereas the lower bounds were defined as [3, 3, 32]. We set up 100 rounds of iterations and performed 400 rounds of optimisation for each iteration. The outcomes of the prediction process are visually presented in Figure 4; further insights can be gleaned from the data presented in Figure 4(d). The results of hyperparameter optimisation are listed in Table 2; only the parameters of the LSTM were determined through empirical tuning. Thus, the time taken for parameter selection for the LSTM is not included in the comparative table.
Trajectories: (a) LSTM trajectory prediction; (b) PSO-LSTM trajectory prediction; (c) PGL; (d) overall trajectory prediction comparative display graph

Optimised hyperparameters

The loss of experiment and time consumption of optimisation can be found in Table 3. Nine sampling points along the entire trajectory are selected to further demonstrate the prediction errors of the three methods. The prediction errors of LSTM, PSO-LSTM and PGL at these nine points are listed in Table 4, with the unit of measurement being latitude and longitude. It can be observed from the predictive result graphs that the LSTM model accurately predicts trajectories in the initial half but lacks stability. In the latter half, the predicted trajectory deviates from the actual trajectory. Generally, PGL exhibits a 9 ⋅ 56% lower in MAE and an 8 ⋅ 16% lower in MSE compared with PSO-LSTM. However, there is a substantial disparity in the training time for optimisation between the PGL and PSO-LSTM models. PGL completes 100 iterations in 3234 ⋅ 4826 s, while PSO-LSTM requires 100 iterations and takes 4408 ⋅ 7339 s. Figure 5 depicts each method's loss value variation curves during the initial 100 iterations. From these loss curves, it is evident that the pure LSTM model with the Adam optimiser exhibits the lowest iteration efficiency and considerable fluctuations in training loss, and the PGL model consistently outperforms the PSO-LSTM model throughout the entire duration of the iterations. These findings strongly suggest that PGL model enhances predictive accuracy with significant improvements in optimisation speed.
Experiment results

Prediction errors

A comparative chart of loss function variation over the first 100 training epochs

To further demonstrate the real-time performance of PGL, pre-trained PGL, pre-trained PSO-LSTM and pre-trained LSTM are utilised to predict trajectory with the same test dataset. The computation times of pre-trained PGL, PSO-LSTM and LSTM are listed in Table 5. The data shows that PGL obtained the best MAE and MSE with the shortest computation time. PGL has better real-time performance.
Real-time performance comparison

5. Conclusion
Comparative analysis of the data demonstrates that PGL surpasses PSO-LSTM in terms of accuracy for ship trajectory prediction and achieving a 26% increase in iteration speed simultaneously. This represents that PGL enhances ship trajectory prediction's precision and real-time capabilities. However, PGL also exhibits limitations. Its generality is constrained as it encounters variations in accuracy when handling different types of trajectory data. For example, diverse ships navigating in various maritime regions have distinct characteristics. Fishing vessels can be categorised into different types based on their fishing methods, such as trawlers, purse seiners and encircling nets. These fishing methods greatly influence their movement patterns and affect the prediction accuracy. Furthermore, when compared with cargo ships involved in international trade, fishing vessels typically remain within a specific area, and their overall activity range is relatively small. By contrast, international cargo ships have a more extensive operating range, and their trajectories are relatively simple and fixed. For different trajectory patterns, PGL must be retrained on the specific dataset to obtain the optimal parameters; otherwise, the predictive accuracy is likely to experience a significant decrease.
Furthermore, PGL still needs to overcome the constraints inherent to LSTM. While it exhibits commendable performance in short-term time-series prediction tasks, its predictive accuracy significantly diminishes beyond 48 steps of forecasting (Zhou et al., Reference Zhou, Zhang, Peng, Zhang, Li, Xiong and Zhang2021). To enhance the model's performance on long-time sequence tasks in the future, it is advisable to consider adopting an encoder-decoder architecture inspired by Seq2Seq and Transformer-based models.
Acknowledgement
This project is supported by the National Natural Science Foundation of China (52431012, 62033009) and the Creative Activity Plan for Science and Technology Commission of Shanghai (24510712400, 23550730300).